

Abstract
AIM
To evaluate the diagnostic properties of wide-field fundus autofluorescence (FAF) scanning laser ophthalmoscope (SLO) imaging for differentiating choroidal pigmented lesions.
METHODS
A consecutive series of 139 patients were included, 101 had established choroidal melanoma with 13 untreated lesions and 98 treated with radiotherapy. Thirty-eight had choroidal nevi. All patients underwent a full ophthalmological examination, undilated wide-field imaging, FAF and standardized US examination. FAF images and imaging characteristics from SLO were correlated with the structural findings in the two patient groups.
RESULTS
Mean FAF intensity of melanomas was significantly lower than the FAF of choroidal nevi. Only 1 out of 38 included eyes with nevi touched the optic disc compared to 31 out of 101 eyes with melanomas. In 18 out of 101 melanomas subretinal fluid was seen at the pigmented lesion compared to none seen in eyes with confirmed choroidal nevi. In “green laser separation”, a trend towards more mixed FAF appearance of melanomas compared to nevi was observed. The mean maximal and minimal transverse and longitudinal diameters of melanomas were significantly higher than those of nevi.
CONCLUSION
Wide-field SLO and FAF imaging may be an appropriate non-invasive diagnostic screening tool to differentiate benign from malign pigmented choroidal lesions.
Keywords: imaging, autofluorescence, scanning laser ophthalmoscopy, choroidal lesion, melanoma
INTRODUCTION
Choroidal Melanoma (CM) is the most common primary malignancy of the eye[1]–[3]. It metastasizes most likely into the liver, followed by pulmonary, bone or even skin metastasis, whereas local spread may occur through the overlying Bruch membrane, into the subretinal space or towards the orbit[4],[5]. Fortunately, the incidence of CM is relatively low, with approximately six new cases per million per year. In contrast, benign melanocytic choroidal nevi (CN) are common and can be found in 2%-5% of the US population[6],[7]. CN are the most common clinically detected intraocular tumors, and even if the risk is relatively low, there is a small but present probability to evolve into malignant melanoma[8],[9]. Given that transformation probability and the fact that tumor thickness strongly correlates to mortality rates of patients with choroidal melanoma and metastasis is likely to occur before the diagnosis of the primary tumor, early detection and an accurate differentiation and diagnosis of the choroidal lesion is of crucial importance[10]–[13].
Biomicroscopy together with fundus photography and ultrasound echography are widespread and most commonly used techniques to diagnose and monitor choroidal lesions. But especially in smaller lesions, both techniques are of lower value to differentiate pigmented lesions of the fundus not being obviously benign or malign. In clinical practice, a combination of different techniques including biomicroscopy, standardized echography and sometimes even fluorescein or indocyanine green angiography an help to increase diagnostic sensitivity, however an accurate differentiation of choroidal borderline lesions remains a challenge also for the expert[9],[14]–[17].
In those borderline lesions, standardized echography has proven to be a well established, highly sensitive, and specific method to measure and differentiate intraocular tumors[18]. A number of studies, including those of Verbeek et al[19], Romani et al[20] and Ossoinig et al[21], have demonstrated an impressingly high sensitivity and specificity of that diagnostic tool in differentiation of choroidal melanoma from benign nevi. However, it is dependent on the presence of an ultrasound specialist and on the expert́s experience, which adds to increasing medical costs and therefore cannot be obtained in every eye center or clinic.
Recently, a novel ultra-wide-field scanning laser ophthalmoscope with 2 laser wavelengths, the Optomap Panoramic 200Tx (Optos PLC, Dunfermline, Fife, Scotland, UK), was developed. The system allows non-mydriatic imaging and provides additional image information by differentiating the 2 laser scans and an additional wide-field fundus autofluorescence (FAF) detection modality. Optomap Panoramic 200Tx images encompass not only the posterior pole but also extend over the equator[22]. In a previous study of our group, an evaluation of peripheral fundus images obtained with non-mydriatic wide-field SLO imaging provided substantial information to differentiate non-malignant from malignant choroidal lesions[23].
Works from other groups have demonstrated that FAF is a useful additional diagnostic technique to help to successfully differentiate choroidal lesions by detecting lipofuscin, a strong risk factor for choroidal melanoma[24]. However, FAF was up until recently limited to central and middle peripherally located choroidal lesions[25]–[28].
The goal of this prospective study was to evaluate the diagnostic and differentiating value of wide-field SLO imaging and the recently introduced wide-field FAF in patients with both benign and malign choroidal lesions.
SUBJECTS AND METHODS
Subjects
A consecutive series of 139 eyes (68 right eyes and 71 left eyes) from 139 patients (58 men and 81 women), mean age 66y (range 30-89y) with clinically diagnosed melanocytic choroidal tumors were included in this study. Out of those, 101 had established choroidal melanoma [CM, defined by proven growth on repeated ultrasound (US) follow-up examinations]. Of these 101 with established melanoma, 13 were untreated lesions, 98 were treated with radiotherapy [e.g. ruthenium brachytherapy or robotic radiosurgery (CyberKnife)]. The remaining 38 patients had CN as defined by no suspicion of malignancy based on clinical and US examinations and no growth for at least 2y. After informed consent was obtained, all included patients underwent clinical examination, undilated Optomap imaging, standardized US examination, and standard retinal photography. All research was conducted in accordance with institutional guidelines and board approval and conformed to the tenets of the World Medical Association Declaration of Helsinki.
Methods
Standardized US examination
The same equipment was used for all patients for A-scan and B-scan examination (Ultrasound Cinescan-S, Memory Card Version S 2.07; QuantelMedical, Clermont-Ferrand, France).
In standardized US examinations, we evaluated each intraocular tumor according to the specific criteria described by Ossoinig et al[21]. The eye was open during the examination which consisted of a preliminary topographic B-scan to evaluate the shape of the lesion and measure both the maximum transverse, circumferential basal tumor diameter (T-direction) as well as the longitudinal, radial basal tumor diameter (L-direction) of the tumor base with calipers. A relatively low gain setting (unspecified) was used to obtain the best measurement, and we identified the inner sclera as the first distinct line of the tumor base that was continuous with the surrounding fundus. Tumor height measurements were then obtained only with the standardized A-scan. The standardized A-scan instrument was first set at tissue sensitivity, according to the principles first described by Hodes and Choromoka[18] and Ossoinig et al[21] with the probe placed at the opposite side of the tumor. Once the tumor surface spike and the scleral spike were displayed with their maximum height, we lowered the gain while continuously monitoring the screen until the peaks were distinct and clear. We obtained measurements by placing calipers on the peak of the tumor surface spike and the inner scleral spike and then took at least three high-quality images differing not more than 0.2 mm from each other. The examiner selected the photograph representing the most accurate measurement and recorded the tumor height. Other documented parameters were shape, internal reflectivity (low, medium, and high), internal structure (homogeneous-regular, heterogeneous-regular or irregular), vascularity (positive or negative), retinal detachment (positive or negative), and location of the choroidal lesion (posterior, middle peripheral or anterior).
Optomap imaging
Optomap imaging was performed without pupil dilation, prior to and independent of clinical and US examinations. Optomap imaging consisted of taking several images and saving the best image of each included eye for grading. The device takes one image in approximately 0.25s, thus avoiding motion artifacts. Total scanning time was about 3-5min, which included patient positioning, and was performed by an experienced technician or one of the authors (CS). Basic operation of the Optomap for ultra wide-field composite color fundus images is a scanning laser ophthalmoscope (SLO) with two laser wavelengths scanning at 532 nm (“green laser separation”) and 633 nm (“red laser separation”). The two images can be viewed separately or superimposed by specific software (Vantage V2, Optos PLC, Dunfermline, Fife, Scotland, and UK) to yield semi-realistic color imaging. The optical resolution was 3.900-3.072 pixels, resulting in approximately 17-20 pixels per degree. Wide-field FAF images were obtained using the same Optomap® Panoramic 200Tx. The wavelength for excitation was 532 nm and autofluorescence was detected by a broad band detector at 540 to 800 nm.
Image grading and analysis
The retinal images were loaded from the server to a viewing station (17-inch non-calibrated cathode ray color monitor) and assessed with the Optomap Vantage V2 software. This software allows basic image manipulations such as changing contrast and brightness and zooming, as well as measuring specific lesions using calipers. It also offers views of both composite color and single wavelength (red and green laser separation) images. We compared the images obtained at the different wavelengths to better differentiate the level at which the lesions were located; unlike the longer red laser wavelength, the green laser cannot penetrate significantly below the retinal pigment epithelium. Two experienced and blinded retina specialists graded independently the obtained images. They had not previously participated in patient examinations and were masked to all additional information such as visual acuity or clinical symptoms. They could, however, decline assigning a grade due to insufficient image quality, which was defined as not covering at least the central 60° of the posterior fundus including both the macula and the optic disc. Measurements and gradings included are the following:
1. Quantitative assessment of fundus autofluorescence (FAF) was made using software Image J (available at http://rsb.info.nih.gov). Each imaged tumor was measured for FAF intensity on an intensity scale ranging from 0 to 255, followed by calculating the mean intensity (FAF intensity) and the standard deviation of intensity (FAF irregularity) for all measured lesions.
2. Lesion appearance in “green laser separation” image (dark/bright/mixed)
3. Location of the lesion (margin touching the optic disc according to the risk factor classification of choroidal melanocytic lesions by Shields et al[9]; yes/no),
4. Existence of subretinal fluid at or around the pigmented lesion (yes/no),
5. Lesion size with transversal and longitudinal diameter measured in individual optic disc size (PD).
Statistical Analysis
We collected and analyzed all data using SPSS 17.0 (SPSS Inc, Chicago, IL, USA). A linear regression analysis was performed including all individually graded and measured variables (FAF, green laser separation appearance, location of the lesion, subretinal fluid and lesion size). A P value of <0.05 was considered as statistically significant.
RESULTS
On total, 139 eyes with choroidal melanocytic lesions were included, out of those 101 with established CM (see method section) and 38 with confirmed CN (Figures 1 and 2). Both groups (CM vs CN) did not differ significantly in age and sex from each other, see Table 1.
Figure 1. Optomap composite color (A), green laser separation (B), red laser separation (C) and fundus autofluorescence image (D) of a 72-year-old female patient with a choroidal melanoma of her right eye after radiation therapy. Lesion appears dark in red laser separation image compared to a mixed appearance in green laser separation image.
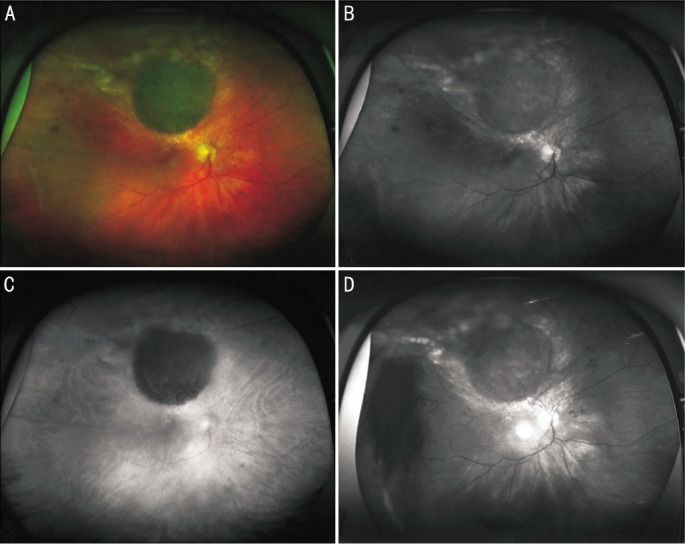
Figure 2. Optomap composite color (A), green laser separation (B), red laser separation (C) and fundus autofluorescence image (D) of a 45 year-old female patient with a CN in the macular area of her left eye. Lesion appears dark in red laser separation image compared to a mixed appearance in green laser separation image.
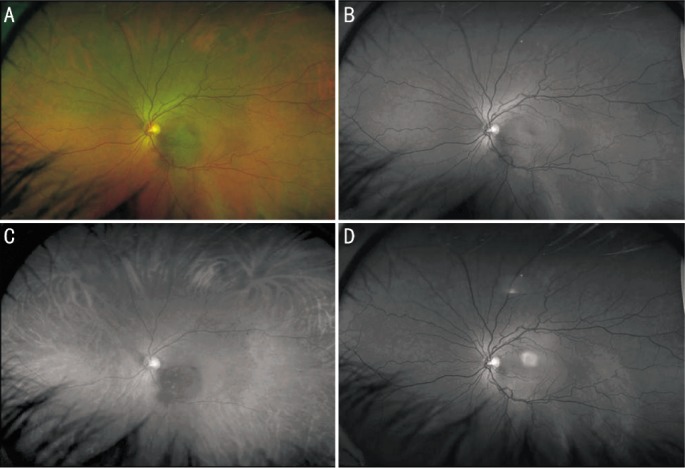
Table 1. Age and sex ratio in “melanoma” vs “nevus” group.
| Parameters | Melanoma group (n=101) | Nevus group (n=38) | P |
| Age (a) | 65.0 | 63.4 | 0.588 |
| Male/female ratio | 41/62 (40.6%/59.4%) | 17/21 (44.7%/55.3%) | 0.665 |
Mean fundus autofluorescence intensity (range: 0-255) of CM was 14.24±7.89 and significantly (P<0.001) lower than the FAF of CN with 22.22±20.75 (Figure 3). FAF irregularity of CM was 5.42±2.99 compared to an irregularity of 7.36±6.87 in CN (P=0.03). Lesion appearance in “green laser separation” between CM and CN showed a trend (P=0.085) towards a more mixed appearance of CM compared to CN (Table 2 and Figure 4). Regarding the localization of the lesion in relation to the optic disc, only 1 out of 38 included eyes with CN (2.6%) touched the optic disc compared to 31 out of 101 eyes with CM (30.7%, P<0.001). In 18 out of 101 CM (17.8%) subretinal fluid was seen at or around the pigmented lesion compared to none seen in eyes with confirmed CN (P=0.003). The mean transverse and longitudinal diameters in PD of the “CM group” was 5.6±3.0 PD and 5.2±2.3 PD respectively and significantly (P<0.001) higher than of the “CN group” with 2.6±1.5 PD and 1.8±1.3 PD respectively (Figure 5).
Figure 3. Mean fundus autofluorescence intensity (see method section) of established choroidal melanomas was 14.24±7.89 and significantly (P<0.001) lower than of confirmed choroidal nevi with 22.22±20.75.

The autofluorescence patterns seem to subdivide the melanoma group into two subgroups: one group with predominantly decreased autofluorescence intensity and one group with increased autofluorescence intensity.
Table 2. Lesion appearance in “green laser separation” images in the “melanoma” vs “nevus” group.
| Lesion appearance | Melanoma (n=101) | Nevus (n=38) | Total |
| Dark | 44 | 18 | 62 |
| Bright | 34 | 17 | 51 |
| Mixed | 23 | 3 | 26 |
| Total | 101 | 38 | 139 |
Figure 4. Lesion appearance in “green laser separation” images in “melanoma” vs “nevus” group in %.
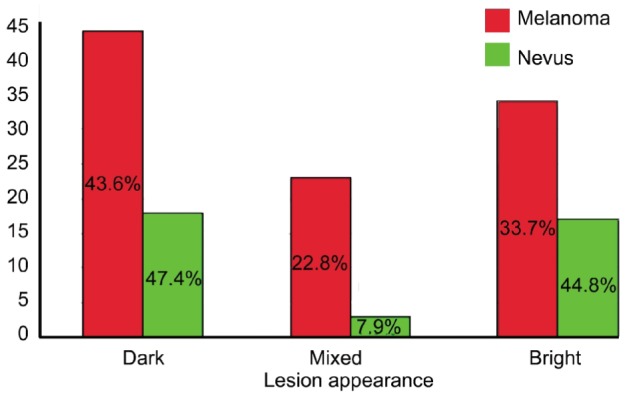
Figure 5. Maximal transverse and longitudinal diameters measured in individual optic disc size between the “melanoma” and “nevus” group with significantly higher mean maximal transverse as well as longitudinal diameters found in eyes with melanomas.

The variable FAF alone revealed a low sensitivity of 7% with a very high specificity of 97% to successfully differentiate CM from CN, while a regression analysis putting into account the above graded and measured criteria 3-5 except FAF and “green laser separation” revealed a sensitivity of 71.4% and a specificity of 87.3%. All graded parameters 1-5 including FAF and “green laser separation” as parameter 1 and 2 revealed a sensitivity of 68.8% and a specificity of 88.2% to correctly differentiate a choroidal CM from a CN with an overall Nagelkerke R2 reaching 0.661. Table 3 shows specific significance levels of each tested criterium 1-5 and its specific power logistic coefficient [Exp (B)] contributing to the calculated sensitivity and specificity.
Table 3. Logistic regression analysis showing the image properties of Optomap images [fundus autofluorescence (FAF), lesion touching optic disc, subretinal fluid, green laser separation image, transversal and longitudinal diameter in individual optic disc size] as variables with their contribution to successfully differentiate a melanoma from a nevus.
| Variable | B | S.E. | Wald | Sig. | Exp (B) | 95% CI for Exp (B) |
|
| Lower | Upper | ||||||
| FAF (Median) | -0.075 | 0.031 | 5.752 | 0.0016 | 0.927 | 0.872 | 0.986 |
| Lesion touching disc | 3.054 | 1.280 | 5.691 | 0.017 | 21.197 | 1.724 | 260.561 |
| Subretinal fluid | 19.584 | 9856.154 | 0 | 0.998 | 3.200E8 | 0 | . |
| Green laser separation | -0.790 | 0.370 | 4.548 | 0.033 | 0.454 | 0.220 | 0.938 |
| Transversal | 0.392 | 0.340 | 1.330 | 0.249 | 1.480 | 0.760 | 2.882 |
| Longitudinal | 0.416 | 0.325 | 1.642 | 0.200 | 1.516 | 0.802 | 20866 |
B: B-Coefficient; S.E.: Standard error; Wald: Wald-test; Sig.: Significance; Exp(B): Logistic coefficient; CI: Confidence interval
DISCUSSION
Though prevalence and incidence of CM are low, because of the severe and life-threatening prognosis in case of malignancy, early differentiation of malignant lesions from benign CN is of high importance. As diagnostic criteria for differentiating malignant from non-malignant lesions are controversial and often seem arbitrary, successful differentiation of transitional lesions remains challenging, even for experts size, both, the lesion's thickness and it́s basal diameter, seems to be one of the most estimated clinical parameters[7],[9],[14]–[16]. However, a substantial overlap does exist between CN and CM, particularly for tumors between 1.5 and 3 mm of thickness having a basal diameter between 5 and 9 mm.[29]
Since its introduction in the early 1970s by Ossoinig et al[21], standardized echography has become a valuable tool for validly differentiating benign from malignant pigmented fundus lesions. However, standardized ultrasound examination is very often time-consuming, can be obtained only in specialized ophthalmic centers with adequate devices and experienced manpower, and is sometimes controversial even for experienced operators[9],[16],[30]. In addition, the majority of all ophthalmic offices or clinics worldwide do not provide standardized ultrasound examination for patients with choroidal lesions. In times of exploding medical costs, screening techniques, which are less operator dependent and have an improved accuracy, are desirable and of growing importance.
In our study, the informative value of wide-field autofluorescence intensity alone to successfully differentiate confirmed CN from established CM revealed a very high specificity with 97% but also a very low sensitivity with 7%. Given those results, we conclude that FAF intensity alone is not an appropriate diagnostic tool to successfully differentiate pigmented choroidal lesions. However, in addition to other diagnostic features, due to its high specificity, it might help in ambiguous or borderline cases to better substantiate the diagnosis of CM.
In order to help clinicians better differentiate suspect lesions and to provide easy to define parameters, Shields et al[9],[15] identified 5 predictive clinical features of small CM growth: tumor thickness >2 mm, presence of subretinal fluid, clinical symptoms, orange pigment overlying the surface of the tumor, and tumor margins touching or being located within 3 mm of the optic disc. These clinical parameters in combination were allowed to distinguish malignant from clinically as non-malignant diagnosed melanocytic choroidal tumors with high accuracy.
In order to improve the informative value of FAF intensity to successfully differentiate pigmented choroidal lesions, we combined in our study additionally to FAF intensity those criteria established by Shields et al[9],[15], which can be obtained from Optomap wide-field images depicting those lesions (evaluation of location related to optic nerve, subretinal fluid and maximal horizontal and vertical diameter) and included green laser separation appearance of those lesions as an additional evaluated parameter. The results show that image information from wide-field FAF combined with those criteria revealed a respectable sensitivity (68.8%) and high specificity (88.2%) to successfully differentiate CN from CM.
Even if the results of this combined approach regarding sensitivity and specificity for differentiation CM from CN are slightly lower in this larger patient group, the presented results are in agreement with the results of a previously published work on a small case series[23] that has shown the diagnostic value of non-mydriatic wide-field SLO imaging of choroidal lesions with two laser wavelengths (Optomap) incorporating the above mentioned criteria established by Shields et al[9],[15].
To our current knowledge, a comparable validity of a screening method for differentiation of pigmented fundus lesions might be exceeded only by ultrasound specialists with a long experience in standardized echography. However, since less experience in ultrasound examination results in significantly lower accuracy and a standardized US examination is not universally available, wide-field FAF together with SLO imaging may be a suitable screening tool to successfully differentiate benign CN from malignant CM independent of an US experienced specialist. Wide-field FAF and SLO imaging is non-invasive, easy to perform and significantly less dependent on the operatoŕs experience than US imaging. This is of immense advantage, especially in ophthalmic centers without access to adequate US examination.
Wide-field FAF using a green laser (532 nm) as exciter may have a certain specificity to lipofuscin deposits in the RPE layer compared to FAF systems using a blue laser as exciter for FAF as suggested by previously published works[31],[32]. However, whether this provides particular advantages in the context of differentiation of CM from CN needs to be clarified. In general, further studies are needed to evaluate potential differences between various FAF excitation wavelengths in patients with choroidal lesions.
Limitations of the study are that the number of untreated CN in the presented series is relatively low. However, in our previous work we were able to show that the differences between CN and CM detected by wide-field imaging criteria were even more pronounced in untreated CM, compared to CM having had radiation therapy in advance[23]. Limitations of wide-field SLO imaging compared to ultrasound examination are the inability to appropriately image patients with media opacities or cases with vitreous hemorrhage, the lack of a precise thickness measurement or evaluation of potential vascularisation of the examined tumor. In addition, the US A-scan provides important additive structural tissue criteria allowing an accurate assessment of malignancy or progression of the lesion. This is of high importance, especially for deciding for the best treatment option in cases where the lesion is found to be adjacent to sensitive structures such as the optic disc or in close proximity of the fovea.
In summary, given the results of this semi-quantitative analysis of our study including 139 patients with pigmented choroidal lesions, we do think that wide-field FAF and SLO imaging may be a valuable non-mydriatic diagnostic screening tool with a reasonable high accuracy to differentiate benign from malign pigmented choroidal lesions in centers without access to adequate ultrasound diagnostics.
Acknowledgments
Conflicts of interest: Reznicek L, None; Stumpf C, None; Seidensticker F, None; Kampik A, None; Neubauer AS, None; Kernt M, None.
REFERENCES
- 1.Bergman L, Seregard S, Nilsson B, Ringborg U, Lundell G, Ragnarsson-Olding B. Incidence of uveal melanoma in Sweden from 1960 to 1998. Invest Ophthalmol Vis Sci. 2002;43(8):2579–2583. [PubMed] [Google Scholar]
- 2.Wilkes S, Kurland L, Campbell RJ, Robertson DM. Incidence of uveal malignant melanoma. Am J Ophthalmol. 1979;88(3 Pt 2):629–630. [PubMed] [Google Scholar]
- 3.Bell DJ, Wilson MW. Choroidal melanoma: natural history and management options. Cancer Control. 2004;11(5):296–303. doi: 10.1177/107327480401100503. [DOI] [PubMed] [Google Scholar]
- 4.Lorigan JG, Wallace S, Mavligit GM. The prevalence and location of metastases from ocular melanoma: imaging study in 110 patients. AJR Am J Roentgenol. 1991;157(6):1279–1281. doi: 10.2214/ajr.157.6.1950883. [DOI] [PubMed] [Google Scholar]
- 5.Shammas HF, Blodi FC. Peripapillary choroidal melanomas. Extension along the optic nerve and its sheaths. Arch Ophthalmol. 1978;96(3):440–445. doi: 10.1001/archopht.1978.03910050216004. [DOI] [PubMed] [Google Scholar]
- 6.Albert DM, Robinson NL, Fulton AB, Zakov ZN, Dryja TP, Puliafito CA, Smith AB, Egan EA. Epidemikological investigation of increased incidence of choroidal melanoma in a single population of chemical workers. Int Ophthalmol Clin. 1980;20(2):71–92. [PubMed] [Google Scholar]
- 7.Ganley JP, Comstock GW. Benign nevi and malignant melanomas of the choroid. Am J Ophthalmol. 1973;76(1):19–25. doi: 10.1016/0002-9394(73)90003-2. [DOI] [PubMed] [Google Scholar]
- 8.Sumich P, Mitchell P, Wang JJ. Choroidal nevi in a white population: the Blue Mountains Eye Study. Arch Ophthalmol. 1998;116(5):645–650. doi: 10.1001/archopht.116.5.645. [DOI] [PubMed] [Google Scholar]
- 9.Shields CL, Shields JA, Kiratli H, De Potter Cater JR. Risk factors for growth and metastasis of small choroidal melanocytic lesions. Ophthalmology. 1995;102(9):1351–1361. [PubMed] [Google Scholar]
- 10.McLean IW, Saraiva VS, Burnier MN., Jr Pathological and prognostic features of uveal melanomas. Can J Ophthalmol. 2004;39(4):343–350. doi: 10.1016/s0008-4182(04)80004-8. [DOI] [PubMed] [Google Scholar]
- 11.Eskelin S, Pyrhonen S, Summanen P, Hahka-Kemppinen M, Kivela T. Tumor doubling times in metastatic malignant melanoma of the uvea: tumor progression before and after treatment. Ophthalmology. 2000;107(8):1443–1449. doi: 10.1016/s0161-6420(00)00182-2. [DOI] [PubMed] [Google Scholar]
- 12.Kujala E, Makitie T, Kivela T. Very long-term prognosis of patients with malignant uveal melanoma. Invest Ophthalmol Vis Sci. 2003;44(11):4651–4659. doi: 10.1167/iovs.03-0538. [DOI] [PubMed] [Google Scholar]
- 13.Diener-West M, Hawkins BS, Markowitz JA, Schachat AP. A review of mortality from choroidal melanoma. II. A meta-analysis of 5-year mortality rates following enucleation, 1966 through 1988. Arch Ophthalmol. 1992;110(2):245–250. doi: 10.1001/archopht.1992.01080140101036. [DOI] [PubMed] [Google Scholar]
- 14.Margo CE. The Collaborative Ocular Melanoma Study: an overview. Cancer Control. 2004;11(5):304–309. doi: 10.1177/107327480401100504. [DOI] [PubMed] [Google Scholar]
- 15.Shields CL, Cater J, Shields JA, Singh AD, Santos MC, Carvalho C. Combination of clinical factors predictive of growth of small choroidal melanocytic tumors. Arch Ophthalmol. 2000;118(3):360–364. doi: 10.1001/archopht.118.3.360. [DOI] [PubMed] [Google Scholar]
- 16.Butler P, Char DH, Zarbin M, Kroll S. Natural history of indeterminate pigmented choroidal tumors. Ophthalmology. 1994;101(4):710–716. doi: 10.1016/s0161-6420(94)31274-7. [DOI] [PubMed] [Google Scholar]
- 17.Gunduz K, Pulido JS, Pulido JE, Link T. Correlation of fundus autofluorescence with fluorescein and indocyanine green angiography in choroidal melanocytic lesions. Retina. 2008;28(9):1257–1264. doi: 10.1097/IAE.0b013e31817d5cdc. [DOI] [PubMed] [Google Scholar]
- 18.Hodes BL, Choromokos E. Standardized a-scan echographic diagnosis of choroidal malignant melanomas. Arch Ophthalmol. 1977;95(4):593–597. doi: 10.1001/archopht.1977.04450040059006. [DOI] [PubMed] [Google Scholar]
- 19.Verbeek AM, Thijssen JM, Cuypers MH, Brink H, Deutman AF. Echographic classification of intraocular tumours. A 15-year retrospective analysis. Acta Ophthalmol. 1994;72(4):416–422. doi: 10.1111/j.1755-3768.1994.tb02788.x. [DOI] [PubMed] [Google Scholar]
- 20.Romani A, Baldeschi L, Genovesi-Ebert F, Gremigni E, Ragone MC, Rizzo S, Nardi M. Sensitivity and specificity of ultrasonography, fluorescein videoangiography, indocyanine green videoangiography, magnetic resonance and radioimmunoscintigraphy in the diagnosis of primary choroidal malignant melanoma. Ophthalmologica. 1998;212(Suppl. 1):44–46. doi: 10.1159/000055423. [DOI] [PubMed] [Google Scholar]
- 21.Ossoinig KC, Bigar F, Kaefring SL. Malignant melanoma of the choroid and ciliary body. A differential diagnosis in clinical echography. Bibl Ophthalmol. 1975;(83):141–154. [PubMed] [Google Scholar]
- 22.Kernt M, Ulbig MW. Images in cardiovascular medicine. Wide-field scanning laser ophthalmoscope imaging and angiography of central retinal vein occlusion. Circulation. 2010;121(12):1459–1460. doi: 10.1161/CIR.0b013e3181d99c22. [DOI] [PubMed] [Google Scholar]
- 23.Kernt M, Schaller UC, Stumpf C, Ulbig MW, Kampik A, Neubauer AS. Choroidal pigmented lesions imaged by ultra-wide-field scanning laser ophthalmoscopy with two laser wavelengths (Optomap) Clin Ophthalmol. 2010;4:829–836. doi: 10.2147/opth.s11864. [DOI] [PMC free article] [PubMed] [Google Scholar]
- 24.Materin MA, Raducu R, Bianciotto C, Shields CL. Fundus autofluorescence and optical coherence tomography findings in choroidal melanocytic lesions. Middle East Afr J Ophthalmol. 2010;17(3):201–206. doi: 10.4103/0974-9233.65489. [DOI] [PMC free article] [PubMed] [Google Scholar]
- 25.Amselem L, Pulido JS, Gunduz K, Bakri SJ, Diaz-Llopis M, Dolan JW, Morgan K, De Souza S, Link T, Rosvold J. Changes in fundus autofluorescence of choroidal melanomas following treatment. Eye (Lond) 2009;23(2):428–434. doi: 10.1038/sj.eye.6703004. [DOI] [PubMed] [Google Scholar]
- 26.Amselem L, Pulido JS, Gunduz K, Garcia-Arumi J, Mones J. Infrared reflectance in choroidal melanomas and its correlation with fundus autofluorescence. Br J Ophthalmol. 2008;92(11):1565–1566. doi: 10.1136/bjo.2008.145938. [DOI] [PubMed] [Google Scholar]
- 27.Gunduz K, Pulido JS, Bakri SJ, Amselem L, Petit-Fond E, Link T. Fundus autofluorescence of choroidal melanocytic lesions and the effect of treatment. Trans Am Ophthalmol Soc. 2007;105:172–178; discussion 178–179. [PMC free article] [PubMed] [Google Scholar]
- 28.Chin K, Finger PT. Autofluorescence characteristics of suspicious choroidal nevi. Optometry. 2009;80(3):126–310. doi: 10.1016/j.optm.2008.07.018. [DOI] [PubMed] [Google Scholar]
- 29.Augsburger JJ, Correa ZM, Trichopoulos N, Shaikh A. Size overlap between benign melanocytic choroidal nevi and choroidal malignant melanomas. Invest Ophthalmol Vis Sci. 2008;49(7):2823–2828. doi: 10.1167/iovs.07-1603. [DOI] [PubMed] [Google Scholar]
- 30.Gass JD. Problems in the differential diagnosis of choroidal nevi and malignant melanomas. The XXXIII Edward Jackson Memorial Lecture. Am J Ophthalmol. 1977;83(3):299–323. doi: 10.1089/ten.2005.11.1254. [DOI] [PubMed] [Google Scholar]
- 31.Hammer M, Konigsdorffer E, Liebermann C, Framme C, Schuch G, Schweitzer D, Strobel J. Ocular fundus auto-fluorescence observations at different wavelengths in patients with age-related macular degeneration and diabetic retinopathy. Graefes Arch Clin Exp Ophthalmol. 2008;246(1):105–114. doi: 10.1007/s00417-007-0639-9. [DOI] [PubMed] [Google Scholar]
- 32.Wolf-Schnurrbusch UE, Wittwer VV, Ghanem R, Niederhaeuser M, Enzmann V, Framme C, Wolf S. Blue-Light versus Green-Light Autofluorescence: Lesion Size of Areas of Geographic Atrophy. Invest Ophthalmol Vis Sci. 2011;52(13):9497–9502. doi: 10.1167/iovs.11-8346. [DOI] [PubMed] [Google Scholar]