

Abstract
The primary objective of this study was to determine whether cardiovascular compensatory response phenotypes exist in the face of a reduced perfusion pressure challenge to exercising muscle oxygen delivery (O2D), and whether these responses might be exercise intensity (EI) dependent. Ten healthy men (19.5 ± 0.4 yr) completed two trials of progressive forearm isometric handgrip exercise to exhaustion (24.5 N increments every 3.5 min) in each of forearm above and below heart level [forearm arterial perfusion pressure (FAPP) difference of 29.5 ± 0.97 mmHg]. At the end of each EI, measurements of forearm blood flow (FBF; ml/min) via brachial artery Doppler and echo ultrasound, mean arterial blood pressure (MAP; mmHg) via finger photoplethysmography, and exercising forearm venous effluent via antecubital vein catheter revealed distinct cardiovascular response groups: n = 6 with compensatory vasodilation vs. n = 4 without compensatory vasodilation. Compensatory vasodilators were able to blunt the perfusion pressure-evoked reduction in submaximal O2D in the arm-above-heart condition, whereas nonvasodilators did not (−22.5 ± 13.6 vs. −65.4 ± 14.1 ml O2/min; P < 0.05), and in combination with being able to increase O2 extraction, nonvasodilators defended submaximal V̇o2 and experienced less of an accumulated submaximal O2D deficit (−80.7 ± 24.7 vs. −219.1 ± 36.0 ml O2/min; P < 0.05). As a result, the compensatory vasodilators experienced less of a compromise to peak EI than nonvasodilators (−24.5 ± 3.5 N vs. −52.1 ± 8.9 N; P < 0.05). In conclusion, in the forearm exercise model studied, vasodilatory response phenotypes exist that determine individual susceptibility to hypoperfusion and the degree to which aerobic metabolism and exercise performance are compromised.
Keywords: oxygen delivery, exercise, perfusion pressure
it is well known that oxygen consumption (V̇o2) and oxygen delivery (O2D) increase in proportion to exercise intensity (37). This proportional increase has been interpreted to mean that oxygen (O2) supply is tightly matched to metabolic demand during exercise (21, 26, 27). O2D-demand matching is critical for maintaining exercise at a given intensity because changes in O2D in exercise affect both metabolic and contractile function (9, 13, 15, 28, 40). This speaks to the importance of understanding how O2D-demand matching is (or is not) achieved in the context of explaining exercise tolerance and intolerance.
One experimental approach to this has been to establish a condition that compromises O2D either before exercise begins or to impose one during exercise to identify compensatory response characteristics and mechanisms. However, contradictions abound when examining the results of such studies. Findings range from complete compensatory vasodilation that maintains O2D without a pressor response (3, 12, 17, 39), to partial correction of compromised O2D via a pressor response without vasodilation (29, 41), and finally no compensatory vasodilation or pressor response to correct the compromise in O2D (38).
Conflicting findings across studies examining a given physiological phenomenon can often be attributed to differences in experimental conditions or experimental protocol. However, an additional consideration remains unexplored; namely, that disparate findings of studies may also be a clue to the existence of distinct cardiovascular exercise response phenotypes. Evidence supporting the need to consider cardiovascular response phenotypes comes from a comparison of the findings of Tschakovsky and Hughson (34), vs. Perrey et al. (24). These studies were performed in the same laboratory and employed the same exercise model. This model was the activation of the calf muscle metaboreflex through ischemic calf exercise and assessment of the subsequent effect on exercising forearm blood flow via a pressor effect. Tschakovsky and Hughson (34) found that all subjects in their study responded with passive pressure-induced increases in exercising forearm blood flow resulting in a relative hyperperfusion with no vasoregulatory compensation, whereas Perrey et al. (24) found that although some subjects had no vasoregulatory compensation, others responded with forearm vasoconstriction, thereby preventing a change in forearm blood flow. With the same experimental protocol and similar subject characteristics, the individual subjects in each study led to two different conclusions. Although the compensation in these studies was vasoconstriction in response to elevated perfusion pressure, the principle is the same as the one we propose here for a compensatory vasodilatory or pressor response to reduced O2D: namely, that distinct response phenotypes might exist.
The current dogma regarding O2D-demand matching does not consider that inherent differences in the effectiveness of this matching might exist between otherwise similar, healthy individuals. The existence of cardiovascular response phenotypes has important implications for understanding factors contributing to inherent individual differences in exercise tolerance and intolerance. Therefore, the objective of this study was to establish whether compensatory response phenotypes exist under conditions of reduced exercising forearm perfusion pressure. We chose this exercise model because previous findings support two different conclusions regarding compensatory responses to reduced perfusion pressure: namely, almost-complete (5) to complete (17) compensatory vasodilation occurs vs. compensatory vasodilation that is absent (38). A secondary objective was to determine whether the absence of a compensatory response, should it be found, was associated with greater impairment to exercise tolerance. We hypothesized that two distinct cardiovascular response phenotypes exist: vasodilatory compensators and noncompensators, and that a pressor response would not be part of compensation in this exercise model. We further hypothesized that individuals who did not compensate for reduced exercising forearm perfusion pressure would demonstrate greater impairment to exercise tolerance.
MATERIALS AND METHODS
General Methods
Subjects.
Ten healthy men (19.5 ± 0.4 yr) with no history of smoking, cardiovascular disease, hypertension, or specific forearm training participated. Eighteen men were screened to ensure valid brachial artery blood flow measurements could be obtained; 8 were excluded from participation because of confounding venous blood velocity signals that could not be eliminated. This study was approved by the Health Sciences Research Ethics Board at Queen's University according to the terms of the Declaration of Helsinki. Procedures were in accordance with institutional guidelines. Each subject provided signed consent after receiving complete verbal and written descriptions of the experimental protocol and potential risks.
Anthropometric measurements and physical activity levels.
Upon arrival in the laboratory, standard anthropometric data was obtained for each subject. Age, height, weight, exercising arm forearm volume, and exercising arm forearm circumference were measured. A 7-day physical activity recall was completed to quantify current exercise habits. It was confirmed that all subjects avoided exercise for 24 h, caffeine for 12 h, and food consumption for 4 h prior to their laboratory visits.
Instrumentation.
FOREARM DEEP VENOUS BLOOD SAMPLING.
A 20-gauge iv catheter was inserted retrograde to venous blood flow into the antecubital vein. Confirmation that the selected vein drained the active forearm muscle was obtained via echo ultrasound imaging prior to catheterization. This location was marked on each subject and the exact same vein and catheter location were used in all trials for a given subject. This provided blood samples of venous effluent from the exercising muscle without contamination from inactive tissues.
FOREARM BLOOD FLOW.
To obtain forearm blood flow, a 4-MHz pulsed flat Doppler probe (Model 500V Transcranial Doppler; Multigon Industries, Mt. Vernon, NY) was attached to the skin over the brachial artery proximal to the antecubital fossa of the exercising arm to measure brachial artery blood velocity after the optimal location for the ultrasound signal was determined. A linear echo ultrasound probe positioned over the brachial artery ∼5 cm proximal to the flat Doppler probe, operating at 13 MHz in two-dimensional mode (Vivid i; GE Medical Systems, London, ON, Canada) was used to image the diameter of the brachial artery of the exercising arm.
CENTRAL HEMODYNAMIC MEASURES.
Three-lead electrocardiography (ECG) with electrodes attached to the skin in standard CM5 placement was used to measure heart rate. A finger photoplethysmograph (Finometer MIDI; Finapress Medical Systems, The Netherlands) was used to measure arterial blood pressure. Briefly, the inflatable cuff was placed on the middle finger of the nonexercising hand. In addition to blood pressure, this device provides estimates of stroke volume (SV) via ModelFlow (Finapres Medical Systems) allowing calculation of cardiac output (CO) and total peripheral resistance (TPR). Finally, a pulse oximeter (Nellcor N-395; Covidien-Nellcor, Boulder, CO) was placed over the index finger of the resting hand and was used to confirm stable arterial oxygen saturation (SaO2) during exercise.
Experimental Design
All subjects participated in two progressive exercise tests to exhaustion for each of forearm-above-heart and forearm-below-heart experimental positions. Tests were performed on days separated by at least 24 h and spread out over a 2-wk period. Data collection for each subject occurred at the same time of day to limit potential effects of natural circadian rhythm fluctuations, although time of day varied between subjects.
Exercise protocol.
Forearm exercise consisted of rhythmic isometric handgrip contraction with a 1-s contraction, 2-s relaxation duty cycle (Fig. 1). The exercise consisted of progressive step increases in contraction force every 3 min and 30 s until subject exhaustion (Fig. 1). The magnitude of increment in handgrip force in Newtons (N) was equal to that required to lift a mass of 2.5 kg (24.5 N using 9.8 N/kg). Exhaustion was identified as the inability to achieve the target handgrip force on three consecutive attempts despite strong encouragement.
Fig. 1.

Experimental protocol. A: experimental manipulation of the arm above and below the heart is shown with an average reduction of 29.5 ± 0.97 mmHg in the arm-above-heart protocol. FAPP, forearm arterial perfusion pressure. B: the same experimental protocol was performed until exhaustion with the exercising arm above and below the heart. Vertical lines represent timing of venous blood samples. C: the same 1-s contraction 2-s relaxation duty cycle was used for the entire protocol in both arm positions.
Experimental conditions.
The subjects lay supine on a bed with their left arm at their side at heart level and their right arm at their side so that the mid-forearm was either above or below heart level, depending on which experimental protocol was being completed. This manipulation resulted in a difference of 29.5 ± 0.97 mmHg in arterial pressure at mid-forearm level between the two conditions (Fig. 1). The experiment was performed in a temperature-controlled room (19–21°C) to minimize and stabilize blood flow to the skin so that changes in brachial artery blood flow to the forearm would reflect changes in exercising forearm muscle blood flow. The handgrip force output was displayed on a monitor to give the subject visual feedback on force production, and a metronome was used to provide both visual and auditory cues to guide subject contraction/relaxation duty cycles. The order of experimental positions (either above or below the heart) was counterbalanced between subjects to control for an order effect. Each possible order of the four trials was equally represented and randomly assigned to a subject using random allotment in Microsoft Excel.
Altering forearm arterial perfusion pressure.
The forearm was positioned either above or below heart level. To adjust the arm position, a similar experimental setup to that described by Walker et al. (38) was used. The exercising arm was supported on a hinged armrest that could be angled up or down from the shoulder. The arm position required to obtain a local forearm arterial perfusion pressure (FAPP) of 15 mmHg greater than or less than the mean arterial blood pressure (MAP) at heart level in the arm-below and arm-above positions was established for each subject. On each subsequent visit the pulley system was positioned so that a subject's mid forearm was at the distance from the sternum that had been established to have the desired effect on FAPP. The difference in mid-FAPP between the arm-above vs. arm-below heart level positions was 29.5 ± 0.97 mmHg.
Data Acquisition
At baseline and during the last 30 s of each completed exercise intensity, data were collected for all blood constituents, forearm hemodynamic, and central hemodynamic variables.
Forearm venous oxygen content.
Forearm blood samples were taken at baseline and during the last 30 s of each exercise intensity to measure venous oxygen content (CvO2). A 2-ml discard was drawn prior to the 3-ml blood sample. A 2-ml saline flush followed each sample to prevent the catheter from clotting.
Forearm blood flow.
Forearm blood flow (FBF) was derived from the combined brachial artery diameter and mean blood velocity (MBV) measurements. The brachial artery images obtained by the echo ultrasound probe were stored in a Digital Imaging and Communications in Medicine (DICOM) format on a separate computer. The corresponding voltage output from the 4-MHz flat Doppler probe was sampled continuously at 200 Hz (Powerlab; ADInstruments, Bella Vista, Australia) and stored (Chart4 for Windows; ADInstruments) on a computer for analysis. The same experimenter operated both probes at every data collection session in sequence. Briefly, at baseline and each exercise intensity before the third minute of exercise was completed, brachial artery image recording took place for 30 s. This was followed by 30 s of MBV measurement. The stable clear images during relaxation were used to measure artery diameter (i.e., 10 images in total).
The linear echo ultrasound probe was used to obtain an image of the brachial artery in the same location and orientation as the Doppler ultrasound after each trial. This image provided the angle of the brachial artery in relation to the skin surface, and therefore in relation to the Doppler ultrasound probe. As described in detail previously (35), this allowed the use of a correction factor to ensure accounting for potential differences in insonation angle between subjects due to the angle of the artery relative to the skin surface.
Central hemodynamics.
All central hemodynamic measurements derived from ECG, finger photoplethysmography, and pulse oximetry were obtained during the last 30 s of baseline and the last 30 s of each completed exercise intensity.
Data Analysis
Each subject performed two trials for each arm position. The reason for this was twofold. First, by averaging the two responses for each condition, a better representation of the subject's true response could be obtained. Second, consistency in the nature of the response between trials within arm position would allow for confidence in the identification and categorization of different response phenotypes.
Venous blood sample constituents.
A blood gas analyzer (StatProfile M Blood Gas Analyzer; Nova Biomedical, Mississauga, ON, Canada) was used to analyze the 3-ml blood samples for hemoglobin (Hb) concentration (g/dl) and forearm venous oxygen saturation (SvO2; %).
Forearm blood flow.
Brachial artery diameter was analyzed using automated edge-detection software as previously described (3). Diameter measurements during relaxation between contractions when the vessel image was stable were used. Thirty seconds worth of measurements were obtained (10 values) at each exercise intensity. These values were then averaged to provide one diameter measurement for that exercise intensity, and FBF could then be calculated from the diameter and MBV values. Average brachial artery MBV during exercise was obtained as the average of the 30-s collection period for each exercise intensity after the angle of insonation correction factor was applied. Additionally, MBV for a cardiac cycle during the relaxation phase of the duty cycle was also obtained, and these were averaged over the 10 duty cycles that occurred during the last 30 s of each exercise intensity. Relaxation FBF could then be obtained using the brachial artery diameter and average relaxation MBV.
Handgrip force area under the curve (impulse).
We quantified the exercise intensity performed by the subjects as the average contraction impulse (N·s). These individual impulses were then averaged over the 3.5-min duration of a given target exercise intensity.
Calculated variables.
FBF was calculated as [MBV·π (brachial artery diameter/2)2]·60. Virtual forearm vascular conductance (FVCVirtual) (30) was calculated as FBF/FAPP·100 mmHg, whereas FVCRelax was calculated as FBFRelax/FAPP·100 mmHg. FVCVirtual was measured across contraction/relaxation cycles and represents the combined effect of muscle contraction-induced mechanical impedance and enhancement of blood flow and vascular conductance. To quantify the true vasodilatory response, FVCRelax (which is calculated from the FBF and arterial pressure during the relaxation phase between contractions) is used because it is not impacted by the mechanical effects of skeletal muscle contraction (36). Arterial oxygen concentration (CaO2) was calculated from (SaO2·[Hb]·1.36) + 0.003·PaO2, where SaO2 is arterial hemoglobin saturation (fraction), [Hb] is hemoglobin concentration (g/ml) in the blood, 1.36 is the mean volume of O2 (ml) that can be bound to 1 g of normal Hb when fully saturated, 0.003 is the solubility of O2 in human plasma, and PaO2 is the partial pressure of O2 in the arterial blood. PaO2 was assumed to be 100 mmHg. The values obtained from the venous blood sample allowed the calculation of CvO2. V̇o2 was calculated using the Fick equation as FBF·(CaO2 − CvO2). O2D was calculated as FBF·CaO2.
Post hoc identification of different cardiovascular response phenotypes.
For each subject, each combination of the two above vs. two below trials was plotted for ΔFVCRelax and ΔMAP (e.g., above 1 vs. below 1, above 1 vs. below 2, above 2 vs. below 1, above 2 vs. below 2). The line of identity (LOI) identifies an identical response between arm positions. If these data distribute along the LOI (below trials on the x-axis, above trials on the y-axis) it would indicate that FVCRelax and MAP were the same in both arm positions (i.e., no compensatory vasodilation or pressor response) for that subject. In contrast, if the data were distributed above the LOI, it would indicate that there was increased FVC or MAP, or both in the above condition, indicating a compensatory response.
Statistical Analysis
Due to attrition at the higher exercise intensities, only subjects who completed a given exercise intensity in both arm positions were averaged into that exercise intensity's response data. This approach was used because if a subject did not attain the same exercise intensity in both arm positions, we did not have the basis for a valid comparison between arm positions because the same subject would be represented only in one arm position and not the other.
Furthermore, the data from subject B below day 1 were not used in analysis. During this day the subject complained that the catheter was painful when blood samples were being drawn. His peak exercise intensity achieved was substantially lower than that below day 2 (245 N vs. 318.5 N). Analysis of his O2D/N showed a similar slope between the days (8.81 vs. 8.86 ml O2/N). Furthermore, his performance in the arm-above test was consistent (269.5 N vs. 294 N). These observations point to the catheter pain as confounding the response, and therefore these data were not included.
Due to technical issues with catheter patency, there were three instances in which only one of two trials in a given arm position yielded blood samples. In these cases, the blood constituent measurements from the successful trial in the same arm position were used for this trial. In three subjects, neither of the two trials in a given arm position yielded blood samples. Therefore, statistical analysis of variables that were blood derived was performed on data from seven subjects.
Student's paired t-test.
A Student's paired t-test was used to test whether the exercise end points (peak exercise intensity, peak O2D, and peak V̇o2) were consistent between trials within each arm position and to identify differences between arm positions. A paired t-test was used for comparisons between arm positions within compensatory vasodilator and nonvasodilator responder groups.
Student's t-test.
A Student's t-test was used to compare exercise end points between the compensatory vasodilators and nonvasodilators, and to compare regression slopes of the arm-below vs. arm-above response to the LOI for each individual to identify response phenotype.
Intraclass correlation coefficient, coefficients of variation, and typical error.
An intraclass correlation coefficient (ICC) was calculated for the previously described exercise end points within each arm position as (between-subject MS - error MS)/between-subject MS, where MS is mean square. Coefficients of variation (CV) for each subject for each exercise end point were calculated by dividing the standard deviation of the two trials by the mean of the two trials and then multiplying by 100. Typical error (TE) was calculated as the standard deviation of the trial difference scores divided by the square root of 2 (16).
Two-way repeated measure ANOVA.
A two-way repeated measures ANOVA was used to test for main effects of arm position and exercise intensity as well as an interaction effect for all blood constituents, forearm hemodynamic, and central hemodynamic variables. Within this approach, every subject up to the 196 N exercise intensity was used in analysis. Due to attrition after this exercise intensity, a subsequent two-way repeated measures ANOVA was performed with all subjects who completed up to the 220.5 N exercise intensity but only the result from the new 220.5 N exercise intensity was interpreted. This process was repeated at each subsequent exercise intensity, obtaining new analysis results one exercise intensity at a time, until the ANOVA was no longer applicable. This approach took advantage of and maximized the statistical power of the repeated measures ANOVA design. If all exercise intensities were compared at once, then only subjects who completed the highest exercise intensity could have been used for all previous exercise intensities, substantially reducing the statistical power.
Bootstrapping statistics.
To gain additional confidence in the statistical outcomes observed with the application of parametric statistical analyses, a resampling approach named bootstrapping was completed for t-statistics. This approach is not bound by the foundational population distribution assumptions of traditional parametric tests. Rather, through a process of sampling with replacement, new samples of the same size are drawn from the original sample, a statistic of interest is computed (in this case, t-statistics), and this process is completed 1,000 times. The end result is a population distribution of t-statistics with its own unique characteristics upon which the subsequent statistical analyses are then based. As a result, no underlying population assumptions are predetermined because a population is created through this resampling approach. With our small sample size, bootstrapping overcomes any potential distribution issues, as indicated by the central limit theorem with a sample less than 30. The application of this approach will reinforce any statistical observations formulated through traditional parametric analysis and provide confidence in the statistical observations despite a smaller sample size.
The level of significance was set at P < 0.05, and significant differences for ANOVA were further assessed using Tukey's post hoc tests. All statistics were calculated using SigmaPlot 12.0 (Systat Software). All bootstrapped statistics were completed using SPSS (version 20; IBM, Surrey, UK). All data are presented as means ± SE.
RESULTS
Subject Characteristics
Subject characteristics are presented in Table 1.
Table 1.
Subject characteristics
| Characteristic | |
|---|---|
| Age, yr | 19.5 ± 0.4 |
| Height, cm | 182.2 ± 2.4 |
| Weight, kg | 77.8 ± 2.6 |
| BMI, kg/m2 | 23.3 ± 0.3 |
| Forearm volume, ml | 1131.2 ± 57.8 |
| Forearm circumference, cm | 11.1 ± 0.2 |
| Energy expenditure, kcal·kg−1·wk−1 | 263.3 ± 10.4 |
Values are means ± SE; n = 10.
Were Baseline Values the Same Between Arm Positions?
The group mean baseline values for all measured variables in both the arm-above and arm-below-heart conditions are presented in Table 2. Only FAPP (by design) and CvO2 were significantly different between arm positions at baseline (P < 0.001 and P = 0.01 respectively).
Table 2.
Baseline values for measured variables in both arm positions and the number of subjects represented by each mean
| Variable | Above | Below | n |
|---|---|---|---|
| FAPP, mmHg | 73.1 ± 3.9 | 102.9 ± 1.6* | 10 |
| O2 delivery, mlO2/min | 8.22 ± 0.53 | 9.36 ± 0.78 | 10 |
| FBF, ml/min | 42.25 ± 3.21 | 46.21 ± 4.01 | 10 |
| CaO2, mlO2/100 ml | 19 ± 0.5 | 20 ± 0.3 | 10 |
| FVC, ml·min−1·100mmHg−1 | 58.60 ± 4.25 | 44.85 ± 3.66 | 10 |
| MAP, mmHg | 87.95 ± 3.94 | 88.19 ± 1.65 | 10 |
| TPR, ml·min−1·mmHg−1 | 16.92 ± 1.89 | 16.58 ± 1.53 | 10 |
| CO, liters/min | 5.70 ± 0.48 | 5.89 ± 0.54 | 10 |
| HR, bpm | 59.01 ± 2.07 | 60.02 ± 2.75 | 10 |
| SV, ml | 96.27 ± 6.24 | 96.92 ± 6.13 | 10 |
| V̇O2, ml/min | 4.52 ± 0.26 | 4.46 ± 0.46 | 7 |
| a-vO2, mlO2/100 ml | 10.1 ± 0.6 | 9.4 ± 1.1 | 7 |
| CvO2, mlO2/100 ml | 9 ± 0.7 | 11 ± 1* | 7 |
FAPP, forearm arterial perfusion pressure; FBF, forearm blood flow; CaO2, arterial oxygen content; FVC, forearm vascular conductance; MAP, mean arterial pressure; TPR, total peripheral resistance; CO, cardiac output; HR, heart rate; bpm, beats per minute; SV, stroke volume; a-vO2, arterio-venous oxygen difference; CvO2, forearm venous oxygen consumption. Values are means ± SE.
Significant difference between arm positions (P < 0.05).
Was the Exercise Intensity Performed Consistent Between Arm Positions?
The actual exercise intensity at each target exercise intensity was compared between the two perfusion pressure arm positions. There were no differences (P > 0.2) between the two positions at any of the exercise intensities (data not shown).
Hemodynamic and Metabolic Analysis at the Group Level
Consistent with the traditional approach of whole-group responses being representative of the underlying physiology, data were first analyzed as a whole with all subjects.
Was O2 delivery protected when FAPP was reduced?
There was an effect of exercise intensity as changes in O2D from baseline increased incrementally during the ramp protocol until exhaustion in both arm positions (P < 0.001). At baseline (P = 1) and exercise intensities 24.5 N (P = 0.4), 49.0 N (P = 0.3), 73.5 N (P = 0.07), 122.5 N (P = 0.06), and 220.5 N (P = 0.1) O2D was not different between positions; however, at exercise intensities 98, 147–196, and 245–294 N, O2D was significantly lower when the arm was in the above-heart position compared with the below-heart position (P < 0.05; data not shown).
Similar to O2D, an effect of exercise intensity was present as FBF changes increased incrementally during the protocol until exhaustion in each of the arm positions (P < 0.001). At baseline (P = 1) and exercise intensities 24.5 N (P = 0.4) and 49.0 N (P = 0.1) there was no difference in FBF between the conditions; however, starting at exercise intensity 73.5 N and continuing until subject exhaustion, FBF was significantly lower in the arm-above-the-heart compared with arm-below-the-heart position (P < 0.02, data not shown). CaO2 did not change throughout the exercise protocol (P > 0.4; no main effect of exercise intensity, data not shown) nor was there any difference between arm positions (P > 0.5; no main effect of arm position, data not shown).
Were there compensatory vasodilatory and/or pressor responses?
Changes from baseline for FVCVirtual, MAP, and FVCRelax increased incrementally over the duration of the exercise protocol in both arm positions (P < 0.001). There was, however, no difference between the two perfusion pressure positions in any of these variables (P > 0.2, P > 0.6, and P > 0.2, respectively; data not shown).
How were MAP increases achieved?
Increases in MAP achieved over the duration of the protocol were due to increases in CO over the course of the progressive exercise to exhaustion (P < 0.001). TPR remained constant and did not change as the exercise progressed (P > 0.9). However, at the highest exercise intensities, specifically greater than 318.5 N, there was an increase in TPR in the arm-above position contributing to an increase in MAP. The increases in CO experienced were due to increases in heart rate over the course of exercise (P < 0.001) because stroke volume was not different over time (P > 0.9).
Trial-to-trial reproducibility of peak responses.
Table 3 summarizes the peak O2D, peak exercise intensity, and peak V̇o2 obtained for each subject in each of the two above-heart and two below-heart arm positions, respectively. These data show that peak O2D was not different between trials within the arm-above (110.5 ± 9.8 vs. 119.5 ± 11.8 ml O2/min, P = 0.3; trial-to-trial CV 11.4 ± 4.9%, ICC 0.77) and arm-below (155.6 ± 16.8 vs. 152.0 ± 13.4 ml O2/min, P = 0.3; trial-to-trial CV 8.8 ± 2.7%, ICC 0.96) positions. Similarly, the peak exercise intensity attained each day within the above-heart (245.2 ± 11.6 vs. 255.0 ± 13.8 N, P = 0.3; trial-to-trial CV 5.3 ± 1.7%, ICC 0.88) and below-heart (280.6 ± 16.4 vs. 286.8 ± 14.6 N, P = 0.6; trial-to-trial CV 2.3 ± 1.1%, ICC 0.98) positions were not different. Finally, the peak V̇o2 was different between above-heart trials (66.5 ± 5.0 vs. 85.3 ± 6.6 ml/min, P < 0.03; trial-to-trial CV 14.6 ± 13.1%, ICC 0.75) but was not different between below-heart trials (108.4 ± 8.1 vs. 102.9 ± 8.3 ml/min, P = 0.16; trial-to-trial CV 4.0 ± 3.7%, ICC 0.98).
Table 3.
Individual peak O2 delivery, peak exercise intensity, and peak V̇O2 achieved during each of the two above-heart and below-heart arm position trials
| Peak O2 Delivery, mlO2/min | ||||||||
|---|---|---|---|---|---|---|---|---|
| Subject | Above 1 | Above 2 | Mean | CV | Below 1 | Below 2 | Mean | CV |
| A | 137.3 | 133.1 | 135.2 | 2.2 | 206.6 | 211.15 | 208.9 | 1.5 |
| B | 119.3 | 126.3 | 122.8 | 4.0 | 172.9 | 172.9 | ||
| C | 82.0 | 78.9 | 80.5 | 2.8 | 111.0 | 112.1 | 11.6 | 0.7 |
| D | 114.5 | 104.2 | 109.3 | 6.6 | 151.2 | 140.6 | 145.9 | 5.1 |
| E | 116.1 | 109.1 | 112.6 | 4.4 | 139.5 | 144.9 | 142.2 | 2.7 |
| F | 158.1 | 191.7 | 174.9 | 13.6 | 246.4 | 218.3 | 232.3 | 8.5 |
| G | 109.5 | 122.8 | 116.1 | 8.1 | 140.6 | 123.8 | 132.2 | 9.0 |
| H | 137.5 | 125.7 | 131.6 | 6.3 | 144.7 | 115.8 | 130.3 | 15.6 |
| I | 66.0 | 148.6 | 107.3 | 54.4 | 192.9 | 182.7 | 187.8 | 3.8 |
| J | 64.5 | 54.4 | 59.5 | 12.1 | 67.1 | 98.0 | 82.6 | 26.5 |
| Mean | 110.5 ± 9.8 | 119.5 ± 11.8 | 115.0 ± 9.8† | 11.4 ± 4.9 | 155.6 ± 16.8 | 152.0 ± 13.4 | 153.8 ± 14.4† | 8.8 ± 2.7 |
| Peak Exercise Intensity (N·s) | ||||||||
| Subject | Above 1 | Above 2 | Mean | CV | Below 1 | Below 2 | Mean | CV |
| A | 269.5 | 269.5 | 269.5 | 0 | 318.5 | 318.5 | 318.5 | 0 |
| B | 269.5 | 294 | 281.8 | 6.1 | 318.5 | 318.5 | ||
| C | 220.5 | 220.5 | 220.5 | 0 | 245.5 | 245 | 245 | 0 |
| D | 245 | 220.5 | 232.8 | 7.4 | 269.5 | 245 | 257.3 | 6.7 |
| E | 220.5 | 220.5 | 220.5 | 0 | 245 | 245 | 245 | 0 |
| F | 294 | 343 | 318.5 | 10.9 | 367.5 | 367.5 | 367.5 | 0 |
| G | 245 | 269.5 | 257.3 | 6.7 | 294 | 294 | 294 | 0 |
| H | 294 | 269.5 | 281.8 | 6.1 | 294 | 318.5 | 306.3 | 5.7 |
| I | 196 | 245 | 220.5 | 15.7 | 294 | 294 | 294 | 0 |
| J | 196 | 196 | 196 | 0 | 196 | 220.5 | 208.3 | 8.3 |
| Mean | 245 ± 12.2 | 254.8 ± 13.4 | 250.0 ± 12.7† | 5.3 ± 1.7 | 280.4 ± 16.4 | 286.6 ± 15.4 | 285.4 ± 15.5† | 2.3 ± 1.1 |
| Peak V̇O2 (ml/min) | ||||||||
| Subject | Above 1 | Above 2 | Mean | CV | Below 1 | Below 2 | Mean | CV |
| A | 62.1 | 63.1 | 62.6 | 1.1 | 130.7 | 130.6 | 130.6 | 0.1 |
| B | 63.8 | 79.1 | 71.5 | 15.2 | 73.1 | 73.1 | ||
| C | 53.6 | 61.4 | 57.5 | 9.7 | ||||
| D | 75.4 | 72.4 | 73.9 | 2.8 | ||||
| E | 75.0 | 78.1 | 76.5 | 2.8 | ||||
| F | 88.5 | 119.7 | 104.1 | 21.1 | 128.0 | 121.3 | 124.6 | 3.8 |
| G | 68.8 | 84.2 | 76.5 | 14.2 | 88.1 | 78.3 | 83.2 | 8.4 |
| H | 70.7 | 81.5 | 76.1 | 10.0 | 91.7 | 92.5 | 92.1 | 0.6 |
| I | 45.1 | 84.3 | 64.7 | 42.8 | 103.6 | 91.8 | 97.74 | 8.5 |
| J | ||||||||
| Mean | 66.5 ± 5.0 | 85.3 ± 6.6* | 75.9 ± 5.3† | 14.6 ± 13.1 | 108.4 ± 8.1 | 102.9 ± 8.3 | 100.2 ± 8.6† | 4.0 ± 3.7 |
The coefficient of variation for each subject at each variable is presented. The last row include mean values for each day and overall mean values for the condition ± SE.
Significant difference between days (P < 0.05).
Significant difference between arm positions (P < 0.05). Subject B was not included in any within-day arm-below analysis but was included in between-position analyses. Subjects C, D, E, and J were not included in mean values or analysis for peak V̇O2.
Were O2 delivery, exercise performance, and muscle metabolism affected by a reduction in FAPP?
There was an effect of arm position as the peak O2D, peak exercise intensity, and peak V̇o2 attained were significantly different between the two arm positions with the arm-above-heart position having a lower peak O2D (115.0 ± 9.8 vs. 153.8 ± 14.4 ml O2/min, P < 0.001), lower peak exercise intensity (250.1 ± 12.0 vs. 283.9 ± 14.7 N, P < 0.001), and lower peak V̇o2 (75.9 ± 5.3 vs. 100.2 ± 8.6 ml/min, P < 0.05).
V̇o2 increased incrementally during the protocol as exercise intensity increased until exhaustion in both of the arm positions (P < 0.001). V̇o2 changes from baseline were lower in the arm-above condition compared with the arm-below position at every exercise intensity after 24.5 N except for 73.5 N (P = 0.2), 122.5 N (P = 0.4), 220.5 N (P = 0.3), and 245 N (P = 0.4, data not shown). Arteriovenous oxygen difference (a-vO2) was not different between the two positions (P = 0.7; data not shown).
Identification of Cardiovascular Response Phenotypes
The following describes the analysis approach and findings regarding identification of potential cardiovascular response phenotypes.
Were different cardiovascular response phenotypes present?
For ΔFVCRelax and ΔMAP, each combination of the two above-heart vs. two below-heart position responses at each exercise intensity were plotted against each other. The resulting scatterplot relative to the LOI revealed that the pressor response to exercise did not differ for any subject between arm-above and arm-below (no slope difference between LOI and data plot; data not shown). However, two distinct vasodilator response phenotypes as evidenced in the ΔFVCRelax response were identified (Figs. 2, 3, and 4). We have labeled them as vasodilatory compensators and noncompensators. Compensators (n = 6; subjects C, D, E, G, H, and J) were characterized by data that at baseline were on the LOI, but with increasing exercise intensity distributed above the LOI (Fig. 2). In contrast, data for noncompensators (n = 4; subjects A, B, F, and I) were not distributed above the LOI (Fig. 3). Statistical analysis of the slope of the line of best fit to the data vs. the slope of the LOI confirmed that for each of the compensators the slope of the ΔFVCRelax arm-above vs. arm-below response was significantly greater than the slope of the LOI (P < 0.001 to P = 0.042), whereas for each of the noncompensators the ΔFVCRelax arm-above vs. arm-below response slope was not greater than the slope of the LOI. Figure 4 provides an example of the continuous FVCRelax for a representative vasodilatory compensator and noncompensator.
Fig. 2.

Identification of cardiovascular response phenotypes. Individual vasodilator phenotype responses are depicted. *Regression line is significantly greater than the line of identify (LOI) (P < 0.05). FVC, forearm vascular conductance.
Fig. 3.

Identification of cardiovascular response phenotypes. Individual nonvasodilator phenotype responses are depicted. Open circles indicate LOI; closed circles indicate actual phenotypic response; dashed line indicates LOI; solid line indicates regression line of response. *Regression line is significantly greater than the LOI (P < 0.05).
Fig. 4.

Instantaneous forearm vascular conductance tracing during relaxation phase (FVCRelax) between contractions at 245 N from a representative vasodilatory compensator (A) and a noncompensator (B). Data are presented for the arm-below-heart position (dashed trace) vs. arm-above-heart position (solid trace) from left to right in each panel. Solid horizontal lines represent the average FVCRelax and illustrate the increased dilation in response to the reduced perfusion pressure challenge in a vasodilatory compensator that is completely absent in a noncompensator.
Did cardiovascular response phenotypes impact O2 delivery, V̇o2, or exercise performance?
Figure 5 presents the O2D, vasodilatory, and pressor responses with increasing exercise intensity analyzed within phenotype. Comparison of arm position within the noncompensator group identified that when perfusion pressure was reduced, O2D was significantly compromised at least from the 147 N exercise intensity onward (P < 0.05). With only four subjects, a lack of statistical power may have prevented detection of compromise at lower exercise intensities. The compensator group also had significantly compromised O2D starting at the 73.5 N exercise intensity until the 220.5 N exercise intensity (P < 0.05). To compare the magnitude of O2D compromise between phenotypes, we calculated the total deficit in O2D as the sum of the difference between arm positions at each completed exercise intensity. This analysis revealed that the magnitude of compromise was considerably blunted (total accumulated O2D deficit with reduced perfusion pressure, compensators vs. noncompensators −80.7 ± 24.7 vs. −219.1 ± 36.0 ml O2/min, P < 0.01, bootstrap P < 0.001; Fig. 7).
Fig. 5.

Effect of cardiovascular response phenotype on O2 delivery and compensatory mechanisms. A: nonvasodilators, change in O2 delivery during exercise. B: change in FVCRelax during exercise. C: change in mean arterial pressure (MAP) during exercise. D: vasodilators, change in O2 delivery during exercise. E: change in FVCRelax during exercise. F: change in MAP during exercise. Open circles indicate arm-above; closed circles indicate arm-below. *Significant difference between arm-above and arm-below (P < 0.05). The number of subjects represented at each exercise intensity is numerically indicated on each graph.
Fig. 7.
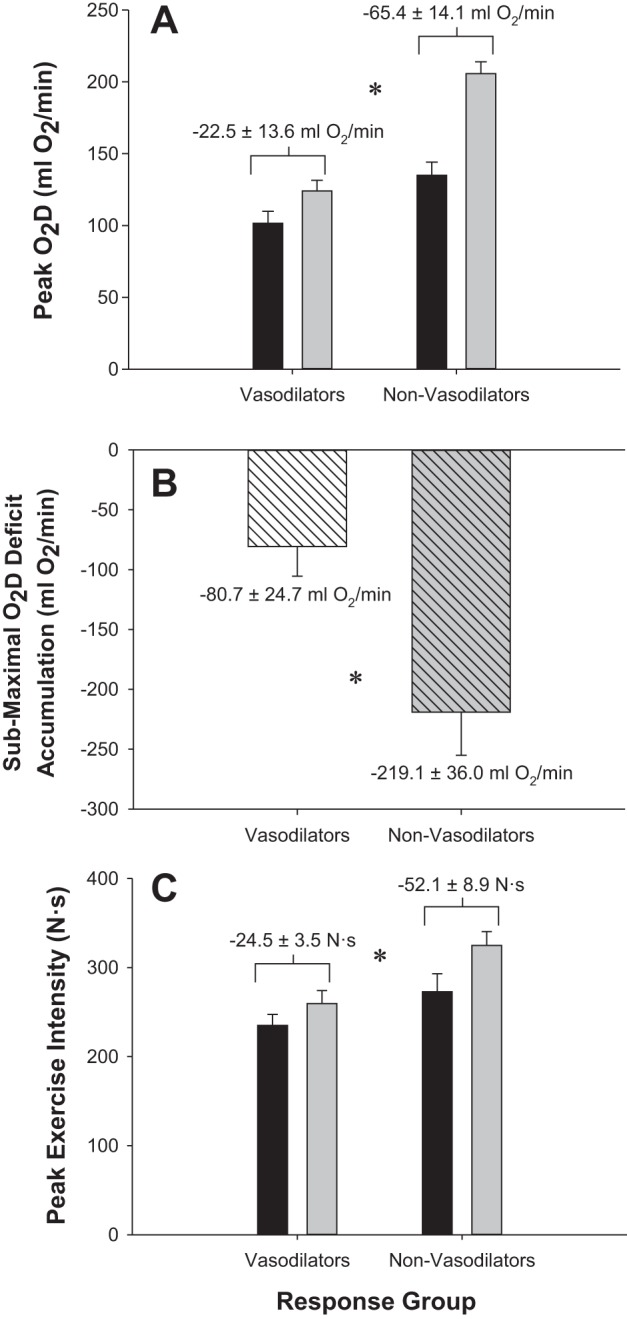
Impact of cardiovascular response phenotypes on O2 delivery and exercise tolerance. A: impact of response phenotype on peak O2 delivery. B: impact of response phenotype on submaximal O2D deficit accumulation. C: impact of response phenotype on peak exercise intensity. Black bars indicate arm-above-heart position; gray bars indicate arm-below-heart position. White hashed bar indicates vasodilators; gray dashed bar indicates nonvasodilators. *Significant difference between response phenotype (P < 0.05).
The reason for the differences in O2D compromise stemmed from the compensatory vasodilators having significantly higher FVCRelax in above-arm vs. below-arm at every exercise intensity after 24.5 N except for 73.5 N (P = 0.1) and 122.5 N (P = 0.08), whereas the nonvasodilators did not have an increase in FVCRelax when perfusion pressure was reduced (P = 0.2 for main effect of arm position; Figs. 4 and 5). In contrast, MAP was not different between arm positions in either group (P = 0.5 noncompensators, P = 0.9 compensators).
Analysis of the V̇o2 responses revealed that V̇o2 increased in an incremental fashion with exercise intensity in both groups (P < 0.001). However, when the arm was positioned above the heart and perfusion pressure was less, the noncompensator group had a significantly lower V̇o2 (comparison made up to the 245 N so that all subjects could be included in the analysis, P = 0.04). In contrast, the compensatory vasodilators did not have a difference in V̇o2 between arm positions (P = 0.8; Fig. 6). Consistent with the greater compromise to submaximal O2D and V̇o2 in the noncompensators was the observation of a greater compromise to peak exercise intensity in the arm-above position (−52.1 ± 8.9 N vs. −24.5 ± 3.5 N, P < 0.03, bootstrap P = 0.03; Fig. 7).
Fig. 6.
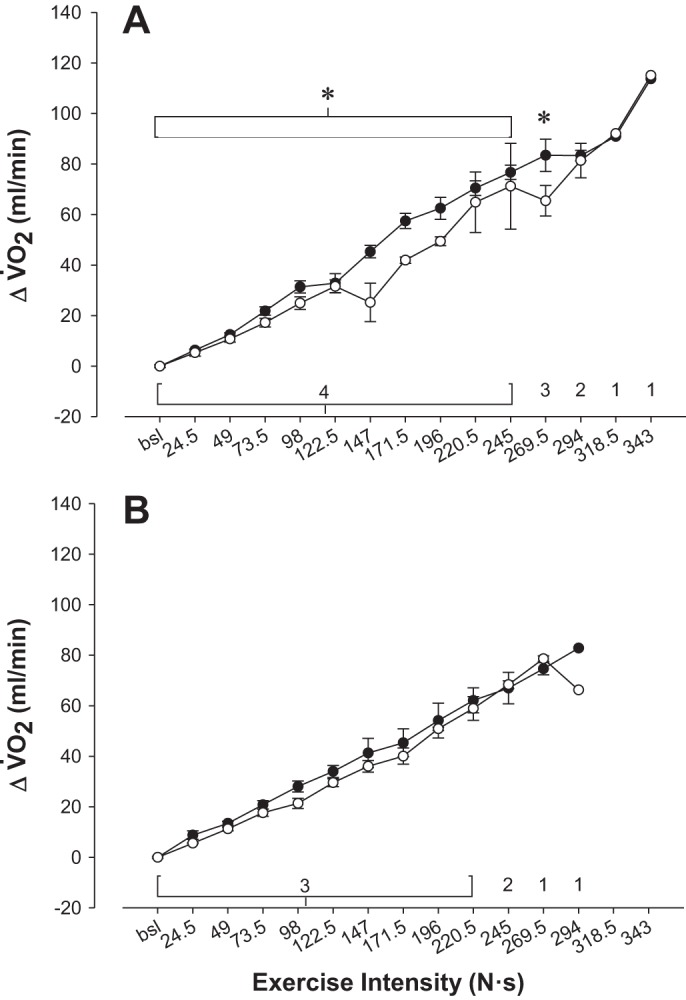
V̇o2 responses during exercise for each cardiovascular response phenotype. A: change in V̇o2 during exercise for nonvasodilators. B: change in V̇o2 during exercise for vasodilators. Open circles indicate arm-above; closed circles indicate arm-below. *Significant difference between arm above and below heart (P < 0.05). The number of subjects represented at exercise intensity is numerically indicated on each graph.
Did cardiovascular response phenotypes differ in Hb desaturation?
For the noncompensators, there was no difference in SvO2 at baseline between arm positions (arm-above 47.2 ± 3.5% vs. arm-below 51.5 ± 7.7%; P = 0.64). In contrast, the compensators had reduced SvO2 at baseline between arm positions (arm-above 45.4 ± 5.6% vs. arm-below 55 ± 8.4%; P = 0.005). However, it is the SvO2 during exercise that is relevant for issues of O2 extraction in exercise. To assess this, we averaged the SvO2 across exercise intensities beyond where the vasodilatory compensation in the compensators became evident (98 N onward). There was no difference between arm-above vs. arm-below positions for the noncompensators (42.5% vs. 34.8%, 31.6% vs. 31.8%, 40.2% vs. 43.0%, 33.8% vs. 36.3%; average 38.1 ± 2.6% vs. 36.6 ± 2.4%; P = 0.18). In contrast, all three of the compensator subjects for whom we were able to obtain blood constituent data in both arm positions demonstrated reduced SvO2 in arm-above vs. arm-below (27.4% vs. 34.5%, 28.6% vs. 35.3%, 35.5% vs. 37.5%; average 30.5 ± 2.5% vs. 35.2 ± 0.9%; P = 0.003).
DISCUSSION
The primary objective of this study was to identify whether distinct cardiovascular response phenotypes exist with respect to compensatory vasodilatory or pressor responses, or both, in the face of a reduced exercising muscle perfusion pressure challenge to O2D-demand matching. A secondary objective was to determine the extent to which aerobic metabolism and exercise performance may be compromised or protected depending on compensatory response phenotype. A range of exercise intensities from rest to peak were investigated to determine whether compensatory responses were exercise intensity dependent. The primary findings of the study were as follows. Based on an a priori hypothesis of distinct cardiovascular response phenotypes, inspection of individual responses revealed that although some subjects had no compensatory vasodilatory (n = 4, noncompensators) or pressor responses to forearm exercise under conditions of reduced perfusion pressure, others had a partial compensation via increased vasodilation (n = 6, compensators). These compensator vs. noncompensator responses had a clear impact on metabolic and contractile function in determining exercise tolerance as evidenced by the following. First, the deficit in accumulated O2D in the arm-above-heart vs. arm-below-heart condition was markedly reduced in compensators vs. noncompensators. Second, although the noncompensators experienced deficits in submaximal V̇o2, the compensators did not. Third, the protection of submaximal O2D and V̇o2 in the compensators was associated with a smaller reduction in peak exercise intensity during arm-above-heart exercise.
Altering Forearm Perfusion Pressure
In the current study, the challenge to exercising muscle O2D-demand matching was a reduction in perfusion pressure. To manipulate perfusion pressure we raised or lowered the arm above or below the heart to alter the hydrostatic column effect at the forearm, creating a reduction of 29.5 ± 0.97 mmHg in the arm-above vs. arm-below heart condition. This method of creating a difference in local perfusion pressure has been applied in a number of other investigations, both in our laboratory and in others as a means to effectively alter local perfusion pressure and challenge O2D-demand matching (17, 30–32, 36, 38, 40).
Forearm Exercise Consistency
A comparison between perfusion pressure positions at specific exercise intensities requires that subjects are consistent in their execution of the exercise task, so that responses are compared at the same metabolic demand. There was no difference in the actual exercise intensity at each target exercise intensity between the two arm positions. This allowed us to interpret differences in the physiological response as being due to arm position effects, and not differences in exercise intensity.
Data Interpretation On the Basis of Group-Level Analysis
O2D-demand matching in the face of reduced perfusion pressure.
At the group level, O2D increased in a linear fashion with respect to exercise intensity in both arm positions. However, beyond mild exercise intensities convective O2D was compromised when perfusion pressure was reduced. Despite the reduction in convective O2D, analysis suggested that neither compensatory vasodilatory or pressor mechanisms were activated in an attempt to maintain O2D-demand matching regardless of exercise intensity. This observation is consistent with that of Walker et al. (38) and would appear to extend the observation that perfusion pressure reductions do not elicit compensatory responses across a wider range of exercise intensities.
These findings are contrary to other studies in which manipulations of CaO2 or mechanical impedances to MBF where used to challenge O2D, evoking compensatory vasodilatory and/or pressor responses such that O2D was not compromised or at least partially restored in the face of a challenge to O2D (3–5, 12, 25, 39). Further to this, V̇o2 was compromised beyond the onset of moderate exercise, and there was no difference in extraction of oxygen between arm conditions.
In summary, analysis at the group level would lead to the conclusion that no compensatory vasodilation or pressor response occurs, and no increase in oxygen extraction occurs in response to reduced perfusion pressure conditions during an incremental forearm handgrip exercise test. Subsequent within-subject analysis to identify distinct cardiovascular response phenotypes tells a different story, as discussed below.
Identification and Analysis of Cardiovascular Response Phenotypes
Each subject performed two trials in each arm position at roughly the same time of day. Trial-to-trial variability due to both measurement error and biological variability was expected. When multiple trials were averaged, their mean converged on the underlying response characteristics. Averaging two trials in each arm position allowed us to account for some of this variability and thereby obtain a better estimate of the underlying response. The reproducibility of the peak O2D, V̇o2 and exercise intensity is summarized by the typical errors (16) and coefficients of variation in Table 3. These indicate good reproducibility of trials. Further averaging of these trials and the use of the averaged subject response in statistical analysis improved our confidence in the ability to detect arm position effects, and the differences in these effects between vasodilatory compensator and noncompensator phenotypes.
To identify distinct cardiovascular response phenotypes in terms of vasodilatory compensation and/or pressor compensation for reduced forearm perfusion pressure we plotted each combination of arm-above-heart vs. arm-below-heart trials for ΔFVCRelax and ΔMAP and compared these to the line of identity, which would represent equal responses in both arm positions (see Figs. 2 and 3). The relative distribution (either along the LOI or above the LOI) would indicate whether or not compensatory mechanisms were present. Clearly evident from this analysis were two distinct responses: compensatory vasodilation vs. no compensatory vasodilation in the face of reduced forearm perfusion pressure.
Vasodilatory phenotypes in O2D-demand matching in the face of reduced perfusion pressure.
Support for the contention that these vasodilatory compensation phenotypes were distinct and real in our sample comes from the observation in our study of differences in compromise to metabolic and contractile function between groups that are consistent with the well-established effect of O2D compromise on V̇o2 and fatigue progression. Previous investigators have observed compromised forearm V̇o2 during submaximal exercise under conditions in which FBF was reduced (17, 18).
Furthermore, reductions in O2D have consistently evoked early fatigue onset and reductions in exercise performance (1, 2, 10, 20, 40). For example, Hogan et al. (14) found that in isolated electrically stimulated dog gastrocnemius muscle, when O2D was compromised to the same degree by reducing blood flow or by reducing arterial oxygen content, a similar decline in skeletal muscle force production was incurred. These data argue that O2 availability and not washout of metabolites was the cause of reduced force production. Extending this observation to exercise performance in an intact system, Fulco et al. (10) demonstrated that during knee extension exercise, the time to exhaustion was 56% shorter and muscle fatigue was twofold greater in hypoxia compared with normoxia. Amann et al. (1) demonstrated that exercise performance and quadriceps fatigue during cycling exercise is directly related to CaO2. Additional work investigating the impact of muscle perfusion on fatigue in quadriceps muscles, exercising thumbs, and upright cycling came to similar conclusions (2, 20, 40).
It is important to note that in all of these studies the sensitivity of metabolic and contractile function to O2D occurred at submaximal exercise intensities. In our study the subjects who responded with compensatory vasodilation in the face of reduced perfusion pressure, and thereby blunted the O2D deficit accumulating across the range of submaximal exercise intensities, did not experience submaximal reduction in V̇o2 as observed in noncompensators, and the compromise to their peak exercise intensity (an indication of exercise capacity) was blunted. Our finding that vasodilatory phenotype can contribute to the susceptibility of an individual to metabolic and contractile compromise in exercise has important implications for understanding individual differences in exercise tolerance and warrants further investigation.
The notion that there can be individual differences in the cardiovascular response to disturbances in exercising muscle O2D has received little attention. Recently, Casey and Joyner (6) reviewed their evidence for vasoregulatory responses to hypoperfusion. Figure 4 in their paper plotted the change in forearm vascular resistance (compensatory vasodilation) vs. the blood flow recovery achieved during forearm exercise where hypoperfusion was evoked with intrabrachial artery balloon inflation. The data stem from more than 150 trials conducted in their laboratory and show a continuum in terms of the magnitude of compensatory vasodilation ranging from 0 to 100%. Clearly, a need exists to recognize individual response heterogeneity and to incorporate it into our investigation of integrated physiological response mechanisms in exercise.
It is worthwhile to point out that at very low exercise intensities there was no compromise to O2D when the arm was positioned above the heart, regardless of subgroup. However, this was not due to compensatory vasodilation because forearm vascular conductance was virtually identical between perfusion pressure conditions regardless of subgroup. The likely explanation for a lack of compromise in O2D (blood flow) at the low exercise intensities is that the required O2D at these low exercise intensities was so small that the amount by which flow was affected by reduced perfusion pressure was not detectable within the variability of measurements. However, as exercise intensity and therefore O2 demand continued to increase, vasodilation was required to protect O2D, and it is at this point that incomplete compensatory vasodilation could result in compromised O2D. Among the participants in our study, we therefore did not find an exercise intensity dependence of effective compensation in the face of reduced perfusion pressure.
Absence of a Hypoperfusion-Evoked Compensatory Pressor Response
In our study we did not find any evidence to support activation of a pressor response with hypoperfusion of exercising forearm muscle at any exercise intensity. This is in contrast to reports by O'Leary and colleagues (22, 23) who demonstrated that a metaboreflex-evoked pressor response activation in ischemic exercising muscle of treadmill running dogs partially restored O2D, and in humans, when Joyner and Wieling (19) demonstrated a blunted pressor response to forearm exercise in response to forearm suction-evoked (supposed) hyperperfusion during rhythmic forearm exercise at 40% maximal voluntary contraction. Our findings do agree with those of Casey et al. (5, 7) who found no evidence of metaboreflex activation in response to hypoperfusion of exercising forearm muscle, and Gonzalez-Alonso et al. (12) who also observed a complete compensatory vasodilation in response to a hypoxic challenge during one-legged knee exercise. In the work of both groups the exercise challenge was a constant submaximal exercise intensity. However, on the basis of minimal increase in blood pressure from rest to exercise in their control conditions, it may be that the balance between O2D and demand was below the threshold that is required to evoke the metaboreflex. This leaves open the possibility that the lack of a pressor response with initially compromised O2D was due to the vasodilatory compensation adequately protecting the O2D demand balance such that it remained below the threshold for this reflex.
Our findings are consistent with those mentioned above that did not observe a compensatory pressor response. In our study arterial blood pressure did increase with exercise intensity in the arm-below condition, with increases of 20–30 mmHg as peak exercise intensity was approached. Therefore, it was likely the case that the metaboreflex was activated, at least at the higher exercise intensities. However, regardless of subgroup, and therefore whether there was or was not a vasodilatory compensation, no compensatory pressor response occurred. It may be that in our study and the work of Casey et al. (5, 7) and Gonzalez-Alonso et al. (12) the muscle mass involved in exercise, within the context of the degree to which O2D was compromised, did not result in enough extra activation of a metaboreflex. Perhaps with greater O2D compromise, we may have observed a compensatory pressor response. It should be remembered however, that there was a considerable compromise to exercise performance as a result of the hypoperfusion, so this would seem unlikely.
Vasodilatory Compensation Phenotypes: Potential Mechanisms
Casey and Joyner (4) identified a modest exercise intensity dependent role for endothelial derived nitric oxide (NO) in the restoration of FBF through vasodilation following intrabrachial artery balloon inflation. With the blockade of nitric oxide synthase (NOS) during rhythmic 20% (but not 10%) maximum voluntary contraction forearm exercise they detected a blunting of FBF and FVC recovery from hypoperfusion compared with control. In contrast, a role for adenosine in recovery from hypoperfusion was not observed by this same group (7). Others have identified a role for prostaglandins in protecting exercising muscle from compromises to O2D (8), albeit in that the reduced O2D was achieved via hypoxia, and responses to that type of disturbance may differ from that of blood flow reduction.
A striking observation in the present study was that nondilators, despite having reduced O2D at submaximal exercise intensities under reduced perfusion pressure conditions, did not increase O2 extraction. In contrast, compensatory dilators did increase O2 extraction. There were no differences between perfusion pressure conditions in terms of the actual exercise intensity performed at each target exercise intensity, and the observation that compensatory dilators defended V̇o2 indicates that O2 demand was also the same. Acknowledging the limitations of a whole muscle model with downstream venous effluent sampling; these findings suggest the possibility of a diffusion limitation in the nondilators, such that an O2D-demand mismatch would not manifest in a reduction in Hb saturation. One mechanism for compensatory vasodilation that would be dependent on Hb desaturation is that of the red blood cells (RBCs) acting as an O2 sensor.
It is now well established that as O2 is removed from the RBCs, the Hb molecule undergoes conformational change, which that leads to the release ATP from the RBC, which subsequently binds to P2y-purinergic receptors on the endothelium wall of the vessel resulting in endothelial nitric oxide synthase (eNOS) production of NO (3, 11, 12, 33). At the same time, endothelium-released hyperpolarizing factors are released and, together with NO, diffuse to the vascular smooth muscle, leading to vasodilation (3, 11, 12, 33). In addition, there are two states that the Hb molecule can be in: an oxygenated R-state in which Hb saturation is high and S-nitrosothiol (SNO) is bound to the Hb; or a T-state, which is formed when the Hb saturation is low and favors the release of NO directly from the Hb molecule as NO is readily accessed in this deoxygenated T-state (33). When O2 supply is reduced relative to metabolic demand, Hb desaturation increases and the T-state becomes more abundant, resulting in the release of NO, which could then cause vessel dilation.
On the basis of the information outlined above, we hypothesize that a diffusion limitation in the nondilators, indicated by a lack of further reductions in SvO2 during hypoperfusion, prevented the so-called error signal required to evoke Hb desaturation-dependent vasodilatory mechanisms. In contrast, SvO2 was significantly decreased in the arm-above vs. arm-below-heart position in the compensatory dilators. Thus, the error signal would have been present in these subjects. This hypothesis is not inconsistent with the findings of Casey and Joyner (4–6). They observed quite a modest contribution of endothelial NOS-derived NO based on their blockade studies, and the potential for RBC-derived NO to account for some or all of the remaining compensatory vasodilation remains a plausible explanation.
Potential Limitations
A number of potential limitations need to be addressed. First, there was attrition of subjects at higher exercise intensities, thus reducing statistical power to detect effects of reduced perfusion pressure. To combat this and maximize the inherent power of the repeated measures ANOVA we performed a two-way repeated measures ANOVA for every subject up to the 196 N exercise intensity and the results were interpreted. As mentioned, due to attrition after this exercise intensity, a subsequent two-way repeated measures ANOVA was performed with all subjects who completed the 220.5 N exercise intensity, but only the result from the new, 220.5 N exercise intensity was interpreted. This process was repeated for each subsequent exercise intensity, obtaining new analysis results one exercise intensity at a time until the ANOVA was no longer applicable. If only one repeated measure ANOVA encompassing all exercise intensities had been used, then only subjects who completed the highest exercise intensity could be used, thereby substantially reducing the statistical power. The current approach took advantage of the statistical power of the repeated measure ANOVA design for each exercise intensity beyond 196 N and maximized it without compromising statistical power for exercise intensities below 196 N.
Second, V̇o2 was calculated from FBF and the a-vO2 difference. Despite the fact that the catheter was positioned to obtain venous effluent solely from the exercising muscle, theoretically (although unlikely given the precise catheter location) the relative flow distribution of active vs. inactive tissues to the sample site for venous effluent may change during exercise with a greater relative proportion coming from inactive tissues. This would act to reduce the a-vO2 difference because inactive tissues would not be extracting O2 to the same extent as the active muscle. As a result, V̇o2 would be artificially decreased. Given the known linear relationship between V̇o2 and exercise intensity, if this mixing of the venous return from active and inactive tissues were occurring, a reduction in the slope of increase in V̇o2 with exercise intensity would be evident. It might therefore be argued that this was the case for the nondilators in the arm-above position where V̇o2 during submaximal exercise intensity was reduced. However, two key observations argue against a relative flow redistribution issue and are consistent with this being a true compromise to V̇o2. First, the response for the vasodilators was linear in both arm positions and no compromise to V̇o2 was experienced. Second, the greater impact on exercise capacity of the arm-above position in the nondilators is consistent with impairments in submaximal V̇o2.
Third, with the post hoc identification of cardiovascular response phenotypes (because this cannot be completed a priori), comparisons between phenotypes were based on an n of 3 and 4 subjects for the vasodilators and nonvasodilators, respectively, for all comparisons involving venous blood constituents (due to technical problems with blood sampling and analysis the n of the vasodilators was reduced). Small sample sizes present an increase in the likelihood of a type II error (i.e., not being able to detect a difference when in fact a difference is present). The likelihood of committing a type I error in this case; that is, stating a difference when in fact there is no difference, is reduced because the subjects were randomly sampled and the null hypothesis was correctly applied. This lends more confidence to the following statistically significant findings: 1) reductions in V̇o2 in the nonvasodilators during reduced perfusion pressure; 2) ∼5% reduction in SvO2 with reduced perfusion pressure in the compensatory vasodilators. It is acknowledged that the lack of statistical significance for 1) potential differences in V̇o2 between perfusion pressure conditions in the compensatory vasodilators and 2) potential differences in SvO2 between perfusion pressure conditions in the nondilators could be because of inadequate statistical power. However, the fact that these differences were clearly statistically detectable in the other group supports at least the interpretation that reduced forearm perfusion pressure compromised V̇o2 more in the nondilators than the compensatory vasodilators, and that compensatory vasodilators were clearly able to desaturate more than the nondilators.
An additional issue with a small sample size is that of the parametric assumption of normality. With small sample sizes, tests for normality are not valid. We addressed this issue with the application of bootstrapping as discussed in the Statistical Analysis section. This analysis corroborated the parametric analysis results of significant findings, and strengthens confidence in our interpretation of the data.
Finally, there is the issue of whether the sample size is a limitation in being able to identify the existence of two distinct phenotypes. However, phenotype refers to the observable traits or functional responses of an individual. In other words, if differences exist between individuals, there are differences in phenotype. We identified four individuals who all demonstrated a lack of compensatory vasodilation or pressor responses in the face of hypoperfusion of exercising muscle. Six individuals demonstrated compensatory vasodilation in response to hypoperfusion. These two response phenotypes were clearly identifiable, repeatable within individuals, and had identifiably distinct impacts on exercise performance under conditions of reduced perfusion pressure.
Conclusions
Reductions in exercising forearm perfusion pressure of ∼30 mmHg result in a compromise to O2D-demand matching beyond mild exercise intensities. This is consistent with findings of others (9, 38, 40). To our knowledge, this is the first study to identify compensatory vasodilator vs. nonvasodilator phenotypes in response to reduced perfusion pressure. Observations that compensatory vasodilation partially compensates for reduced perfusion pressure with increased vasodilation, thereby protecting V̇o2 and blunting decrements in exercise capacity support the phenotype differences as having meaningful impact on metabolic function and exercise capacity. Consideration and identification of cardiovascular response phenotypes may provide important new insight for understanding individual differences in exercise tolerance.
GRANTS
Support for this study was provided by Natural Sciences and Engineering Research Council (NSERC) of Canada Discovery Grant 250367–11 and Research Tools and Instruments Grant EQPEQ0407690–11, and by infrastructure grants from the Canadian Foundation for Innovation and the Ontario Innovation Trust to M. E. Tschakovsky. R. F. Bentley was supported by an M.Sc.-level NSERC Canadian Graduate Scholarship.
DISCLOSURES
No conflicts of interest, financial or otherwise, are declared by the author(s).
AUTHOR CONTRIBUTIONS
Author contributions: R.F.B. and M.E.T. conception and design of research; R.F.B., J.M.K., J.S.M., V.J.P., and J.J.W. performed experiments; R.F.B., J.M.K., J.S.M., and J.J.W. analyzed data; R.F.B. and M.E.T. interpreted results of experiments; R.F.B. prepared figures; R.F.B. drafted manuscript; R.F.B. and M.E.T. edited and revised manuscript; M.E.T. approved final version of manuscript.
REFERENCES
- 1.Amann M, Eldridge MW, Lovering AT, Stickland MK, Pegelow DF, Dempsey JA. Arterial oxygenation influences central motor output and exercise performance via effects on peripheral locomotor muscle fatigue in humans. J Physiol 575: 937–952, 2006 [DOI] [PMC free article] [PubMed] [Google Scholar]
- 2.Amann M, Romer LM, Subudhi AW, Pegelow DF, Dempsey JA. Severity of arterial hypoxaemia affects the relative contributions of peripheral muscle fatigue to exercise performance in healthy humans. J Physiol 581: 389–403, 2007 [DOI] [PMC free article] [PubMed] [Google Scholar]
- 3.Calbet JA, Lundby C, Koskolou M, Boushel R. Importance of hemoglobin concentration to exercise: acute manipulations. Respir Physiol Neurobiol 151: 132–140, 2006 [DOI] [PubMed] [Google Scholar]
- 4.Casey DP, Joyner MJ. NOS inhibition blunts and delays the compensatory dilation in hypoperfused contracting human muscles. J Appl Physiol 107: 1685–1692, 2009 [DOI] [PMC free article] [PubMed] [Google Scholar]
- 5.Casey DP, Joyner MJ. Skeletal muscle blood flow responses to hypoperfusion at rest and during rhythmic exercise in humans. J Appl Physiol 107: 429–437, 2009 [DOI] [PMC free article] [PubMed] [Google Scholar]
- 6.Casey DP, Joyner MJ. Local control of skeletal muscle blood flow during exercise: influence of available oxygen. J Appl Physiol 111: 1527–1538, 2011 [DOI] [PMC free article] [PubMed] [Google Scholar]
- 7.Casey DP, Madery BD, Pike TL, Eisenach JH, Dietz NM, Joyner MJ, Wilkins BW. Adenosine receptor antagonist and augmented vasodilation during hypoxic exercise. J Appl Physiol 107: 1128–1137, 2009 [DOI] [PMC free article] [PubMed] [Google Scholar]
- 8.Crecelius AR, Kirby BS, Voyles WF, Dinenno FA. Augmented skeletal muscle hyperaemia during hypoxic exercise in humans is blunted by combined inhibition of nitric oxide and vasodilating prostaglandins. J Physiol 589: 3671–3683, 2011 [DOI] [PMC free article] [PubMed] [Google Scholar]
- 9.Fitzpatrick R, Taylor JL, McCloskey DI. Effects of arterial perfusion pressure on force production in working human hand muscles. J Physiol 495, Pt 3: 885–891, 1996 [DOI] [PMC free article] [PubMed] [Google Scholar]
- 10.Fulco CS, Lewis SF, Frykman PN, Boushel R, Smith S, Harman EA, Cymerman A, Pandolf KB. Muscle fatigue and exhaustion during dynamic leg exercise in normoxia and hypobaric hypoxia. J Appl Physiol 81: 1891–1900, 1996 [DOI] [PubMed] [Google Scholar]
- 11.Gonzalez-Alonso J, Olsen DB, Saltin B. Erythrocyte and the regulation of human skeletal muscle blood flow and oxygen delivery: role of circulating ATP. Circ Res 91: 1046–1055, 2002 [DOI] [PubMed] [Google Scholar]
- 12.Gonzalez-Alonso J, Richardson RS, Saltin B. Exercising skeletal muscle blood flow in humans responds to reduction in arterial oxyhaemoglobin, but not to altered free oxygen. J Physiol 530: 331–341, 2001 [DOI] [PMC free article] [PubMed] [Google Scholar]
- 13.Haseler LJ, Richardson RS, Videen JS, Hogan MC. Phosphocreatine hydrolysis during submaximal exercise: the effect of FiO2. J Appl Physiol 85: 1457–1463, 1998 [DOI] [PubMed] [Google Scholar]
- 14.Hogan MC, Richardson RS, Kurdak SS. Initial fall in skeletal muscle force development during ischemia is related to oxygen availability. J Appl Physiol 77: 2380–2384, 1994 [DOI] [PubMed] [Google Scholar]
- 15.Hogan MC, Willford DC, Keipert PE, Faithfull NS, Wagner PD. Increased plasma O2 solubility improves O2 uptake of in situ dog muscle working maximally. J Appl Physiol 73: 2470–2475, 1992 [DOI] [PubMed] [Google Scholar]
- 16.Hopkins WG. Measures of reliability in sports medicine and science. Sports Med 30: 1–15, 2000 [DOI] [PubMed] [Google Scholar]
- 17.Hughson RL, Shoemaker JK, Tschakovsky ME, Kowalchuk JM. Dependence of muscle V̇o2 on blood flow dynamics at onset of forearm exercise. J Appl Physiol 81: 1619–1626, 1996 [DOI] [PubMed] [Google Scholar]
- 18.Joyner MJ, Nauss LA, Warner MA, Warner DO. Sympathetic modulation of blood flow and O2 uptake in rhythmically contracting human forearm muscles. Am J Physiol Heart Circ Physiol 263: H1078–H1083, 1992 [DOI] [PubMed] [Google Scholar]
- 19.Joyner MJ, Wieling W. Increased muscle perfusion reduces muscle sympathetic nerve activity during handgripping. J Appl Physiol 75: 2450–2455, 1993 [DOI] [PubMed] [Google Scholar]
- 20.Katayama K, Amann M, Pegelow DF, Jacques AJ, Dempsey JA. Effect of arterial oxygenation on quadriceps fatigability during isolated muscle exercise. Am J Physiol Regul Integr Comp Physiol 292: R1279–R1286, 2007 [DOI] [PubMed] [Google Scholar]
- 21.Murrant CL, Sarelius IH. Coupling of muscle metabolism and muscle blood flow in capillary units during contraction. Acta Physiol Scand 168: 531–541, 2000 [DOI] [PubMed] [Google Scholar]
- 22.O'Leary DS, Augustyniak RA, Ansorge EJ, Collins HL. Muscle metaboreflex improves O2 delivery to ischemic active skeletal muscle. Am J Physiol Heart Circ Physiol 276: H1399–H1403, 1999 [DOI] [PubMed] [Google Scholar]
- 23.O'Leary DS, Sheriff DD. Is the muscle metaboreflex important in control of blood flow to ischemic active skeletal muscle in dogs? Am J Physiol Heart Circ Physiol 268: H980–H986, 1995 [DOI] [PubMed] [Google Scholar]
- 24.Perrey S, Tschakovsky ME, Hughson RL. Muscle chemoreflex elevates muscle blood flow and O2 uptake at exercise onset in nonischemic human forearm. J Appl Physiol 91: 2010–2016, 2001 [DOI] [PubMed] [Google Scholar]
- 25.Poitras V, Calder-Sprackman S, Pak M, Hong T, Tschakovsky ME. Vasoregulatory mechanisms compensate for changes in muscle contraction-induced mechanical impedance to blood flow in exercise. Appl Physiol Nutr Metab 33: S81, 2008 [Google Scholar]
- 26.Radegran G. Ultrasound Doppler estimates of femoral artery blood flow during dynamic knee extensor exercise in humans. J Appl Physiol 83: 1383–1388, 1997 [DOI] [PubMed] [Google Scholar]
- 27.Richardson RS, Kennedy B, Knight DR, Wagner PD. High muscle blood flows are not attenuated by recruitment of additional muscle mass. Am J Physiol Heart Circ Physiol 269: H1545–H1552, 1995 [DOI] [PubMed] [Google Scholar]
- 28.Romer LM, Haverkamp HC, Lovering AT, Pegelow DF, Dempsey JA. Effect of exercise-induced arterial hypoxemia on quadriceps muscle fatigue in healthy humans. Am J Physiol Regul Integr Comp Physiol 290: R365–R375, 2006 [DOI] [PubMed] [Google Scholar]
- 29.Rowell LB, Savage MV, Chambers J, Blackmon JR. Cardiovascular responses to graded reductions in leg perfusion in exercising humans. Am J Physiol Heart Circ Physiol 261: H1545–H1553, 1991 [DOI] [PubMed] [Google Scholar]
- 30.Saunders NR, Tschakovsky ME. Evidence for a rapid vasodilatory contribution to immediate hyperemia in rest-to-mild and mild-to-moderate forearm exercise transitions in humans. J Appl Physiol 97: 1143–1151, 2004 [DOI] [PubMed] [Google Scholar]
- 31.Shoemaker JK, MacDonald MJ, Hughson RL. Time course of brachial artery diameter responses to rhythmic handgrip exercise in humans. Cardiovasc Res 35: 125–131, 1997 [DOI] [PubMed] [Google Scholar]
- 32.Shoemaker JK, Tschakovsky ME, Hughson RL. Vasodilation contributes to the rapid hyperemia with rhythmic contractions in humans. Can J Physiol Pharmacol 76: 418–427, 1998 [DOI] [PubMed] [Google Scholar]
- 33.Singel DJ, Stamler JS. Chemical physiology of blood flow regulation by red blood cells: the role of nitric oxide and S-nitrosohemoglobin. Annu Rev Physiol 67: 99–145, 2005 [DOI] [PubMed] [Google Scholar]
- 34.Tschakovsky ME, Hughson RL. Ischemic muscle chemoreflex response elevates blood flow in nonischemic exercising human forearm muscle. Am J Physiol Heart Circ Physiol 277: H635–H642, 1999 [DOI] [PubMed] [Google Scholar]
- 35.Tschakovsky ME, Matusiak K, Vipond C, McVicar L. Lower limb-localized vascular phenomena explain initial orthostatic hypotension upon standing from squat. Am J Physiol Heart Circ Physiol 301: H2102–H2112, 2011 [DOI] [PubMed] [Google Scholar]
- 36.Tschakovsky ME, Rogers AM, Pyke KE, Saunders NR, Glenn N, Lee SJ, Weissgerber T, Dwyer EM. Immediate exercise hyperemia in humans is contraction intensity dependent: evidence for rapid vasodilation. J Appl Physiol 96: 639–644, 2004 [DOI] [PubMed] [Google Scholar]
- 37.Wagner PD. Muscle intracellular oxygenation during exercise: optimization for oxygen transport, metabolism, and adaptive change. Eur J Appl Physiol 112: 1–8, 2011 [DOI] [PubMed] [Google Scholar]
- 38.Walker KL, Saunders NR, Jensen D, Kuk JL, Wong SL, Pyke KE, Dwyer EM, Tschakovsky ME. Do vasoregulatory mechanisms in exercising human muscle compensate for changes in arterial perfusion pressure? Am J Physiol Heart Circ Physiol 293: H2928–H2936, 2007 [DOI] [PubMed] [Google Scholar]
- 39.Wolfel EE, Groves BM, Brooks GA, Butterfield GE, Mazzeo RS, Moore LG, Sutton JR, Bender PR, Dahms TE, McCullough RE, et al. Oxygen transport during steady-state submaximal exercise in chronic hypoxia. J Appl Physiol 70: 1129–1136, 1991 [DOI] [PubMed] [Google Scholar]
- 40.Wright JR, McCloskey DI, Fitzpatrick RC. Effects of muscle perfusion pressure on fatigue and systemic arterial pressure in human subjects. J Appl Physiol 86: 845–851, 1999 [DOI] [PubMed] [Google Scholar]
- 41.Wyss CR, Ardell JL, Scher AM, Rowell LB. Cardiovascular responses to graded reductions in hindlimb perfusion in exercising dogs. Am J Physiol Heart Circ Physiol 245: H481–H486, 1983 [DOI] [PubMed] [Google Scholar]