

Abstract
Whether lean body mass (LBM) composition, especially skeletal muscle and abdominal organs, differs in adults with type 2 diabetes (T2DM) compared with nondiabetic healthy controls has not been investigated. A subset of African-American and Caucasian participants with T2DM from the Look AHEAD (Action for Health in Diabetes) trial had body composition assessed and compared with a sample of healthy controls. Skeletal muscle mass (SMM), liver, kidneys, and spleen mass were quantified using a contiguous slice magnetic resonance imaging (MRI) protocol. Cardiac mass was quantified by either a cardiac gated MRI protocol or by echocardiography. MRI volumes were converted to mass using assumed densities. Dual-energy X-ray absorptiometry assessed LBM. Using general linear models adjusted for height, weight, sex, age, race, and interactions of diabetes status with race or sex, persons with T2DM (n = 95) had less LBM (49.7 vs. 51.6 kg) and SMM (24.1 vs. 25.4 kg) and larger kidneys (0.40 vs. 0.36 kg) than controls (n = 76) (all P < 0.01). Caucasians with T2DM had larger livers (1.90 vs. 1.60 kg, P < 0.0001) and spleens (0.29 vs. 0.22 kg, P < 0.01), and T2DM men had less cardiac mass than controls (0.25 vs. 0.30 kg, P < 0.001). In this sample, T2DM is characterized by less relative skeletal muscle and cardiac mass in conjunction with larger kidneys, liver, and spleen. Further investigation is needed to establish the causes and metabolic consequences of these race- and sex-specific organ mass differences in T2DM.
Keywords: African American, Caucasian, magnetic resonance imaging, kidneys, liver, spleen
the characterization of body composition in persons with type 2 diabetes mellitus (T2DM) has been largely limited to fat distribution and its effects on metabolic disease (2, 3, 23, 24, 40, 43–45). Because skeletal muscle mass is the major site of glucose disposal and insulin uptake (52), it is of clinical importance to know whether this metabolically important tissue, which constitutes ∼75% of total body lean mass in healthy adults (46), is preserved in persons with T2DM. Longitudinal data in older adults indicate that the age-associated reduction in thigh cross-sectional area and appendicular lean mass is accelerated in women with T2DM compared with healthy controls, but this difference was not found in men (35). Another possible contributor to the apparent differences in the quantity of lean tissue mass lost in individuals with T2DM may be the effect of race. Recent evidence links the established energy expenditure differences between African Americans and Caucasians (18, 29) to discrepancies in high-metabolic-rate organ masses such as liver, kidneys, heart, spleen, and brain (15). Whether these sex- and race-dependent effects on skeletal muscle or organ mass affect lean tissue preservation in persons with diabetes, a disease state that directly affects protein metabolism (19, 37) and may influence the relative size of lean tissues and organs, is still unknown.
The primary aim of this study was to assess lean body mass (LBM), skeletal muscle mass, and the mass of specific high-metabolic-rate organs (liver, kidneys, spleen, and heart) in a biracial sample of men and women with T2DM and compare them with nondiabetic controls. A secondary aim was to determine whether the differences in tissue and organ masses between T2DM and controls are race and sex dependent.
MATERIALS AND METHODS
Type 2 diabetes.
Look AHEAD (Action for Health in Diabetes) Trial participants at New York and Pittsburgh sites were invited to enroll in an ancillary body composition study before any intervention commenced. Methods and design for the clinical trial investigating weight loss for the prevention of cardiovascular disease in T2DM have been described previously (39), as well as the baseline characteristics and description of the randomized cohort (49). Participants in the current ancillary study, like the remainder of the Look AHEAD cohort of 5,145 at baseline, were overweight and obese [body mass index (BMI) ≥25 kg/m2] adults 45–76 yr of age and were clinically diagnosed with T2DM (49). Glycosylated hemoglobin (A1c), resting blood pressures, medications, and other anthropometric data were collected according to methods previously published by the Look AHEAD research group (39). Preintervention data from white and African-American participants were compared with nondiabetic controls in this analysis.
Nondiabetic controls.
A convenience sample of white and African-American subjects was compiled from the investigators' archived databases, including ambulatory nonsmoking subjects 18–88 yr of age who were free from medical conditions (diabetes mellitus, malignancies, or catabolic disease) or metabolic characteristics (abnormal thyroid or cortisol levels) that could affect body composition. Subjects had been recruited into various studies from the greater New York City area through newspaper and radio advertisements and posted flyers. All were weight stable (<2 kg change within past 6 mo) and did not regularly engage in vigorous exercise. A BMI ceiling of 38 kg/m2 was set to accommodate magnetic resonance image (MRI) scanner limitations. All studies were approved by the Institutional Review Board of St. Luke's-Roosevelt Hospital or the University of Pittsburgh (as appropriate), and each subject gave written consent before data were collected.
Body composition measures.
Body weight was measured to the nearest 0.1 kg using a scale (Weight Tronix, New York, NY) and height to the nearest 0.5 cm using a stadiometer (Holtain; Crosswell, Wales). Total body fat and fat-free mass (FFM) (body weight minus total body fat) were measured with a whole body Dual-energy X-ray absorptiometry (DXA) scanner (GE Lunar, Madison, WI), DPX (software 3.6Y), or DPXL (software 4.7E). The between-measurement technical errors for total body fat and FFM in the same subject are 3.4 and 1.2%, respectively (17). LBM was calculated as FFM minus bone mineral. The daily quality control and calibration measures practiced in the DXA laboratory have been previously described (47).
A whole body MRI protocol using an axial T1-weighted spin echo sequence with 10 mm thickness, 40 mm interslice gap, and a 40 × 40 cm2 field of view was used to quantify skeletal muscle mass.
Organ mass measurement.
Liver, kidneys, and spleen volumes were also measured by MRI using an axial T1-weighted spin echo sequence with 5 mm slice thickness and no interslice gap throughout the abdominal region using acquisition and segmentation analysis techniques that have been described previously (15, 16). The volume of the left ventricle was measured by cardiac-gated MRI in all T2DM subjects and in a majority of the controls (n = 51; 16 men, 35 women). Echocardiographic assessment of left ventricle mass (LVM) was used for controls before 2001 (n = 25; 8 men, 17 women). Detailed explanations of both methods have been described previously (10, 15, 16, 41). The gated MRI protocol consisted of 8–12 contiguous short-axis image locations along the short axis of the left ventricle, using the electrocardiographic R wave to determine the image that represented end diastole for volume analysis. A single radiologist, blind to the hypothesis, analyzed all cases. In a series of 10 normal subjects, the mean intraobserver variability for estimating LVM was 5.13 ± 2.9% (22). LVM was multiplied by 1.5 to reflect total cardiac mass (21).
Image analyses.
SliceOmatic image analysis software (version 4.2; Tomovision, Montreal, CA) was used to analyze all MRIs on a personal computer workstation (Gateway, Madison, WI). With the use of an assumed density for each tissue and organ [skeletal muscle, liver, kidneys, and spleen: 1.05 kg/l; heart: 1.03 kg/l (46)], MRI volumes were converted to masses. In our laboratory, six complete MRI scans of liver, kidneys, and spleen were read by two independent analysts, resulting in between-analyst coefficients of variation that were 3.5, 0.9, and 4.3%, respectively. Four independent analysts read three whole body MRI scans for skeletal muscle between 2 and 10 times each, with a coefficient of variation of 2.1%.
Statistical analysis.
Descriptive subject data are expressed as means ± SD. General linear models were used for all tests of group differences and interactions. Comparisons of organ masses between groups were adjusted for height, weight, age, sex, and race. A test for interaction between diabetes status and race or sex was also conducted within each model, and all significant interactions found were presented accordingly; for example, a group-by-race interaction necessitated presentation of diabetes group means separately for Caucasians and African Americans. Quadratic and cubic terms were included in the models to check linearity of the relationships. A Pearson correlation was used to determine the relationship between cardiac mass and BMI in men and women. Data were analyzed using SAS software 9.2 (SAS, Cary, NC), and P < 0.05 was considered to be statistically significant.
RESULTS
Group characteristics and body composition.
Characteristics of the T2DM and control groups are listed in Table 1. Group means were not different with regards to age, height, or sex and race distribution. The T2DM group had significantly higher body mass than controls (P < 0.0001). None of the controls was taking prescribed medications, whereas a majority of the T2DM group was being treated for diabetes and hypertension, and over one-third was taking lipid-lowering medications.
Table 1.
Subject characteristics
| T2DM Group |
Control Group |
|||||
|---|---|---|---|---|---|---|
| Caucasian | African American | All | Caucasian | African American | All | |
| n | 61 | 34 | 95 | 46 | 30 | 76 |
| Males/females | 33/28 | 6/28 | 39/56 | 20/26 | 4/26 | 24/52 |
| Age, yr | 57.4 (6.0) | 57.5 (7.4) | 57.5 (6.4) | 54.1 (17.1) | 57.9 (19.8) | 55.6 (18.1) |
| Height, m | 1.7 (0.1) | 1.6 (0.1) | 1.7 (0.1) | 1.6 (0.1) | 1.6 (0.1) | 1.7 (0.1) |
| Body wt, kg | 92.2 (12.5)† | 85.6 (13.8)† | 89.8 (13.2)* | 69.2 (12.9) | 72.6 (13.7) | 70.5 (13.3) |
| Body mass index, kg/m2 | 32.2 (3.3)† | 31.7 (3.6)† | 32.0 (3.4)* | 24.3 (3.5) | 26.9 (5.0) | 25.3 (4.3) |
| Fat mass, kg (DXA) | 33.7 (7.8)† | 33.6 (6.1)† | 33.6 (7.0)* | 18.8 (7.9) | 25.7 (10.1) | 21.5 (9.4) |
| LBM, kg (DXA) | 54.0 (10.8)† | 47.3 (9.4) | 51.6 (10.8)* | 47.1 (10.4) | 44.7 (8.3) | 46.1 (9.7) |
| Skeletal muscle, kg (MRI)a | 25.8 (6.6)† | 22.8 (5.5) | 24.7 (6.4)* | 22.5 (6.2) | 21.9 (5.2) | 22.3 (5.8) |
| Liver, kg (MRI)a | 2.05 (0.46)† | 1.56 (0.29)† | 1.87 (0.47)* | 1.46 (0.23) | 1.38 (0.29) | 1.43 (0.26) |
| Kidneys, kg (MRI)a | 0.45 (0.09)† | 0.38 (0.08)† | 0.43 (0.09)* | 0.33 (0.08) | 0.31 (0.06) | 0.32 (0.07) |
| Spleen, kg (MRI)a | 0.32 (0.17)† | 0.12 (0.04) | 0.25 (0.17)* | 0.19 (0.08) | 0.13 (0.06) | 0.17 (0.08) |
| Heart, kg (MRIa/Echob) | 0.25 (0.06) | 0.25 (0.07) | 0.25 (0.06)* | 0.22 (0.07) | 0.22 (0.05) | 0.23 (0.06) |
| Hemoglobin A1c, % | 7.4 (1.4) | 7.5 (1.1) | 7.4 (1.2) | |||
| Systolic blood pressure, mmHg | 122.6 (15.7) | 118.2 (12.5) | 121.0 (14.8) | 117.7 (15.9) | 119.0 (19.1) | 118.2 (17.1) |
| Diastolic blood pressure, mmHg | 68.9 (9.9) | 68.3 (9.7) | 68.7 (9.8) | 72.8 (9.2)† | 70.4 (9.4) | 71.8 (9.3)* |
| Resting heart rate, beats/min | 71.7 (12.1) | 69.8 (14.5) | 71.0 (12.9) | 67.5 (8.9) | 66.9 (7.5) | 67.3 (8.3) |
| Medication use, % of sample | ||||||
| For diabetes: insulin | 11 | 6 | 9 | |||
| For diabetes: other meds | 89 | 88 | 88 | |||
| For hypertension | 68 | 68 | 66 | |||
| For hypercholesterolemia | 45 | 26 | 39 | |||
Values are unadjusted group means (SD); n, no. of subjects. DXA, dual-energy X-ray absorptiometry; LBM, lean body mass (body wt − fat and bone mass) by DXA;
Tissue/organ masses were derived from magnetic resonance image (MRI) volumes;
left ventricular mass was derived from echocardiogram (Echo).
Unadjusted mean significantly greater than comparison group (P < 0.05);
Unadjusted mean significantly greater than race-specific comparison group (P < 0.05).
LBM: Skeletal muscle and organ masses.
After adjusting for differences in height, weight, age, sex, and race, LBM by DXA was 1.5 kg (3%) lower in the T2DM group than controls (P < 0.05). The MRI-measured skeletal muscle, which is a subcomponent of LBM, was 1.1 kg (4%) lower in T2DM compared with controls (P < 0.05). Adjusted kidney mass was 44 g (12%) larger in T2DM subjects compared with controls (P < 0.001). No group-by-race or group-by-sex interactions were found in the differences between groups for LBM, skeletal muscle, or kidneys. Adjusted mean values for these tissues are presented in Fig. 1.
Fig. 1.
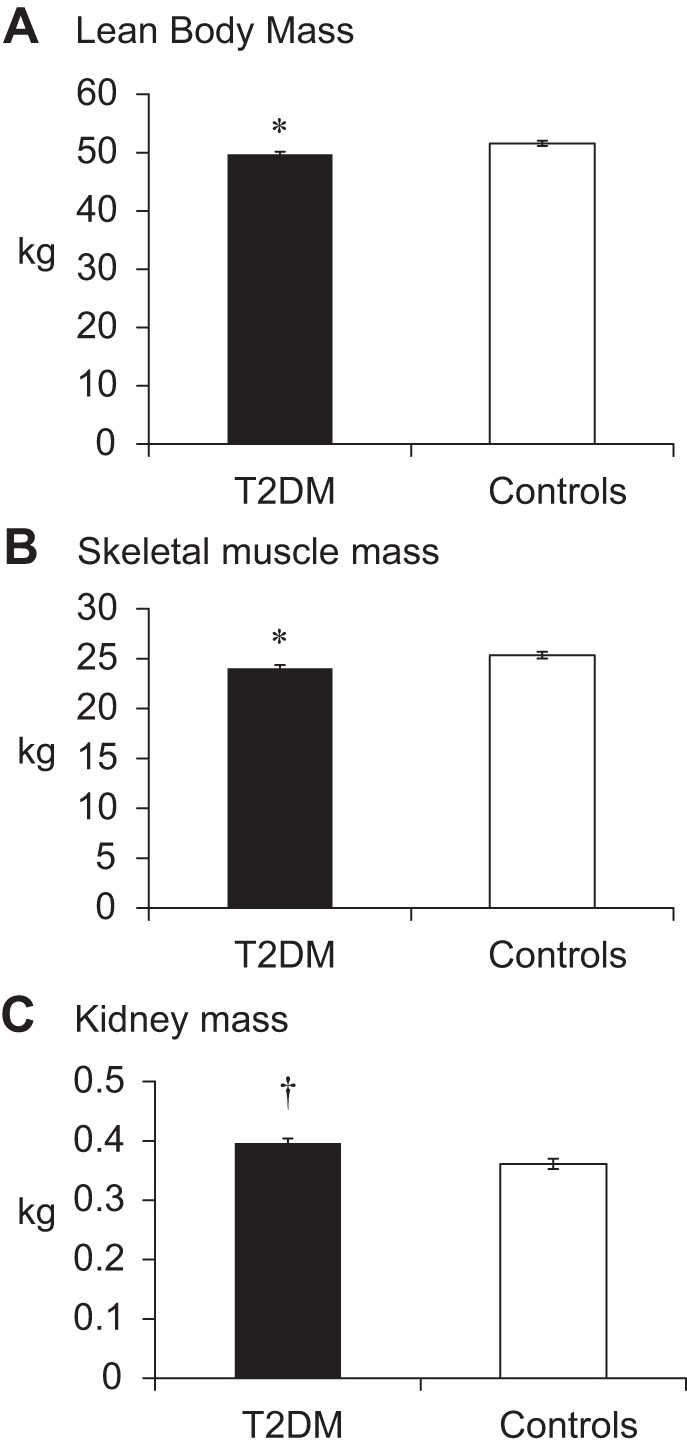
Lean body mass by dual-energy X-ray absorptiometry (A), skeletal muscle mass by magnetic resonance imaging (MRI) (B), and kidney mass by MRI (C) in subjects with or without diabetes. T2DM, type 2 diabetes mellitus. Means are adjusted for height, weight, age, sex, and race. *Significantly less than controls (P < 0.05). †Significantly greater than controls (P < 0.05).
A significant group-by-race interaction was found for liver mass such that T2DM Caucasians, but not African Americans, had 300 g (19%) more liver mass than nondiabetic controls (P < 0.0001). We looked for relationships between A1c levels and lean mass variables within the diabetes group. After control for age, sex, race, and body weight, A1c was positively correlated with liver size, but associations with A1c did not reach significance for any of the other lean mass variables investigated in this study. A significant group-by-race interaction (P < 0.01) revealed a 73-g (33%) greater spleen mass in T2DM Caucasians (P = 0.008), whereas no differences were found among African Americans. The adjusted mean values for liver and spleen by race are presented in Fig. 2.
Fig. 2.
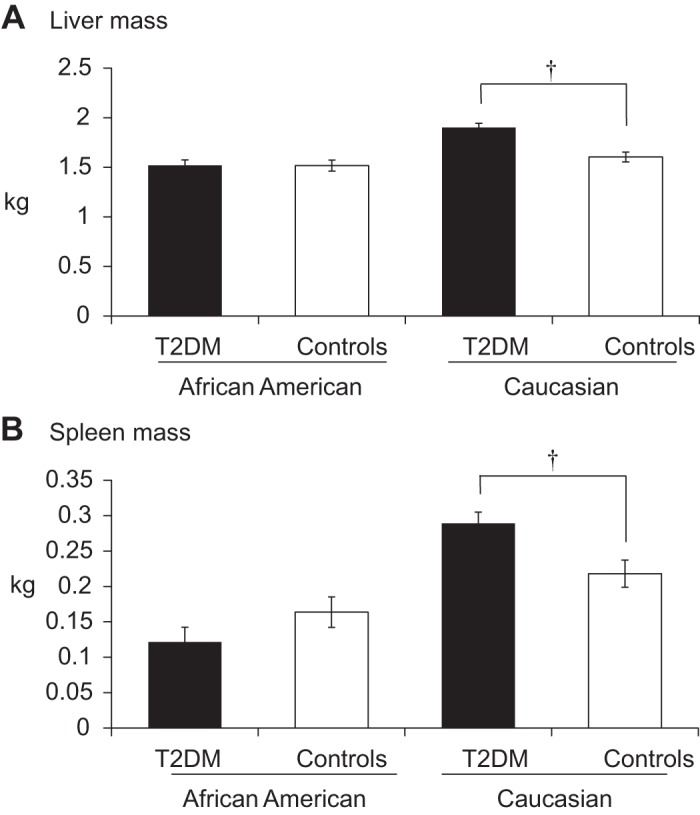
Liver mass (A) and spleen mass (B) by MRI in subjects with or without diabetes. Means are presented within each race group and are adjusted for height, weight, age, and sex. †Significantly greater than same-race controls (P < 0.0001).
A group-by-sex interaction was found for cardiac mass such that men with T2DM had 45-g (15%) smaller hearts than their nondiabetic counterparts (P = 0.005), whereas no group differences were observed in women. This relationship remained when the same model was performed using only subjects with MRI-measured hearts [n = 144, T2DM men had 48 g less cardiac mass than controls (P < 0.08) and did not differ (p > 0.83) in women]. Heart size was significantly correlated with BMI in women (r = 0.54, P < 0.0001) but not in men. Medications used for hypertension and systolic and diastolic blood pressures did not significantly affect the difference in cardiac mass between diabetes and control groups. The within-group (T2DM vs. control) adjusted mean values for cardiac mass by sex are presented in Fig. 3.
Fig. 3.
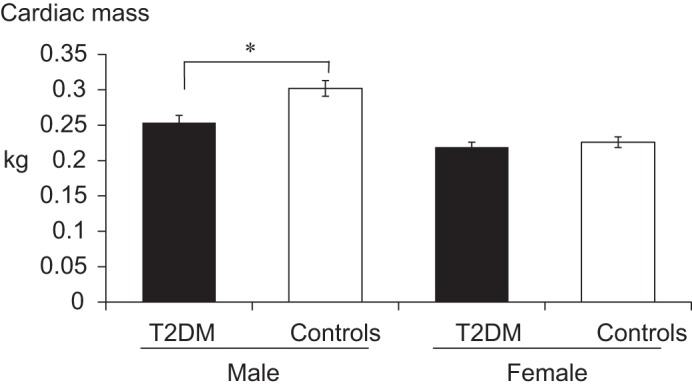
Cardiac mass by MRI in subjects with or without diabetes. Means are presented within each sex group and are adjusted for height, weight, age, and race. *Significantly less than male controls (P = 0.005).
DISCUSSION
This study is the first to report in vivo measurements of total body skeletal muscle and abdominal organs (liver, kidneys, spleen, and heart) when comparing body composition differences between adults with T2DM and healthy controls. Primary findings of the study are that, compared with healthy controls after adjusting for relevant confounding variables, adults with T2DM had less LBM and less skeletal muscle mass; however, kidneys, liver, and spleen masses were larger. Larger liver and spleen masses were only found in Caucasians with T2DM, not African Americans, and males with T2DM had smaller hearts compared with male controls. These observations suggest a specific relationship between the relative size of these organs and the diabetic state. They also reveal sex- and race-specific differences in relative organ sizes that may have metabolic consequences and thus warrant further investigation.
The lipodystrophy of diabetes is well documented, along with the observation that muscle quality and physical function decline in subjects with diabetes vs. age-matched controls (1, 31, 36). Muscle atrophy in diabetes is not as well described in the literature, however. The Health ABC study demonstrated an accelerated loss of muscle mass over six years in older women with diabetes but observed no effect of diabetes status in men despite a relatively rapid muscle loss over the same time period compared with women (35). A much smaller study of dialysis patients with or without diabetes reported significantly less skeletal muscle in patients with diabetes, but these differences were lost when controlling for age and sex (42). The current study confirms the notion that muscle mass is lower in T2DM, but, unlike these previous studies, the influence of sex did not ameliorate the relationship between diabetes status and less total body muscle or LBM. Subjects with diabetes had less lean and skeletal muscle tissue after controlling for the influence of height, weight, age, sex, or race, suggesting that T2DM may accelerate skeletal muscle atrophy in both men and women. Studies have shown that patients with diabetes do not differ from controls in their ability to improve muscle mass through aerobic (27) or resistance (13, 25) exercise, and these intervention strategies are also extremely beneficial in diabetes management (8). The present study's observation that patients with diabetes have less skeletal muscle compared with controls, coupled with recent evidence that subsequent lifestyle and exercise intervention effectively slow the decline in mobility within these Look AHEAD participants after four years (38), underscores the importance of exercise as a means of maintaining muscle and avoiding disability in patients with diabetes.
The masses of other high-metabolic-rate organs such as kidneys, liver, and spleen were significantly greater in diabetic subjects. A previous report of increased glomerular filtration rate and kidney size (as measured by cross-sectional area) after six years of diabetes (51) agrees with the current observation that kidney mass is greater in T2DM regardless of sex or race. It is also logical that subjects with diabetes had significantly larger livers than controls in this study, since hepatic steatosis is a common characteristic of diabetes (7) and results in hepatomegaly (9). Indeed, a fatty liver is associated with the metabolic syndrome, with insulin resistance being a prominent feature, regardless of BMI (26). Our observation that liver size was positively correlated with A1c levels within the diabetes group confirms the notion that an enlarged and fatty liver is associated with poor glucose control (48) and hemorheological abnormalities (12).
Why spleens would be enlarged in Caucasians with diabetes, however, and similarly, why African Americans with diabetes did not have larger livers than their nondiabetic controls is less intuitive. Recent studies using liver attenuation by computed tomography as a measure of fatty liver disease did not find differences in hepatic lipid concentrations after control for BMI when comparing various racial groups (32, 33), which suggests that racial differences in liver size observed in our study may not be simply explained by liver fat accumulation. Another study of racial differences in organ size and metabolic rate between Caucasians and African Americans demonstrated that the total mass of high-metabolic-rate organs (sum of liver, heart, spleen, kidneys, and brain) was significantly less in African Americans after statistical adjustment for fat mass, FFM, sex, and age (15). When this race-dependent difference in organ mass was considered in a model predicting resting energy expenditure, it rendered the racial differences in energy expenditure statistically nonsignificant (15). Our observed diabetes-dependent difference in liver and spleen mass in Caucasians that was not present in African Americans may influence total energy expenditure. Unfortunately, we were not able to assess metabolic rate in this study and cannot imply the direction of these potential differences in energy expenditure.
The observation that men with diabetes had a mean adjusted cardiac mass that was smaller than controls is not consistent with a majority of the available literature. Significant positive associations between T2DM and echo-measured left ventricular wall thickness have been established in large cross-sectional (11, 20, 34) and longitudinal studies (28), perhaps explained by the strong association between diabetes and hypertension. Resting systolic and diastolic blood pressure and/or use of hypertension medications in the model did not explain the difference in heart size between T2DM men and controls in the current study. To investigate whether our use of mixed methodology (either MRI or echocardiography) in controls might explain between-group differences in measured heart size, we ran the model again in only subjects with MRI-measured hearts (which included all with T2DM and a majority of controls) and saw a similar reduction of cardiac mass in T2DM males, trending toward significance, and no difference in women. Interestingly, a sex-specific difference in cardiac muscle mass is consistent with the more careful kinetic studies of protein synthesis and catabolism. One such study by Pereira et al. (37) indicated that, in men with diabetes, fasting levels of insulin were associated with a blunted rate of protein synthesis while catabolic rates remained unchanged. This kinetic imbalance toward atrophy was not seen in women with diabetes compared with controls (37). A sex-dependent impairment of protein metabolism in the insulin-resistant state is a possible mechanistic explanation for the differences in cardiac mass observed in the current study. The notion that diabetes impairs protein kinetics (30), and that insulin may alter protein synthesis in a tissue-specific manner (6), also agrees with our observed reductions in muscle mass in T2DM and underscores the need for further mechanistic studies in this intriguing field of study.
The findings of this study contribute to current understanding of body composition and specifically the mass of high-metabolic-rate organs in persons with diabetes. The race-specific outcomes are also novel, adding a depth of body composition assessment that extends to organ-specific mass and may aid in understanding the unique metabolic profile of diabetes in both Caucasian and African-American subjects. Whether these race-dependent differences in organ mass within diabetic subjects have direct metabolic or clinical implications requires further exploration.
A primary limitation of this cross-sectional study is that body weight and fat mass were significantly lower in the control group compared with T2DM subjects. It is possible that mathematically adjusting for the difference in body size or fat mass between T2DM and controls may not entirely or correctly compensate for differences in organ and tissue masses. The ideal comparison group for this analysis would be metabolically healthy obese subjects with similar fat mass; however, this study provides the best available answers to the question of how the diabetic condition affects lean and organ tissue masses by comparison with healthy controls. Using regression modeling, we statistically adjusted for body weight, height, age, and sex differences, confirmed that skeletal muscle increases linearly with increasing body weight and fat mass across a healthy sample in this BMI range, and still found significant diabetes-related lean tissue and organ mass differences compared with healthy controls. As a convenience sample with data collected over a range of time, another limitation of our control group was that heart masses were quantified by either echocardiography or MRI; however, measurement method did not appear to influence between-group differences. Although the comparison groups were similar with regards to race, sex, and age, both contained a relatively small sample of African-American men. The novel body composition differences elucidated in this study, while appearing to support known race- and diabetes-related differences in resting energy expenditure, need to be accompanied by measurements that would link the differences in organ mass to the known metabolic rate variance between races and diabetes groups. Also, conversion from MRI volume to mass was calculated using assumed organ/tissue density values developed from reference man (46); it is unknown whether these tissue densities apply across races and to the diabetic state. Future studies should extend beyond mass measurements to include tissue density and fatty infiltration of organs to answer important questions of how organ mass and composition affect metabolism in diabetes. A final limitation of this study is that daily physical activity was not assessed across all groups and could not be used in the statistical models. Physical conditioning is likely to have differed between groups and may explain some of the variance observed, particularly in skeletal muscle mass.
Diabetes is a metabolic condition associated with significant changes in body composition. The overall decrease in LBM and its primary constituent, skeletal muscle, appears to be slightly offset by increases in some of the higher-metabolic-rate organs. Although some of the differences in organ size in the diabetic state appear uniformly across sex and race, the characterization of these specific groups allows for identification of unique attributes that may lead to improved therapeutic treatment for diabetes.
GRANTS
This work was supported in part by National Institutes of Health Grants RO1-HL-70298, PO1-DK-42618 (Project 4, Cores A and C); P30–26687, P30-DK-46204, and RR-024156.
DISCLOSURES
Each author declared that she or he has no conflict of financial or personal interests in any company or organization sponsoring this study.
AUTHOR CONTRIBUTIONS
Author contributions: L.E.D., S.H., J.T., L.B., and D.G. analyzed data; L.E.D. prepared figures; L.E.D., D.E.K., S.H., J.T., F.X.P.-S., and D.G. drafted manuscript; L.E.D., D.E.K., S.H., J.T., A.B., and D.G. edited and revised manuscript; L.E.D., D.E.K., S.H., J.T., F.X.P.-S., L.B., A.B., and D.G. approved final version of manuscript; S.H. and D.G. conception and design of research.
REFERENCES
- 1.Albright A, Franz M, Hornsby G, Kriska A, Marrero D, Ullrich I, Verity LS. American College of Sports Medicine position stand. Exercise and type 2 diabetes. Med Sci Sports Exerc 32: 1345–1360, 2000 [DOI] [PubMed] [Google Scholar]
- 2.Azuma K, Heilbronn LK, Albu JB, Smith SR, Ravussin E, Kelley DE. Adipose tissue distribution in relation to insulin resistance in type 2 diabetes mellitus. Am J Physiol Endocrinol Metab 293: E435–E442, 2007 [DOI] [PMC free article] [PubMed] [Google Scholar]
- 3.Banerji MA, Chaiken RL, Gordon D, Kral JG, Lebovitz HE. Does intra-abdominal adipose tissue in black men determine whether NIDDM is insulin-resistant or insulin-sensitive? Diabetes 44: 141–146, 1995 [DOI] [PubMed] [Google Scholar]
- 4.Bitz C, Toubro S, Larsen TM, Harder H, Rennie KL, Jebb SA, Astrup A. Increased 24-h energy expenditure in type 2 diabetes. Diabetes Care 27: 2416–2421, 2004 [DOI] [PubMed] [Google Scholar]
- 5.Bogardus C, Taskinen MR, Zawadzki J, Lillioja S, Mott D, Howard BV. Increased resting metabolic rates in obese subjects with non-insulin-dependent diabetes mellitus and the effect of sulfonylurea therapy. Diabetes 35: 1–5, 1986 [DOI] [PubMed] [Google Scholar]
- 6.Boirie Y, Short KR, Ahlman B, Charlton M, Nair KS. Tissue-specific regulation of mitochondrial and cytoplasmic protein synthesis rates by insulin. Diabetes 50: 2652–2658, 2001 [DOI] [PubMed] [Google Scholar]
- 7.Bozzetto L, Prinster A, Mancini M, Giacco R, De Natale C, Salvatore M, Riccardi G, Rivellese AA, Annuzzi G. Liver fat in obesity: role of type 2 diabetes mellitus and adipose tissue distribution. Eur J Clin Invest 41: 39–44, 2011 [DOI] [PubMed] [Google Scholar]
- 8.Colberg SR, Sigal RJ, Fernhall B, Regensteiner JG, Blissmer BJ, Rubin RR, Chasan-Taber L, Albright AL, Braun B. Exercise and type 2 diabetes: the American College of Sports Medicine and the American Diabetes Association: joint position statement. Diabetes Care 33: e147–e167, 2010 [DOI] [PMC free article] [PubMed] [Google Scholar]
- 9.Cortez-Pinto H, Camilo ME. Non-alcoholic fatty liver disease/non-alcoholic steatohepatitis (NAFLD/NASH): diagnosis and clinical course. Best Pract Res Clin Gastroenterol 18: 1089–1104, 2004 [DOI] [PubMed] [Google Scholar]
- 10.Devereux RB, Reichek N. Echocardiographic determination of left ventricular mass in man. Anatomic validation of the method. Circulation 55: 613–618, 1977 [DOI] [PubMed] [Google Scholar]
- 11.Devereux RB, Roman MJ, Paranicas M, O'Grady MJ, Lee ET, Welty TK, Fabsitz RR, Robbins D, Rhoades ER, Howard BV. Impact of diabetes on cardiac structure and function: the strong heart study. Circulation 101: 2271–2276, 2000 [DOI] [PubMed] [Google Scholar]
- 12.Dong H, Lu F, Wang N, Zou X, Rao J. Type 2 diabetic patients with non-alcoholic fatty liver disease exhibit significant haemorheological abnormalities. Frontiers Med 5: 288–293, 2011 [DOI] [PubMed] [Google Scholar]
- 13.Egger A, Niederseer D, Diem G, Finkenzeller T, Ledl-Kurkowski E, Forstner R, Pirich C, Patsch W, Weitgasser R, Niebauer J. Different types of resistance training in patients with type 2 diabetes mellitus: effects on glycemic control, muscle mass and strength. Eur J Prevent Cardiol 20: 1051–1060, 2013 [DOI] [PubMed] [Google Scholar]
- 14.Fontvieille AM, Lillioja S, Ferraro RT, Schulz LO, Rising R, Ravussin E. Twenty-four-hour energy expenditure in Pima Indians with type 2 (non-insulin-dependent) diabetes mellitus. Diabetologia 35: 753–759, 1992 [DOI] [PubMed] [Google Scholar]
- 15.Gallagher D, Albu J, He Q, Heshka S, Boxt L, Krasnow N, Elia M. Small organs with a high metabolic rate explain lower resting energy expenditure in African American than in white adults. Am J Clin Nutr 83: 1062–1067, 2006 [DOI] [PMC free article] [PubMed] [Google Scholar]
- 16.Gallagher D, Belmonte D, Deurenberg P, Wang Z, Krasnow N, Pi-Sunyer FX, Heymsfield SB. Organ-tissue mass measurement allows modeling of REE and metabolically active tissue mass. Am J Physiol Endocrinol Metab 275: E249–E258, 1998 [DOI] [PubMed] [Google Scholar]
- 17.Gallagher D, Kovera AJ, Clay-Williams G, Agin D, Leone P, Albu J, Matthews DE, Heymsfield SB. Weight loss in postmenopausal obesity: no adverse alterations in body composition and protein metabolism. Am J Physiol Endocrinol Metab 279: E124–E131, 2000 [DOI] [PubMed] [Google Scholar]
- 18.Gannon B, DiPietro L, Poehlman ET. Do African Americans have lower energy expenditure than Caucasians? Int J Obes Relat Metab Disord 24: 4–13, 2000 [DOI] [PubMed] [Google Scholar]
- 19.Gougeon R, Morais JA, Chevalier S, Pereira S, Lamarche M, Marliss EB. Determinants of whole-body protein metabolism in subjects with and without type 2 diabetes. Diabetes Care 31: 128–133, 2008 [DOI] [PubMed] [Google Scholar]
- 20.Heckbert SR, Post W, Pearson GD, Arnett DK, Gomes AS, Jerosch-Herold M, Hundley WG, Lima JA, Bluemke DA. Traditional cardiovascular risk factors in relation to left ventricular mass, volume, and systolic function by cardiac magnetic resonance imaging: the Multiethnic Study of Atherosclerosis. J Am Coll Cardiol 48: 2285–2292, 2006 [DOI] [PMC free article] [PubMed] [Google Scholar]
- 21.Jones RS. The weight of the heart and its chambers in hypertensive cardiovascular disease with and without failure. Circulation 7: 357–369, 1953 [DOI] [PubMed] [Google Scholar]
- 22.Katz J, Whang J, Boxt LM, Barst RJ. Estimation of right ventricular mass in normal subjects and in patients with primary pulmonary hypertension by nuclear magnetic resonance imaging. J Am Coll Cardiol 21: 1475–1481, 1993 [DOI] [PubMed] [Google Scholar]
- 23.Kelley DE. Skeletal muscle triglycerides: an aspect of regional adiposity and insulin resistance. Ann NY Acad Sci 967: 135–145, 2002 [PubMed] [Google Scholar]
- 24.Kelley DE, McKolanis TM, Hegazi RA, Kuller LH, Kalhan SC. Fatty liver in type 2 diabetes mellitus: relation to regional adiposity, fatty acids, and insulin resistance. Am J Physiol Endocrinol Metab 285: E906–E916, 2003 [DOI] [PubMed] [Google Scholar]
- 25.Kwon HR, Han KA, Ku YH, Ahn HJ, Koo BK, Kim HC, Min KW. The effects of resistance training on muscle and body fat mass and muscle strength in type 2 diabetic women. Korean Diabetes J 34: 101–110, 2010 [DOI] [PMC free article] [PubMed] [Google Scholar]
- 26.Kwon YM, Oh SW, Hwang SS, Lee C, Kwon H, Chung GE. Association of nonalcoholic fatty liver disease with components of metabolic syndrome according to body mass index in Korean adults. Am J Gastroenterol 107: 1852–1858, 2012 [DOI] [PubMed] [Google Scholar]
- 27.Lee S, Kuk JL, Davidson LE, Hudson R, Kilpatrick K, Graham TE, Ross R. Exercise without weight loss is an effective strategy for obesity reduction in obese individuals with and without type 2 diabetes. J Appl Physiol 99: 1220–1225, 2005 [DOI] [PubMed] [Google Scholar]
- 28.Lieb W, Xanthakis V, Sullivan LM, Aragam J, Pencina MJ, Larson MG, Benjamin EJ, Vasan RS. Longitudinal tracking of left ventricular mass over the adult life course: clinical correlates of short- and long-term change in the framingham offspring study. Circulation 119: 3085–3092, 2009 [DOI] [PMC free article] [PubMed] [Google Scholar]
- 29.Luke A, Dugas L, Kramer H. Ethnicity, energy expenditure and obesity: are the observed black/white differences meaningful? Curr Opin Endocrinol Diabetes Obesity 14: 370–373, 2007 [DOI] [PubMed] [Google Scholar]
- 30.Moller N, Nair KS. Diabetes and protein metabolism. Diabetes 57: 3–4, 2008 [DOI] [PubMed] [Google Scholar]
- 31.Morley JE. Diabetes, sarcopenia, frailty. Clin Geriatr Med 24: 455–469, 2008 [DOI] [PubMed] [Google Scholar]
- 32.Nazare JA, Smith JD, Borel AL, Haffner SM, Balkau B, Ross R, Massien C, Almeras N, Despres JP. Ethnic influences on the relations between abdominal subcutaneous and visceral adiposity, liver fat, and cardiometabolic risk profile: the International Study of Prediction of Intra-Abdominal Adiposity and Its Relationship With Cardiometabolic Risk/Intra-Abdominal Adiposity. Am J Clin Nutr 96: 714–726, 2012 [DOI] [PubMed] [Google Scholar]
- 33.North KE, Graff M, Franceschini N, Reiner AP, Feitosa MF, Carr JJ, Gordon-Larsen P, Wojczynski MK, Borecki IB. Sex and race differences in the prevalence of fatty liver disease as measured by computed tomography liver attenuation in European American and African American participants of the NHLBI family heart study. Eur J Gastroenterol Hepatol 24: 9–16, 2012 [DOI] [PMC free article] [PubMed] [Google Scholar]
- 34.Palmieri V, Bella JN, Arnett DK, Liu JE, Oberman A, Schuck MY, Kitzman DW, Hopkins PN, Morgan D, Rao DC, Devereux RB. Effect of type 2 diabetes mellitus on left ventricular geometry and systolic function in hypertensive subjects: Hypertension Genetic Epidemiology Network (HyperGEN) study. Circulation 103: 102–107, 2001 [DOI] [PubMed] [Google Scholar]
- 35.Park SW, Goodpaster BH, Lee JS, Kuller LH, Boudreau R, de Rekeneire N, Harris TB, Kritchevsky S, Tylavsky FA, Nevitt M, Cho YW, Newman AB. Excessive loss of skeletal muscle mass in older adults with type 2 diabetes. Diabetes Care 32: 1993–1997, 2009 [DOI] [PMC free article] [PubMed] [Google Scholar]
- 36.Park SW, Goodpaster BH, Strotmeyer ES, Kuller LH, Broudeau R, Kammerer C, de Rekeneire N, Harris TB, Schwartz AV, Tylavsky FA, Cho YW, Newman AB. Accelerated loss of skeletal muscle strength in older adults with type 2 diabetes: the health, aging, and body composition study. Diabetes Care 30: 1507–1512, 2007 [DOI] [PubMed] [Google Scholar]
- 37.Pereira S, Marliss EB, Morais JA, Chevalier S, Gougeon R. Insulin resistance of protein metabolism in type 2 diabetes. Diabetes 57: 56–63, 2008 [DOI] [PubMed] [Google Scholar]
- 38.Rejeski WJ, Ip EH, Bertoni AG, Bray GA, Evans G, Gregg EW, Zhang Q, Look ARG. Lifestyle change and mobility in obese adults with type 2 diabetes. N Engl J Med 366: 1209–1217, 2012 [DOI] [PMC free article] [PubMed] [Google Scholar]
- 39.Ryan DH, Espeland MA, Foster GD, Haffner SM, Hubbard VS, Johnson KC, Kahn SE, Knowler WC, Yanovski SZ. Look AHEAD (Action for Health in Diabetes): design and methods for a clinical trial of weight loss for the prevention of cardiovascular disease in type 2 diabetes. Control Clin Trials 24: 610–628, 2003 [DOI] [PubMed] [Google Scholar]
- 40.Ryysy L, Hakkinen AM, Goto T, Vehkavaara S, Westerbacka J, Halavaara J, Yki-Jarvinen H. Hepatic fat content and insulin action on free fatty acids and glucose metabolism rather than insulin absorption are associated with insulin requirements during insulin therapy in type 2 diabetic patients. Diabetes 49: 749–758, 2000 [DOI] [PubMed] [Google Scholar]
- 41.Sahn DJ, DeMaria A, Kisslo J, Weyman A. Recommendations regarding quantitation in M-mode echocardiography: results of a survey of echocardiographic measurements. Circulation 58: 1072–1083, 1978 [DOI] [PubMed] [Google Scholar]
- 42.Sakkas GK, Kent-Braun JA, Doyle JW, Shubert T, Gordon P, Johansen KL. Effect of diabetes mellitus on muscle size and strength in patients receiving dialysis therapy. Am J Kidney Dis 47: 862–869, 2006 [DOI] [PubMed] [Google Scholar]
- 43.Snijder MB, Dekker JM, Visser M, Bouter LM, Stehouwer CD, Yudkin JS, Heine RJ, Nijpels G, Seidell JC. Trunk fat and leg fat have independent and opposite associations with fasting and postload glucose levels: the Hoorn study. Diabetes Care 27: 372–377, 2004 [DOI] [PubMed] [Google Scholar]
- 44.Snijder MB, Dekker JM, Visser M, Yudkin JS, Stehouwer CD, Bouter LM, Heine RJ, Nijpels G, Seidell JC. Larger thigh and hip circumferences are associated with better glucose tolerance: the Hoorn study. Obes Res 11: 104–111, 2003 [DOI] [PubMed] [Google Scholar]
- 45.Snijder MB, Visser M, Dekker JM, Goodpaster BH, Harris TB, Kritchevsky SB, De Rekeneire N, Kanaya AM, Newman AB, Tylavsky FA, Seidell JC. Low subcutaneous thigh fat is a risk factor for unfavourable glucose and lipid levels, independently of high abdominal fat. The Health ABC Study. Diabetologia 48: 301–308, 2005 [DOI] [PubMed] [Google Scholar]
- 46.Snyder WS, Cooke MJ, Mnassett ES, Larhansen LT, Howells GP, Tipton IH. Report of the Task Group on Reference Man. Oxford, UK: Pergamon, 1975 [Google Scholar]
- 47.Song MY, Ruts E, Kim J, Janumala I, Heymsfield S, Gallagher D. Sarcopenia and increased adipose tissue infiltration of muscle in elderly African American women. Am J Clin Nutr 79: 874–880, 2004 [DOI] [PubMed] [Google Scholar]
- 48.Torbenson M, Chen YY, Brunt E, Cummings OW, Gottfried M, Jakate S, Liu YC, Yeh MM, Ferrell L. Glycogenic hepatopathy: an underrecognized hepatic complication of diabetes mellitus. Am J Surg Pathol 30: 508–513, 2006 [DOI] [PubMed] [Google Scholar]
- 49.Wadden TA, West DS, Delahanty L, Jakicic J, Rejeski J, Williamson D, Berkowitz RI, Kelley DE, Tomchee C, Hill JO, Kumanyika S. The Look AHEAD study: a description of the lifestyle intervention and the evidence supporting it. Obesity (Silver Spring) 14: 737–752, 2006 [DOI] [PMC free article] [PubMed] [Google Scholar]
- 50.Weyer C, Bogardus C, Pratley RE. Metabolic factors contributing to increased resting metabolic rate and decreased insulin-induced thermogenesis during the development of type 2 diabetes. Diabetes 48: 1607–1614, 1999 [DOI] [PubMed] [Google Scholar]
- 51.Wirta O, Pasternack A, Laippala P, Turjanmaa V. Glomerular filtration rate and kidney size after six years disease duration in non-insulin-dependent diabetic subjects. Clin Nephrol 45: 10–17, 1996 [PubMed] [Google Scholar]
- 52.Yki-Jarvinen H, Koivisto VA. Effects of body composition on insulin sensitivity. Diabetes 32: 965–969, 1983 [DOI] [PubMed] [Google Scholar]