Abstract
Recognition and localization of a sound are the major functions of the auditory system. In real situations, the listener and different degrees of reverberation transform the signal between the source and the ears. The present study was designed to provide these transformations and examine their influence on neural responses. Using the virtual auditory space (VAS) method to create anechoic and moderately and highly reverberant environments, we found the following: 1) In reverberation, azimuth tuning was somewhat degraded with distance whereas the direction of azimuth tuning remained unchanged. These features remained unchanged in the anechoic condition. 2) In reverberation, azimuth tuning and envelope synchrony were degraded most for neurons with low best frequencies and least for neurons with high best frequencies. 3) More neurons showed envelope synchrony to binaural than to monaural stimulation in both anechoic and reverberant environments. 4) The percentage of envelope-coding neurons and their synchrony decreased in reverberation with distance, whereas it remained constant in the anechoic condition. 5) At far distances, for both binaural and monaural stimulation, the neural gain in reverberation could be as high as 30 dB and as much as 10 dB higher than those in the anechoic condition. 6) The majority of neurons were able to code both envelope and azimuth in all of the environments. This study provides a foundation for understanding the neural coding of azimuth and envelope synchrony at different distances in reverberant and anechoic environments. This is necessary to understand how the auditory system processes “where” and “what” information in real environments.
Keywords: auditory system, inferior colliculus, reverberation, spatial hearing
recognition and localization of a sound are the major functions of the auditory system. A key feature for recognition is the amplitude modulation (AM) envelopes present in natural sounds (Plomp 1983). Key features for localization are interaural time (ITD) and level (ILD) differences and spectral cues that depend on sound source locations (Blauert 1997; Rayleigh 1907).
In real situations, the listener and the environment transform the signal between the source and the ears. Even in the anechoic condition, the sound is altered by the head and body. These properties can be derived from the head-related transfer functions (HRTFs; Wightman and Kistler 1989). In a reverberant environment there are additional alterations, and these alterations can be derived from the binaural room transfer functions (BRTFs) (Zahorik 2002). Reverberation degrades both ITD and ILD and modulation depth.
Here we study neural coding of location and AM envelopes in real reverberant environments, topics for which few published data exist. Furthermore, with few exceptions (Kuwada et al. 2012; Nelson and Takahashi 2010), no studies have simultaneously investigated location coding and envelope processing even though the two tasks occur simultaneously in natural settings. Nelson and Takahashi (2010), in an elegant series of behavioral and neural studies, used location cues and envelopes in a precedence effect paradigm. They showed that envelopes were necessary for the owl and its neurons to show location sensitivity. However, unlike the present study they used a single simulated echo without reverberation; thus their study does not address the degrading effect of reverberation.
The virtual auditory space (VAS) method allowed us to transition from binaural to monaural stimulation and to alter cues that would be difficult, if not impossible, in traditional (non-VAS) sound field experiments. The VAS method has proven to be a valid method for the study of spatial sensitivity in humans (Kulkarni and Colburn 1998; Wightman and Kistler 1989) and in neurons (Behrend et al. 2004; Campbell et al. 2006; Keller et al. 1998). The goal of the present study was to simultaneously investigate location (“where”) and AM envelope (“what”) coding in real environments in neurons of the inferior colliculus (IC) of the unanesthetized rabbit with VAS stimuli.
METHODS
This study was approved by the University of Connecticut Health Center Animal Care Committee and was conducted according to National Institutes of Health guidelines. Neural recordings were performed in the left IC (confirmed by histology of electrolytic lesions) of a female Dutch-Belted rabbit (2.2 kg). The procedures of the present study are the same as those reported previously (Kuwada et al. 2012) and are only briefly outlined here.
Surgical and recording procedures.
Attaching a head restraint appliance, performing a craniotomy for electrode insertion, and making a custom ear mold were all performed with aseptic techniques, acepromazine sedation, and isoflurane anesthesia.
Recording procedures and data collection.
For the daily neural recordings the rabbit's head was fixed by mating the head appliance to a horizontal bar with 6–32 threaded socket-head screws. To eliminate possible pain or discomfort during the penetration of the electrode, a topical anesthetic (bupivacaine) was applied to the dura for ∼5 min and then removed by aspiration. With these procedures, the rabbit remained still for a period of ≥2 h, an important requirement for neural recording. At the end of a daily session the craniotomy was flushed with chlorhexidine and covered with dental impression compound (Reprosil).
Action potentials were recorded extracellularly with custom-made tungsten-in-glass microelectrodes. The recordings were from neurons with the criterion that spikes with interspike intervals <0.95 ms comprise <1% of the total spikes (similar to Slee and Young 2013).
Virtual auditory space stimulus generation.
The rabbits' HRTFs were measured in our anechoic chamber (anechoic between 0.11 and 200 kHz). BRTFs were measured in our moderately and highly reverberant rooms. The reverberation time (T60) of each room was determined for octave bands centered at 0.25–10 kHz. The T60 averaged across center frequency was 0.92 and 2.2 s, respectively, for the two rooms. HRTFs and BRTFs were measured at nine distances in successive factors of ✓2, i.e., 10, 14, 20, 28… 160 cm, and 21 azimuths (±150° in 15° steps) all at 0° elevation and all done in the unanesthetized state. The procedures for measuring HRTFs are described by Kim et al. (2010).
As source signals, we used sinusoidally amplitude modulated (SAM) and unmodulated 1-octave-wide noise bands centered at the neuron's best frequency. The modulation frequency was 2 Hz up to 512 Hz in octave steps. We kept the modulation frequency lower than 12% of the center frequency of the carrier noise band. The 12% corresponds to the difference between the upper cutoff and center frequencies of a third octave band filter that approximates auditory filtering (Moore 1997). Modulation depth was 70–100%. VAS stimuli were created by filtering the source signals with the rabbit's HRTFs and BRTFs for each ear, each sound-source location, and each acoustic environment. From the transfer functions we derived the acoustic modulation transfer function (MTF) of the system comprising the rabbit and sound source in a specific environment. These VAS stimuli were delivered to each ear through a Beyer DT-770 earphone coupled to a sound tube embedded in a custom-fitted ear mold to form a closed system.
The sounds were presented to the rabbit with TDT System 3 hardware and custom software written in MATLAB. Some early code for System 2 that was provided by Marcel van der Heijden (Utrecht University, Utrecht, The Netherlands) was integrated into our current software by one of the authors (B. Bishop).
Data analysis.
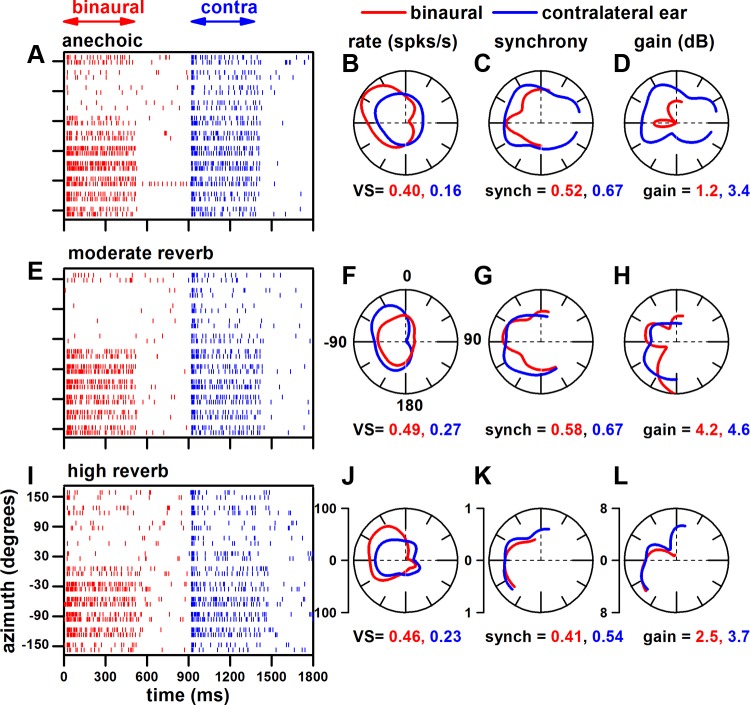
Our general approach to measuring azimuth and envelope coding of IC neurons in different acoustic environments was as follows. We first determined the unit's best frequency by delivering tone bursts in random order (0.25–30 kHz in 1/3-octave steps), typically at 40 dB SPL. Tones were presented sequentially to both ears, the ipsilateral ear alone, and the contralateral ear alone. For the neuron in Fig. 1, its best frequency was 12.6 kHz. To determine the unit's threshold for VAS stimulation, we set the distance to 80 cm and the azimuth to −75° (based on Kuwada et al. 2011) and varied the stimulus level of an octave band noise centered at the neuron's best frequency from 0 to 70 dB SPL in 10-dB steps, presented randomly. Noise bands were presented sequentially to both ears, the ipsilateral ear alone, and the contralateral ear alone. We then delivered VAS stimuli typically at a level 30 dB above its threshold. For the neuron in Fig. 1, this level was 40 dB SPL. We determined the neuron's best azimuth by varying the azimuths between ±150° in 30° steps (total of 11 azimuths) to binaural and contralateral ear-alone stimulation at a distance of 80 cm. The azimuths were presented in random order, whereas the binaural and monaural stimulations were sequential. For the neuron in Fig. 1, its best azimuth was −60°. We then determined its MTF to modulation frequencies from 2 to 512 Hz in 1-octave steps at the unit's best azimuth. For this neuron, its best modulation frequency for both rate and synchrony was 128 Hz. This best modulation frequency was then used to investigate the neuron's coding of azimuth and envelope in our anechoic and moderately and highly reverberant environments (Fig. 1); shown are the dot rasters (Fig. 1, A, E, and I) and the corresponding polar plots of rate (Fig. 1, B, F, and J), synchrony to the envelope (Fig. 1, C, G, and K), and neural modulation gain (Fig. 1, D, H, and L) for the three acoustic environments. The responses to binaural stimulation are depicted as red in Fig 1 and those to monaural stimulation as blue. The polar plots were interpolated and smoothed over a ±180° range. From the smoothed rate-azimuth function we derived the following measures: vector strength, vector angle, and half-width. Vector strength is a measure of the sharpness of azimuth tuning, and vector angle is a measure of the direction of azimuth tuning. Vector strength and vector angle were computed with the original definition of Goldberg and Brown (1969). Half-width is a common measure of the sharpness of azimuth tuning and was included to provide comparisons with other studies.
Fig. 1.
Illustration of our procedure using an example neuron. A, E, and I: dot rasters to binaural (red) and contralateral ear (blue) stimulation as a function of azimuth. Corresponding polar plots: firing rate [vector strength (VS); B, F, and J], synchrony to the envelope (C, G, and K), and neural modulation gain (D, H, and L). 0° and 180° are the azimuth position of the sound source directly in front of and in back of the rabbit, respectively; −90° the azimuth position facing the ear contralateral to the recording site; and 90° the azimuth position facing the ear ipsilateral to the recording site. The 3 rows represent the responses in the anechoic (A–D), moderately reverberant (E–H), and highly reverberant (I–L) environments. Best frequency = 12.6 kHz, carrier = 1-octave band noise centered at best frequency, modulation frequency = 128 Hz, modulation depth = 100%, level = 40 dB SPL, sound source distance = 80 cm.
The sharpness of azimuth tuning was quantified by vector strength. For the example neuron in Fig. 1, the rate plots indicate significant azimuth tuning in all three environments to both binaural and contralateral ear stimulation (Fig. 1, B, F, and J). In all environments, the azimuth tuning was sharper to binaural stimulation. Furthermore, there was enhanced azimuth tuning in the reverberant environments to both binaural and contralateral ear stimulation.
The synchrony to both binaural and monaural stimulation was predominantly in the contralateral sound field in all environments (Fig. 1, C, G, and K). Because the number of azimuths that displayed significant synchrony varied among neurons, we calculated the weighted mean synchrony for each neuron. The mean synchrony for each neuron was multiplied by the number of azimuths with significant synchrony divided by the total possible number of azimuths. This was computed separately for the contralateral (maximum no. of azimuths = 6) and ipsilateral (maximum no. of azimuths = 5) sound field (re: recording site). Shown are the weighted mean synchronies for the contralateral sound field.
Neural modulation gain (Fig. 1, D, H, and L) for contralateral ear stimulation was defined similar to that of Kim et al. (1990) and Joris and Yin (1992) as follows:
For binaural stimulation, we defined the neural gain by incorporating the relative contributions of the left and right ears that change across azimuths:
where
We determined weighted mean gain in the same way as weighted mean synchrony, and these are shown in Fig. 1, D, H, and L.
RESULTS
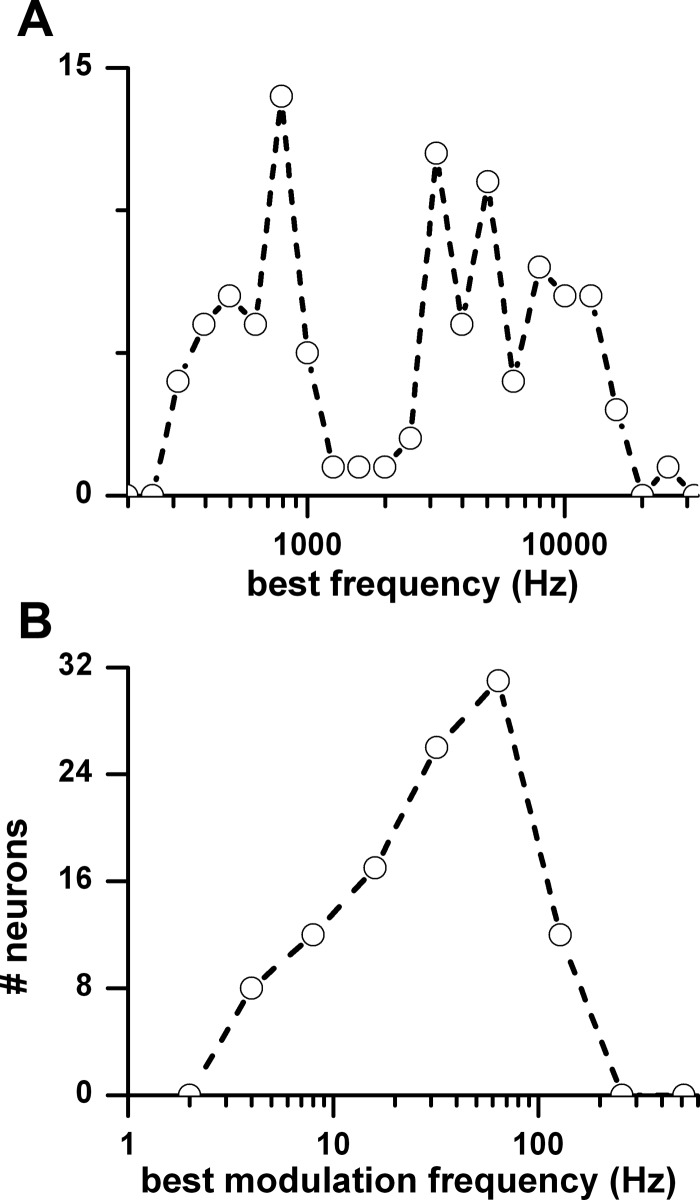
The results are based on 104 IC neurons. The best frequencies of these neurons were broadly distributed between 0.3 and 16 kHz (Fig. 2A). This range encompasses the rabbit's hearing range (Heffner and Masterton 1980). The peak of the synchrony MTF was defined as the best modulation frequency. The distribution of best modulation frequencies had a peak at 64 Hz (Fig. 2B).
Fig. 2.
A: distributions of best frequencies. B: distribution of best modulation frequencies (n = 106).
Azimuth tuning.
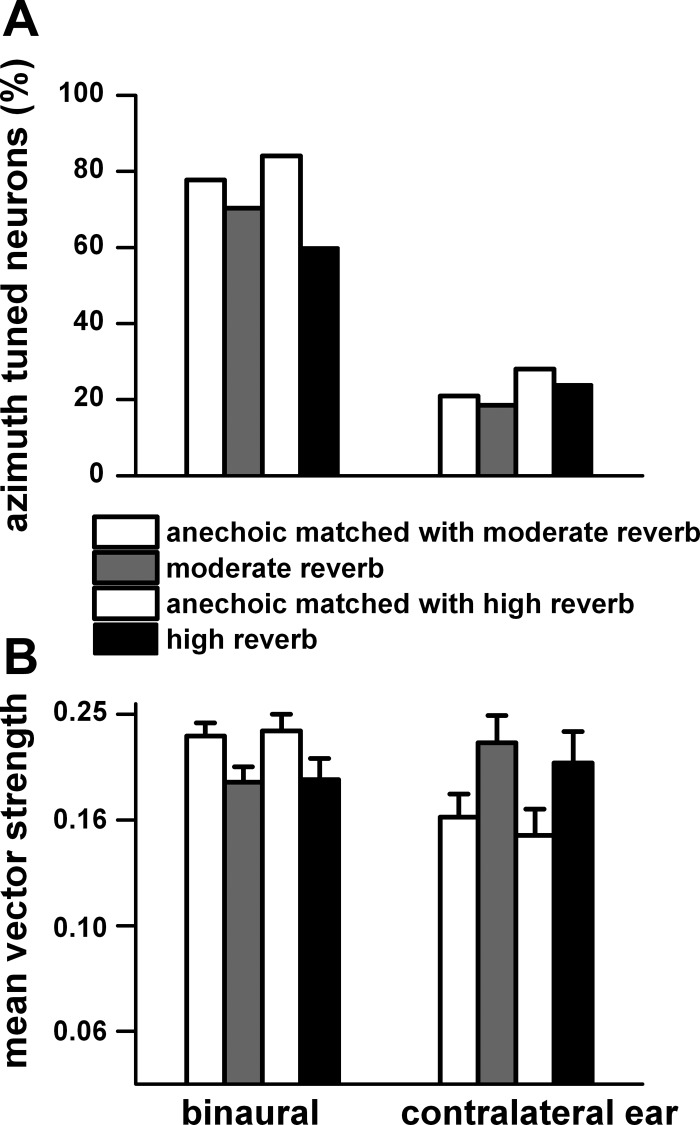
Because all neurons were not tested in all three environments, we compared separately the neurons tested in the anechoic environment matched with those tested in the moderately reverberant environment and those tested in the anechoic environment matched with those tested in the highly reverberant environment. The comparisons were made for the responses to sound source distance of 80 cm because this distance was tested in almost all neurons. Figure 3A shows the percentage of azimuth-tuned neurons as measured by significant vector strength (P < 0.001) to binaural and contralateral ear stimulation. Compared with the anechoic condition, under binaural stimulation the percentage of azimuth-tuned neurons decreased by 7% in the moderately reverberant environment and by 24% in the highly reverberant environment. Overall, the percentage of neurons that were azimuth tuned to contralateral ear stimulation was considerably less (∼60%) than that of those to binaural stimulation, and the effects of reverberation were small.
Fig. 3.
A: % azimuth-tuned neurons (P < 0.001) to binaural and contralateral ear stimulation for matched neurons in the anechoic and moderately reverberant and anechoic and highly reverberant environments. B: mean vector strength and SE for the neurons in A. Distance = 80 cm. Mean vector strength and SE were derived from the log of vector strength. Binaural stimulation: anechoic (n = 63) and moderate reverberation (n = 57); anechoic (n = 42) and high reverberation (n = 30). Contralateral ear stimulation: anechoic (n = 17) and moderate reverberation (n = 15); anechoic (n = 14) and high reverberation (n = 12).
The mean vector strength and standard error are shown in Fig. 3B for the neurons in Fig. 3A. To binaural stimulation, the vector strength in the anechoic environment was significantly larger (P < 0.05) than in moderately reverberant (t = 4.50, df = 57, P = 0.006) and highly reverberant (t = 2.97, df =26, P = 0.00004) environments. In contrast, to contralateral ear stimulation, the vector strength in the anechoic environment was significantly smaller than that in the moderately reverberant (t = 2.02, df = 7, P = 0.019) and highly reverberant (t = 2.77, df =5, P = 0.039) environments.
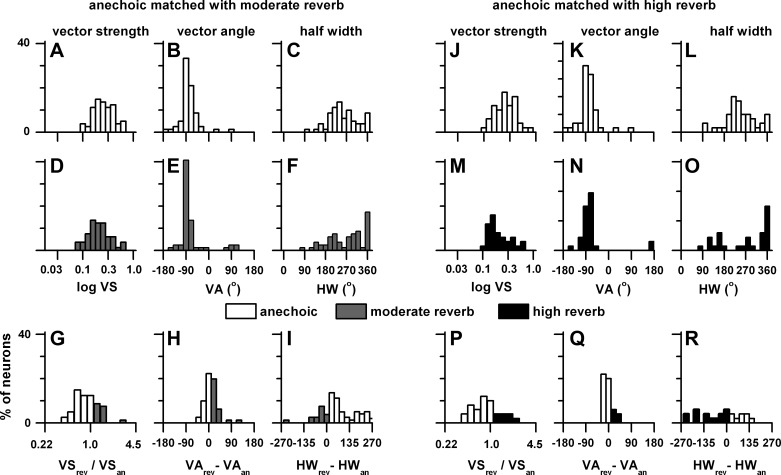
Because of the low number of neurons that were azimuth tuned to contralateral ear stimulation, in Fig. 4 we plot the distributions of vector strength, vector angle, and half-width to binaural stimulation only. Figure 4, A–I, compare the anechoic azimuth tuning (Fig. 4, A–C) with the same neurons tested in the moderately reverberant environment (Fig. 4, D–F). Only significant azimuth-tuned responses (vector strength P < 0.001) are plotted. Figure 4, G–I, represent comparisons between the azimuth tuning measures only for those that were significant in both environments. Figure 4, J–R, are in the same format but represent comparisons of azimuth tuning measured in the anechoic and highly reverberant environments.
Fig. 4.
Distributions of vector strength (VS), vector angle (VA), and half-width (HW) for neurons measured at a sound source distance of 80 cm that showed significant azimuth tuning (vector strength, P < 0.001). A–F: distributions of the 3 measures in the matched neurons in the anechoic and moderately reverberant conditions. J–O: distributions of the 3 measures in the matched neurons in the anechoic and highly reverberant conditions. G–I: comparisons of the 3 measures between the anechoic and moderately reverberant conditions. P–R: comparisons of the 3 measures between the anechoic and highly reverberant conditions. The sample size is stated in Fig. 3.
The distributions of vector strength (Fig. 4, A and D), vector angle (Fig. 4, B and E), and half-width (Fig. 4, C and F) were not significantly different between those measured in the anechoic and moderate reverberation environments [χ2 = 6.7 (VS), 10.3 (VA), 15.7 (HW), df = 18, P > 0.05].
We showed above (Fig. 3) that the mean vector strength of neurons tested in the anechoic environment was significantly larger than that of those in moderate reverberation. Consistent with this observation is the distribution of mean ratio of vector strength in the moderate reverberant relative to the anechoic environment (Fig. 4G). The ratio distribution indicates that more neurons had higher vector strengths in the anechoic environment compared with the moderately reverberant condition. Vector angles were concentrated in the contralateral sound field with a peak at −90° in both the anechoic and moderately reverberant environments. The difference in the mean vector angle between the anechoic and moderately reverberant conditions was not significant (t = 1.07, df = 51, P > 0.05) and supported by the distribution of differences in vector angle that was concentrated symmetrically about 0° (Fig. 4H). The distributions of half-widths displayed a wide range (75° to 365°). The distribution of the difference between the half-widths in the moderately reverberant and anechoic environments (Fig. 4I) indicates that the anechoic half-widths were narrower (mean = 234°) than those in moderate reverberation (mean = 314°), and this difference was marginally significant (t = 1.6, df = 51, P = 0.045).
The distributions of vector strength (Fig. 4, J and M) and vector angle (Fig. 4, K and N) were not significantly different between those measured in the anechoic and highly reverberant environments [χ2 = 20.9 (VS), 12.0 (VA), df = 18, P > 0.05], but the distribution of half-widths was significantly different (χ2 = 43.1, df = 18, P < 0.001). This significant difference was due to the dearth of half-widths between 180° and 270° in high reverberation and their abundance in the anechoic environment.
We showed above (Fig. 3) that the mean vector strength of neurons tested binaurally in the anechoic environment was significantly larger than those in high reverberation. Consistent with this observation is the distribution of mean ratio of vector strength in the high reverberant environment relative to the anechoic environment (Fig. 4P). The ratio distribution indicates that more neurons had higher vector strengths in the anechoic environment compared with the high reverberant condition. Like the moderately reverberant comparison (Fig. 4, B and E), the distributions of vector angle had peaks straddling −70° and −90° in both environments and the mean vector angles were not significantly different (t = 0.90, df = 27, P > 0.05). This is consistent with the observation that the distributions of the difference between vector angles in the highly reverberant and anechoic environments were clustered around 0°. Like the moderately reverberant environment (Fig. 4, C and F), the most prominent half-width in high reverberation occurred at 360° (Fig. 4O). The difference in the mean half-widths of anechoic and highly reverberant conditions was not significant (t = 0.69, df = 27, P > 0.05).
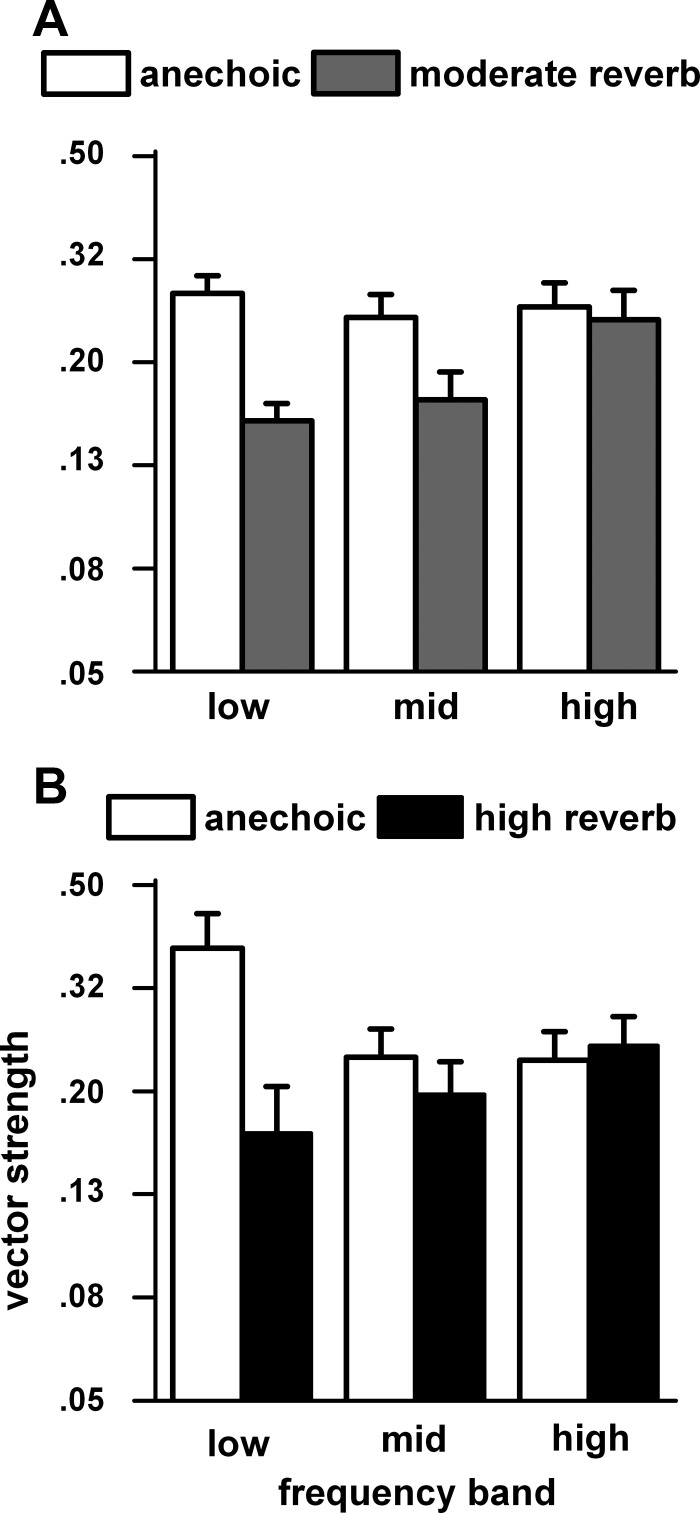
To determine the effects of noise band center frequency (set to each neuron's best frequency) on azimuth tuning, we first combined the responses measured at the two farthest distances (80 and 160 cm) to increase the population sample. If a neuron was tested at both distances, then only the 160 cm response was retained. We then divided the neurons based on their best frequency into three frequency bands: low (0.3–2.0 kHz), middle (2.1–6.2 kHz), and high (6.3–16.0 kHz). Figure 5A shows the vector strengths in these three bands for the anechoic and moderate reverberation matched neurons. Figure 5B shows the same comparisons for the anechoic and high reverberation matched neurons. In the moderately reverberant comparisons (Fig. 5A), the azimuth tuning in the anechoic condition remains relatively constant across frequency bands. In contrast, the azimuth tuning in the moderately reverberant condition is degraded most in the low frequency band and not degraded at all in the high frequency band. We used paired t-tests with Bonferroni corrections to compare anechoic and moderately reverberant vector strengths in the three frequency bands. The anechoic vector strength was significantly larger than those in moderate reverberation in the low frequency band (t = 7.65, df = 30, P < 0.00006) and the middle frequency band (t = 3.88, df = 19, P < 0.006) but not in the high frequency band (P > 0.05). The comparisons between anechoic and high reverberation (Fig. 5B) showed a similar pattern. The anechoic vector strength was significantly larger than those in high reverberation only in the low frequency band (t = 6.79, df = 6, P < 0.003).
Fig. 5.
Azimuth tuning for 3 frequency bands for matched neurons in the anechoic and moderately reverberant (A) and the anechoic and highly reverberant (B) environments. To increase the population sample the vector strengths at the 2 farthest distances (80 and 160 cm) were combined. If a neuron was tested at both distances, then only the 160 cm response was retained. The neurons were assigned to 1 of 3 carrier frequency bands (low: 0.3–2.0 kHz, middle: 2.1–6.2 kHz, and high: 6.3–16.0 kHz) based on their best frequency. Sample sizes: low band: anechoic (n = 42) and moderate reverberation (n = 36), anechoic (n = 22) and high reverberation (n = 8); middle band: anechoic (n = 31) and moderate reverberation (n = 23), anechoic (n = 25) and high reverberation (n = 13); high band: anechoic (n = 25) and moderate reverberation (n = 18), anechoic (n = 21) and high reverberation (n = 16).
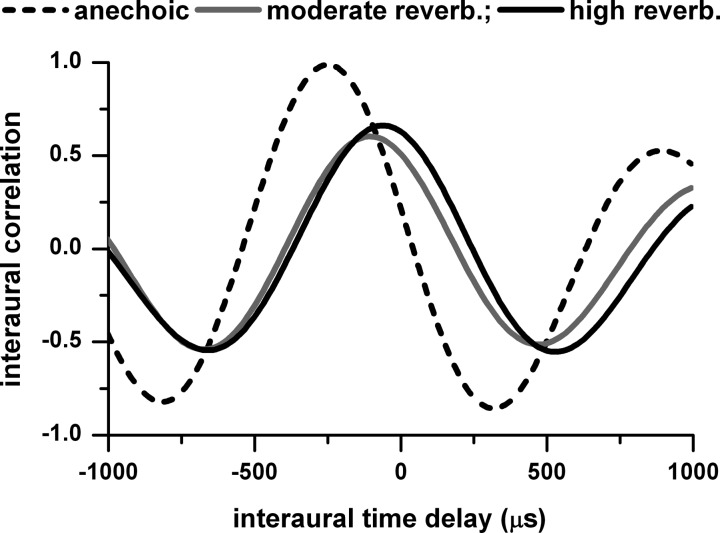
The significant loss in azimuth tuning in the low frequency band (Fig. 5) is consistent with the decorrelating effect of reverberation. Low-frequency neurons (<2,000 Hz) are sensitive to ITDs, and when interaural correlation is reduced the ITD sensitivity is reduced (Yin et al. 1987). Figure 6 shows the effect of reverberation on interaural correlation of a low-frequency signal (octave band noise centered at 791 Hz) at a sound source distance of 160 cm. In the anechoic condition the interaural correlation as a function of ITD reaches a maximum of nearly 1. However, in the moderately and highly reverberant conditions, the maximum interaural correlation is time shifted relative to the anechoic maximum and reduced to 0.66 or lower. The significant difference in the middle band between the anechoic and moderately reverberant conditions (Fig. 5A) may be partially explained by the reduced interaural correlation because the lower boundary of the middle band (∼1.5 kHz for a 2.1 kHz best frequency neuron) is within the frequency range of ITD-sensitive neurons in the rabbit (Kuwada et al. 2006).
Fig. 6.
Interaural correlation of acoustic waveforms measured at the 2 ears as a function of interaural time delay. The sound was an octave band noise centered at 791 Hz in the anechoic and moderately and highly reverberant environments. The sounds are from the head-related transfer functions (HRTFs) and binaural room transfer functions (BRTFs) measured in the same rabbit as the neural data. The 791 Hz is within the low band defined in Fig. 5. Sound source distance = 160 cm.
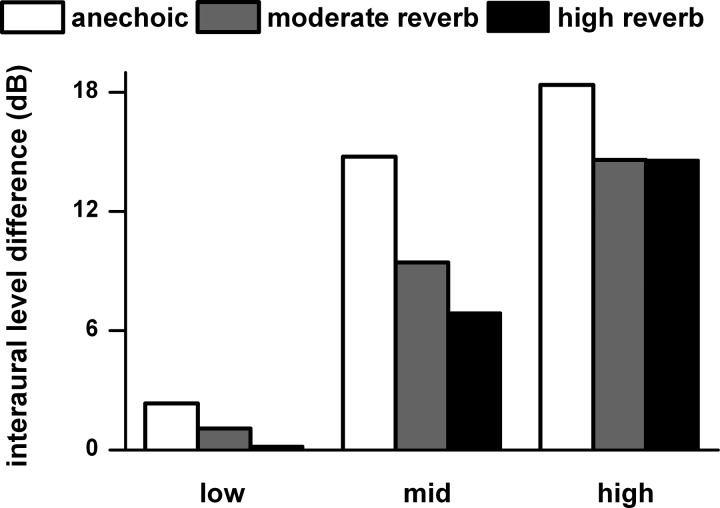
A second major binaural cue for azimuth tuning is the ILD. Figure 7 shows the mean ILD measured at −90° at a distance of 80 and 160 cm for the low, middle, and high bands (as defined in Fig. 5) in the anechoic, moderately reverberant, and highly reverberant environments. The ILD in each band was calculated from the average of 1/3-octave bands that spanned the limits of each band. As expected, the ILD increases with frequency band. However, the effect of reverberation on ILD was smallest in the high band, and this is the band where neural azimuth tuning was least affected by reverberation (Fig. 5). In the middle band, the reduced ILDs in reverberation (Fig. 7) along with a reduced interaural correlation (analogous to Fig. 6) may have contributed to the reduced azimuth tuning in this band (Fig. 5).
Fig. 7.
Interaural level differences (ILDs) in the acoustic waveforms measured at −90° averaged at distances of 80 and 160 cm for the low, middle, and high frequency bands (as defined in Fig. 5). The acoustic waveforms were derived from the HRTFs and BRTFs measured in the same rabbit as the neural data. The ILD for each of the low, middle, and high frequency bands was the average of the ILDs for a series of 1-octave band noise whose center frequencies varied in 1/3-octave steps spanning the limits of each of the 3 bands. Anechoic, moderately reverberant, and highly reverberant environments are shown.
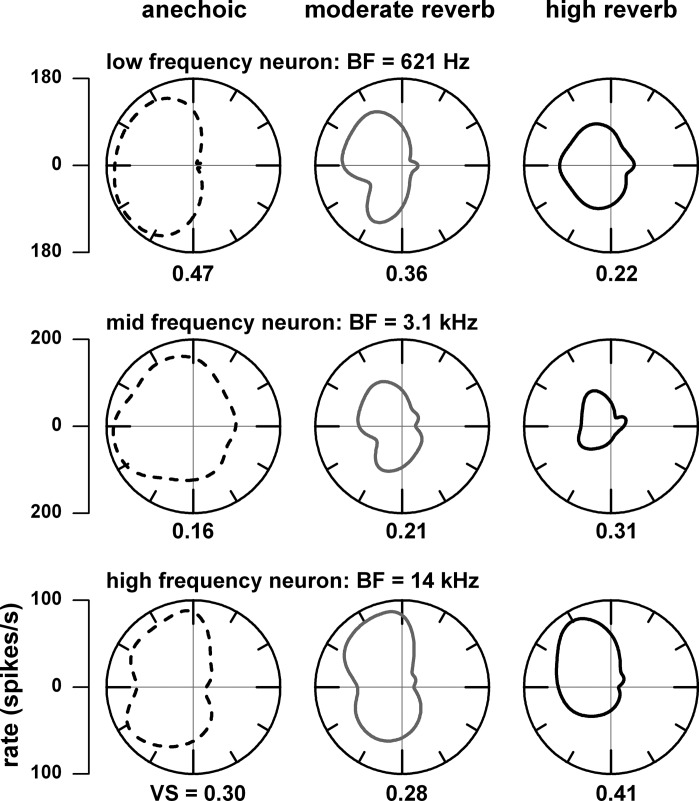
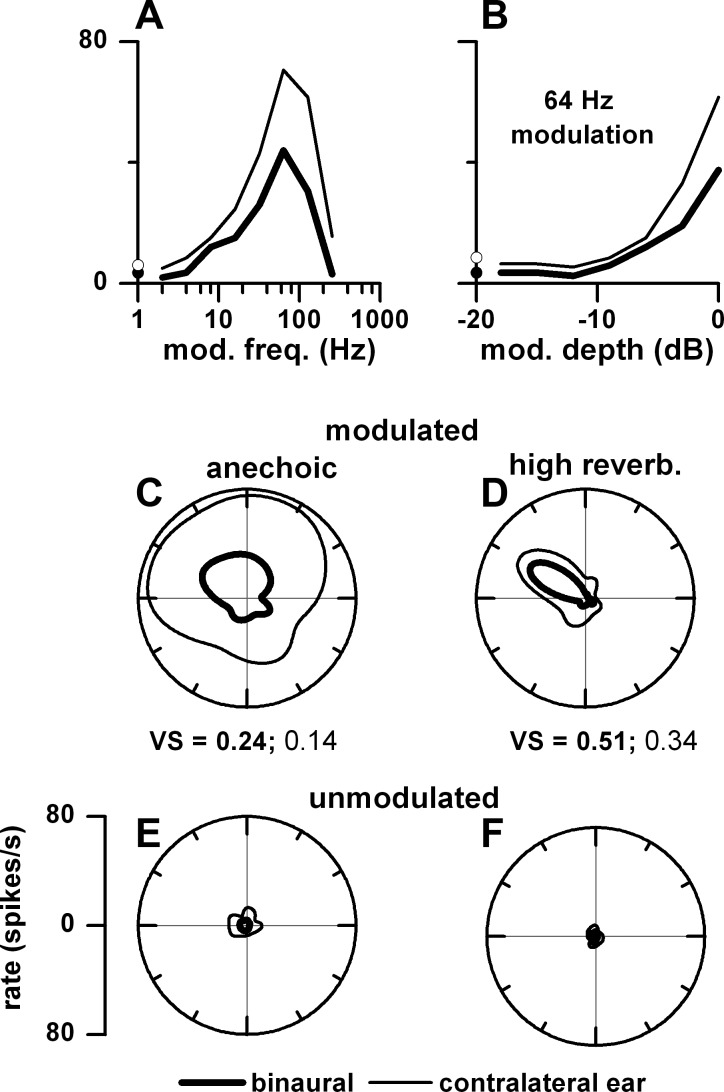
In a subset of neurons, we observed that azimuth tuning was sharper in reverberation (e.g., Fig. 1, F and J) than in the anechoic condition. Such neurons are identified when the ratio of vector strength in reverberation over the vector strength in anechoic is >1 (Fig. 4, G and P). This enhancement in reverberation was generally seen in neurons with middle and high best frequencies. Figure 8 provides examples of enhanced azimuth tuning in reverberation for a middle (Fig. 8, middle)- and high (Fig. 8, bottom)-best frequency neuron and decreased azimuth tuning for a low (Fig. 8, top)-best frequency neuron. A potential mechanism for enhanced azimuth tuning in reverberation is illustrated in Fig. 9 for a neuron with a best frequency of 3.1 kHz. This neuron showed an enhanced azimuth tuning (compare Fig. 9, D vs. C) to both binaural and contralateral ear stimulation when the stimulus was modulated. When the sound was unmodulated, the firing rates were negligible in both environments (Fig. 9, E and F), indicating that this neuron required envelope modulation for azimuth tuning. This neuron showed a band pass rate MTF (Fig. 9A) where the firing rate was higher to modulated noise (lines) than to unmodulated noise (dots) and higher to monaural than to binaural stimulation. At a modulation frequency at the peak (64 Hz), the neuron's firing rate systematically increased with modulation depth (Fig. 9B). In reverberation, the amount of modulation loss in the contralateral ear was greater when the sound source was in the ipsilateral sound field. This differential loss of modulation depth leads to a reduced firing rate in the ipsilateral sound field, and this creates the enhanced azimuth tuning for both binaural and monaural stimulation.
Fig. 8.
Examples of azimuth tuning in neurons with low (top), middle (middle), and high (bottom) best frequencies (BFs) measured in the anechoic (dashed lines, left) and moderately reverberant (gray lines, center), and highly reverberant (black lines, right) environments. Numerical labels represent vector strength (VS).
Fig. 9.
Mechanism for enhanced azimuth tuning in reverberation in an example neuron. A: rate modulation transfer function (MTF) to binaural (thick line) and contralateral ear (thin line) stimulation. Filled and open circles represent firing rates to unmodulated noise. B: firing rate as a function of modulation depth; 0 dB corresponds to 100% depth. C: azimuth tuning to modulated noise in the anechoic environment. D: azimuth tuning to modulated noise in the highly reverberant environment. E: azimuth tuning to unmodulated noise in the anechoic environment. F: azimuth tuning to unmodulated noise in the highly reverberant environment. Carrier = 1-octave band noise centered at best frequency (3.1 kHz), modulation frequency = 64 Hz, level = 50 dB SPL, distance = 80 cm.
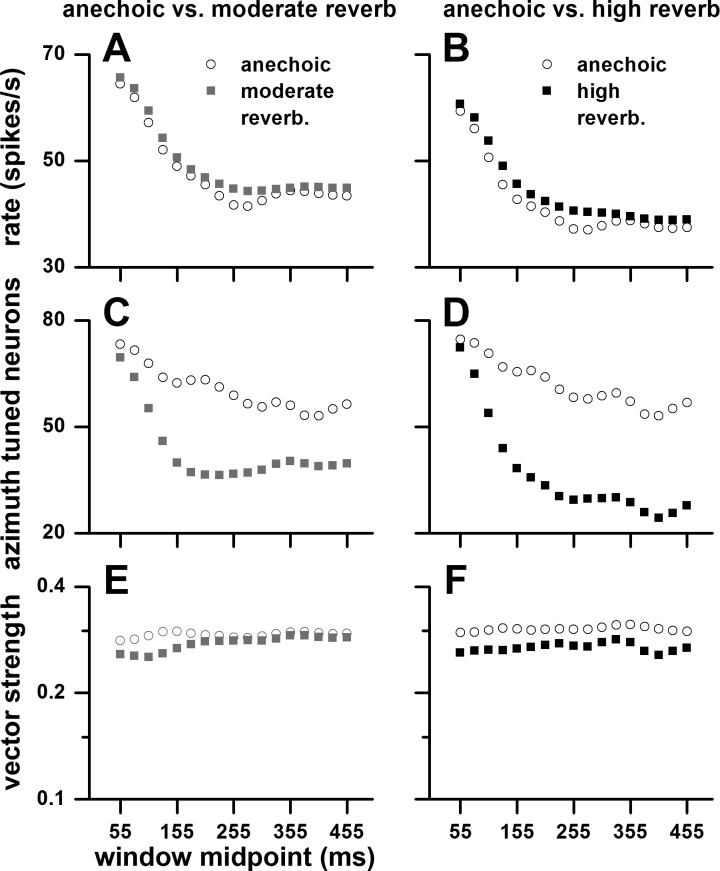
Does azimuth tuning change over time? To address this question we analyzed the neural responses in 100-ms-long, 75% overlapping windows spanning from 5 to 505 ms (re: stimulus onset, e.g., 5–105, 30–130, 55–155 ms, etc.). In Fig. 10, we plot firing rate (Fig. 10, A and B), percentage of azimuth-tuned neurons based on a P < 0.05 criterion (Fig. 10, C and D), and vector strength based on a P < 0.05 criterion (Fig. 10, E and F). In Fig. 10, left, are comparisons between anechoic and moderately reverberant matched pairs, and in Fig. 10, right, are comparisons between anechoic and highly reverberant matched pairs. In all environments, the rate declined over time, most rapidly between 55 and ∼200 ms, and then leveled off (Fig. 10, A and B). The percentage of azimuth-tuned neurons also declined over time, but more so in the two reverberant environments (Fig. 10, C and D). In contrast, in all environments, mean vector strength of azimuth-tuned neurons remained approximately constant over time (Fig. 10, E and F).
Fig. 10.
Time course of firing rate (A and B), % significant (P < 0.05) azimuth-tuned neurons (C and D), and mean significant vector strength of azimuth tuning (E and F). The neural responses were measured in 100-ms-long, 75%-overlapping windows spanning from 5 to 505 ms (re: stimulus onset, e.g., 5–105, 30–130, 55–155 ms, etc.). Left: comparisons between anechoic and moderately reverberant matched neurons. Right: comparisons between anechoic and highly reverberant matched neurons. Sample size: anechoic-moderate reverberation, n = 81; anechoic-high reverberation, n = 50. Sound source distance = 80 cm.
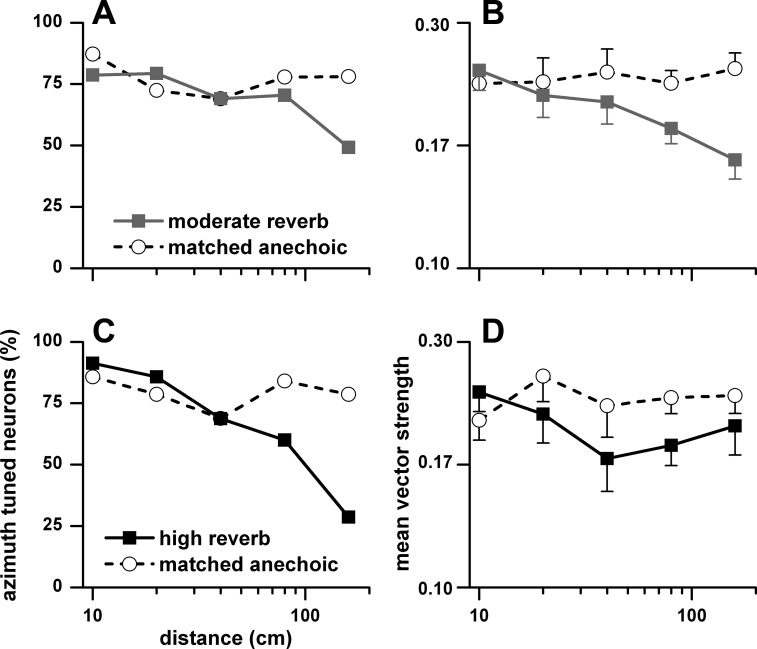
Azimuth tuning in reverberation decreased with sound source distance. In Fig. 11 we show the percentage (Fig. 11, A and C) and mean vector strength (Fig. 11, B and D) of azimuth-tuned neurons to binaural stimulation as a function of distance (10–160 cm). Figure 11, A and B, represent matched neurons for the anechoic and moderately reverberant conditions, and Fig. 11, C and D, represent matched neurons for the anechoic and highly reverberant conditions. In both comparisons, the percentage and mean vector strength of azimuth-tuned neurons in the anechoic environment remained essentially constant across distance, whereas both measures decreased with distance in the two reverberant environments.
Fig. 11.
Percentage of azimuth-tuned neurons (A and C) and their mean vector strength and SE (B and D) to binaural stimulation as a function of sound source distance (10–160 cm). A and B: anechoic and moderately reverberant matched neurons. C and D: anechoic and highly reverberant matched neurons. Sample size for the anechoic and moderately reverberant matched neurons: 10 cm (n = 43), 20 cm (n = 29), 40 cm (n = 24), 80 cm (n = 81), and 160 cm (n = 59). Sample size for the anechoic and highly reverberant matched neurons: 10 cm (n = 35), 20 cm (n = 14), 40 cm (n = 14), 80 cm (n = 50), and 160 cm (n = 42).
Envelope coding.
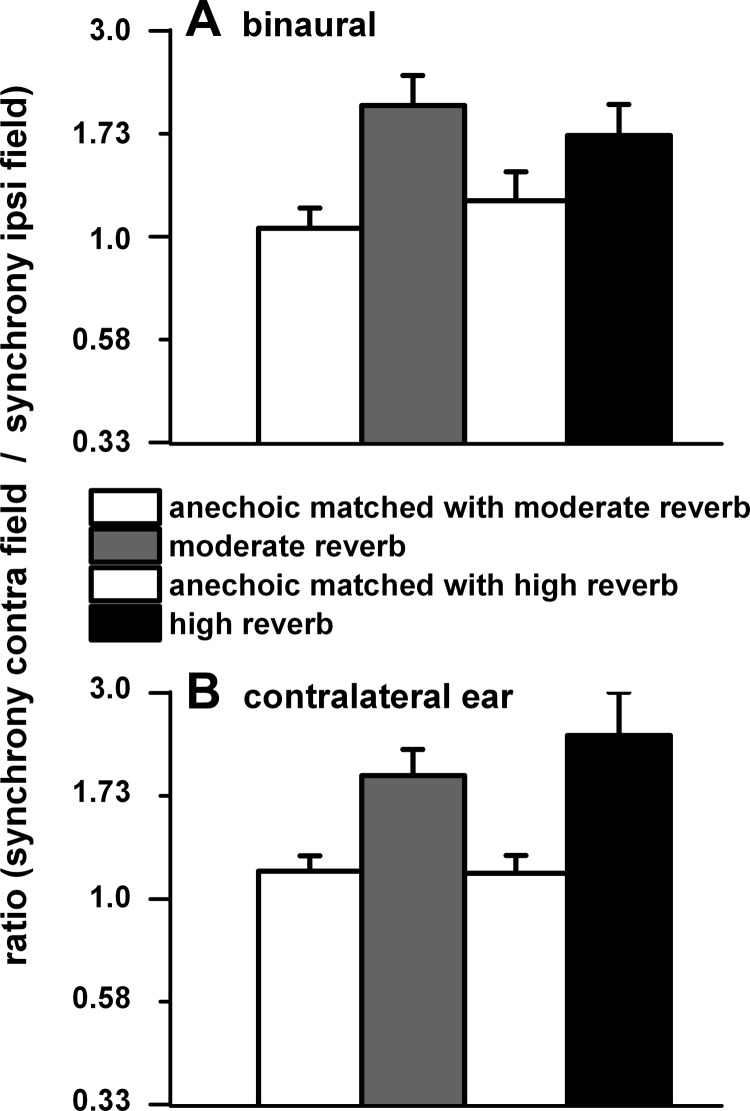
Another aspect of our approach, as illustrated in Fig. 1, is the simultaneous measurement of azimuth and envelope coding to determine whether sound source position and acoustic environment affect envelope coding. Just as rate-azimuth functions tend to be biased toward the contralateral sound field (Fig. 1, B, F, and J; Fig. 4, B, E, K, and N; Fig. 8), so was envelope synchrony. This is illustrated in Fig. 12, where we plot the ratio of the weighted mean synchrony in the contralateral sound field relative to that in the ipsilateral sound field for matched neurons in the anechoic and two reverberant environments. For both binaural (Fig. 12A) and contralateral ear (Fig. 12B) stimulation, there was greater synchrony in the contralateral field, particularly in the reverberant environments.
Fig. 12.
A: ratio of the weighted synchrony in the contralateral sound field to that in the ipsilateral sound field to binaural stimulation for matched neurons in the anechoic and 2 reverberant environments. B: same for contralateral ear stimulation. To be included in our analysis, neurons must have significant synchrony to the envelope at 1 or more azimuthal positions. This also applies to all subsequent figures. Binaural stimulation: anechoic (n = 76) and moderate reverberation (n = 62); anechoic (n = 41) and high reverberation (n = 34). Contralateral ear stimulation: anechoic (n = 62) and moderate reverberation (n = 52); anechoic (n = 33) and high reverberation (n = 24). Sound source distance = 80 cm.
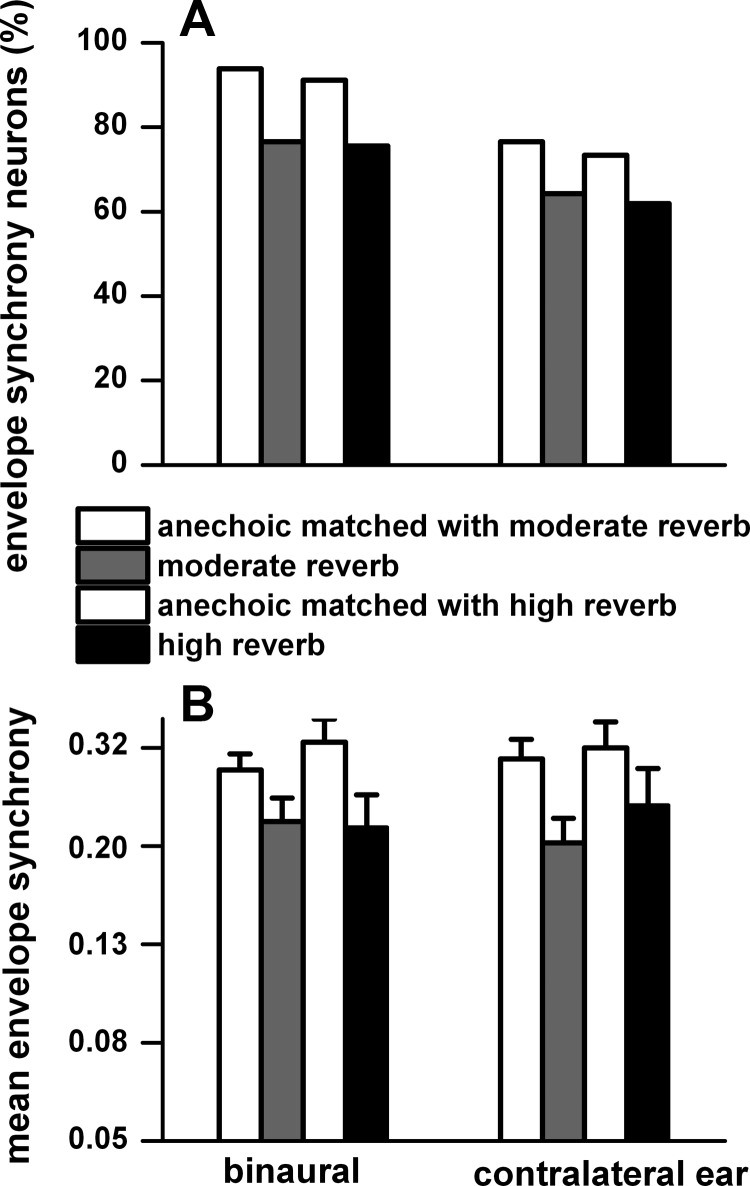
In all environments, more neurons synchronized to the envelope when the stimulation was binaural than when it was monaural. Figure 13A plots the percentage of neurons that showed synchrony to the contralateral sound field for binaural and contralateral ear stimulation for matched neurons. In the anechoic environment, ∼17% more neurons displayed synchrony to binaural stimulation than to monaural stimulation. Synchrony in reverberant conditions was reduced by ∼17% to binaural stimulation and by ∼12% to monaural stimulation. Figure 13B plots the weighted mean synchrony and standard error to binaural and contralateral ear stimulation of the neurons in Fig. 13A. The weighted mean synchrony was similar between the binaural and monaural stimulations in all three environments.
Fig. 13.
A: % of neurons with significant synchrony to the envelope (P < 0.001) to binaural and contralateral ear stimulation for matched neurons in the anechoic and moderately reverberant and anechoic and highly reverberant (n = 34) environments. B: weighted mean synchrony (vector strength) and SE for the neurons in A. Weighted mean synchrony and SE were derived from the log of vector strength. Same sample size as described in Fig. 12. Sound source distance = 80 cm.
To binaural stimulation, envelope synchrony was significantly higher in the anechoic condition than in the moderately reverberant (t = 3.2, df = 58, P = 0.002) and highly reverberant (t = 7.4, df =22, P = 0.0000002) environments. Similarly, to contralateral ear stimulation, vector strength in the anechoic condition was significantly larger than that in moderately reverberant (t = 4.2, df = 44, P = 0.0001) and highly reverberant (t = 2.9, df =22, P = 0.008) environments.
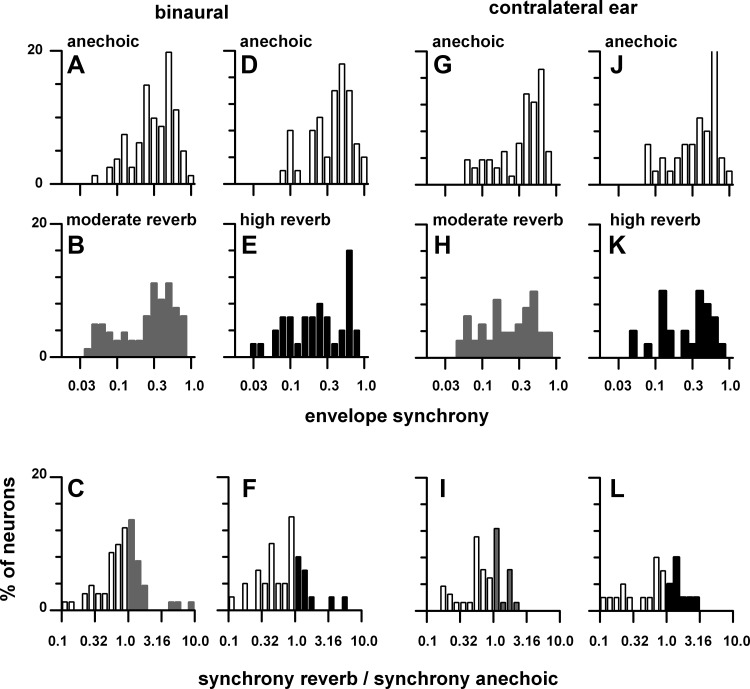
The distribution of weighted mean envelope synchrony in the anechoic environment was not significantly different from those in the reverberant environments. Synchrony to the envelope was moderately reduced in reverberation. Figure 14 plots the distribution of weighted mean synchrony in the contralateral sound field to binaural (Fig. 14, A–F) and contralateral ear (Fig. 14, G–L) stimulation for matched neurons in the anechoic, moderately reverberant, and highly reverberant environments. There were no significant differences [binaural: χ2 = 11.7 (moderate reverberation), 21.8 (high reverberation); contralateral ear: χ2 = 14.5 (moderate reverberation), 15.4 (high reverberation), df = 20, P > 0.05] in the distributions of envelope synchrony between those measured in the anechoic and reverberant environments to either binaural or contralateral ear stimulation (Fig. 14, A and B, D and E, G and H, J and K). Figure 14, C, F, I, and L, plot distributions of the ratio of weighted mean synchrony in reverberation relative to that in the anechoic condition. To binaural stimulation, the mean ratio was 0.60 for moderate reverberation (Fig. 14C) and 0.60 for high reverberation (Fig. 14F), consistent with the significantly smaller envelope synchrony in reverberation compared with the anechoic condition (Fig. 13B). To monaural stimulation, the mean ratio was 0.65 for moderate reverberation (Fig. 14I) and 0.61 for high reverberation (Fig. 14L).
Fig. 14.
Distribution of weighted synchrony in the contralateral sound field for matched neurons in the anechoic (open bars), moderately reverberant (gray bars), and highly reverberant (black bars) environments. A–F: binaural stimulation. G–L: contralateral ear stimulation. Top: distribution in the anechoic condition. Middle: distribution in the moderately reverberant and highly reverberant environments. Bottom: mean ratio of synchrony in the reverberant condition to that in the anechoic environment. y-Axis is % of neurons. The sample size is stated in Fig. 13. Sound source distance = 80 cm.
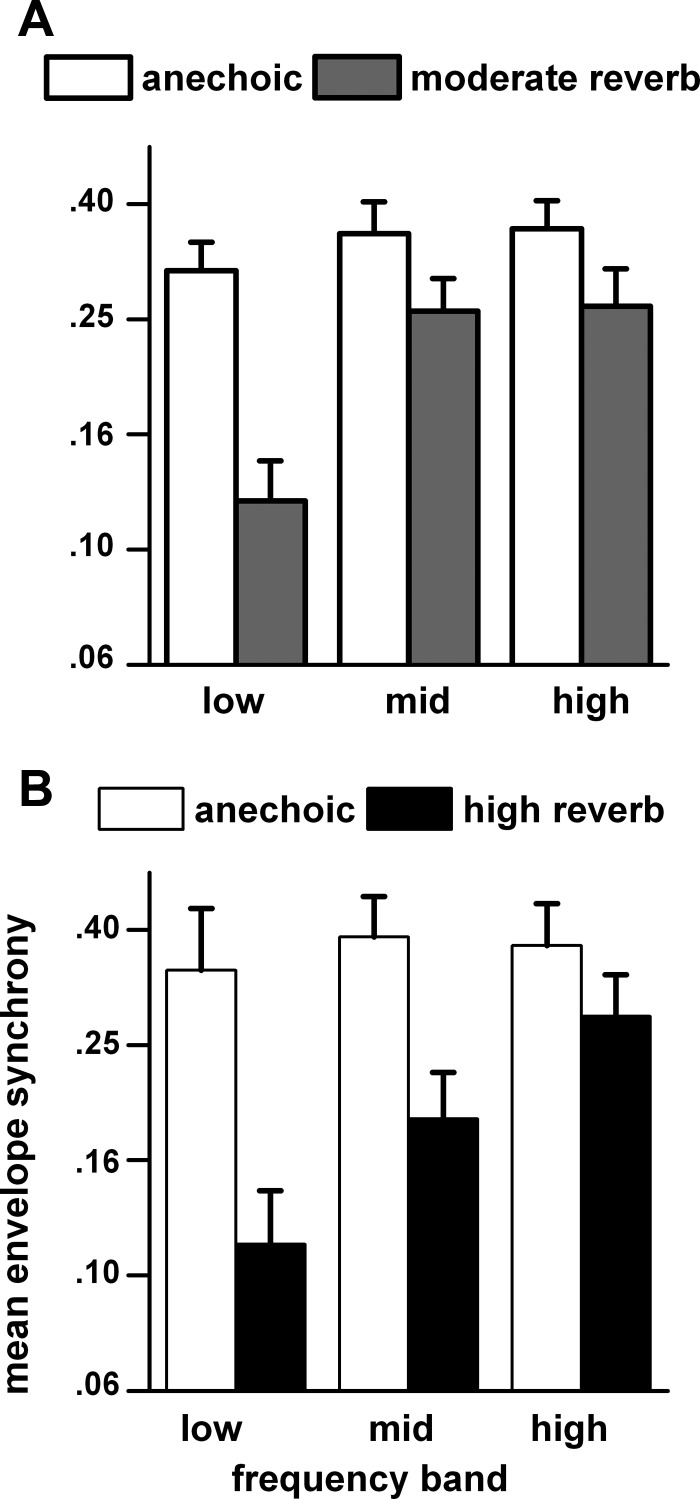
The effect of the center frequency of the octave band noise on envelope synchrony (Fig. 15) was similar to that described for azimuth tuning (Fig. 5). In both the moderately (Fig. 15A) and highly (Fig. 15B) reverberant comparisons, the envelope synchrony in the anechoic condition remained relatively constant across the frequency bands. In contrast, the envelope synchrony in both the moderately and highly reverberant conditions was degraded most in the low frequency band and least in the high frequency band. By paired t-tests with Bonferroni corrections, the anechoic synchrony was significantly larger than that in moderate reverberation in the low frequency band (t = 5.6, df = 23, P = 0.000007), not significantly different in the middle frequency band (t = 2.6, df = 33, P = 0.091), and significantly larger in the high frequency band (t = 3.0, df = 23, P = 0.039). For the highly reverberant comparisons (Fig. 15B) the anechoic synchrony was significantly larger in the low frequency band (t = 6.0, df = 20, P = 0.0008), also significantly larger in the middle frequency band (t = 5.3, df = 20, P = 0.0002), and not significantly different in the high frequency band (t = 1.8, df = 15, P = 0.49).
Fig. 15.
Envelope synchrony as a function of carrier frequency band for matched neuron in anechoic and moderately reverberant (A) and anechoic and highly reverberant (B) environments. To increase the population sample, the synchrony at the 2 farthest distances (80 and 160 cm) were combined. If a neuron was tested at both distances, then only the 160 cm response was retained. The neurons were assigned to 1 of 3 carrier frequency bands (as defined in Fig. 5) based on their best frequency. Sample size: low band: anechoic (n = 42) and moderate reverberation (n = 25), anechoic (n = 21) and high reverberation (n = 12); middle band: anechoic (n = 48) and moderate reverberation (n = 35), anechoic (n = 27) and high reverberation (n = 21); high band: anechoic (n = 25) and moderate reverberation (n = 18), anechoic (n = 18) and high reverberation (n = 18).
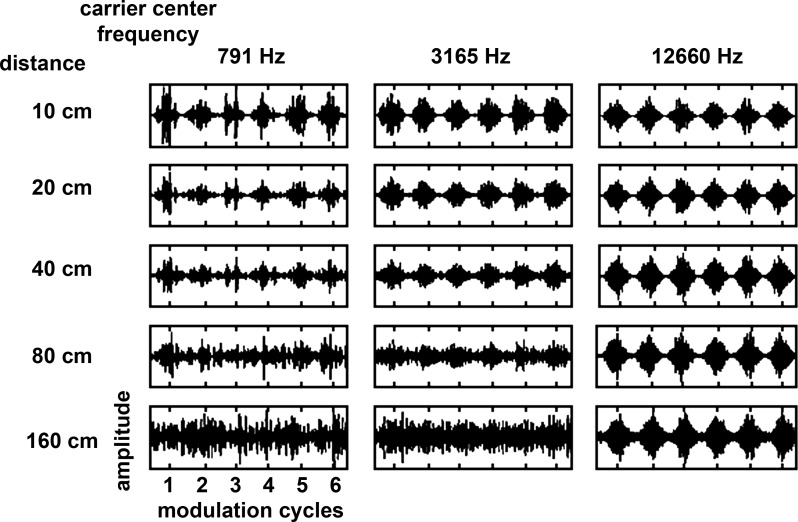
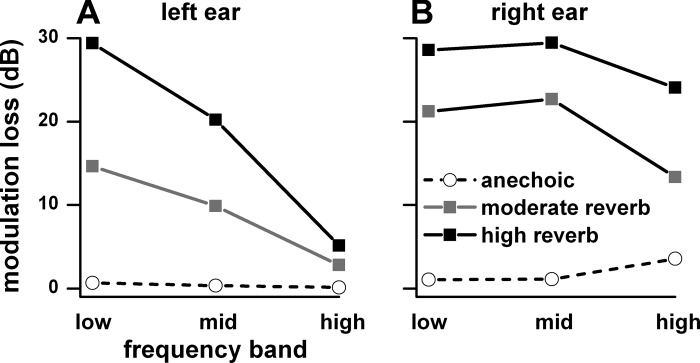
The loss of envelope synchrony in the low frequency band and its preservation in the high frequency band in reverberation was also seen in the acoustic waveforms. Figure 16 illustrates that acoustic modulation depth in the ear was degraded by reverberation and that the amount of modulation loss depended on the center frequency of the octave band noise and distance. The waveforms correspond to signals in the left ear with center frequencies of 791, 3,165, and 12,660 Hz, modulation frequency of 32 Hz, depth 100% at the source, distances of 10–160 cm, and azimuth of −90° facing the ear. For the low-frequency noise carrier the envelope was barely visible at 80 cm and nearly absent at 160 cm. For the midfrequency carrier, the envelope was reduced in depth at 80 cm and virtually absent at 160 cm. For the high-frequency carrier the envelope was robust at both 80 and 160 cm. Figure 17 plots the modulation loss for the same three frequency bands as defined in Fig. 5. For the ear facing the sound source (Fig. 17A), the modulation loss in reverberation was largest for the low frequency band and least for the high frequency band. The modulation loss was greatest in high reverberation, less so in moderate reverberation, and negligible in the anechoic condition.
Fig. 16.
Acoustic waveforms of an octave band carrier modulated at 32 Hz (depth = 100% at the source) with a center frequency of 791 Hz (left), 3,165 Hz (center), and 12,660 Hz (right) recorded in the highly reverberant environment at sound source distances between 10 and 160 cm in the ear facing the sound source (−90°). Six modulation cycles are shown.
Fig. 17.
Modulation loss in the acoustic waveforms measured at −90° for the near (left, A) and far (right, B) ear at a distance of 160 cm for the low, middle, and high bands (as defined in Fig. 5). The acoustic waveforms were derived from the HRTFs and BRTFs measured in the same rabbit as the neural data. The modulation loss for each of the low, middle, and high frequency bands was the average of the loss for a series of 1-octave band noise whose center frequencies varied in 1/3-octave steps spanning the limits of each of the 3 bands. Anechoic, are shown.
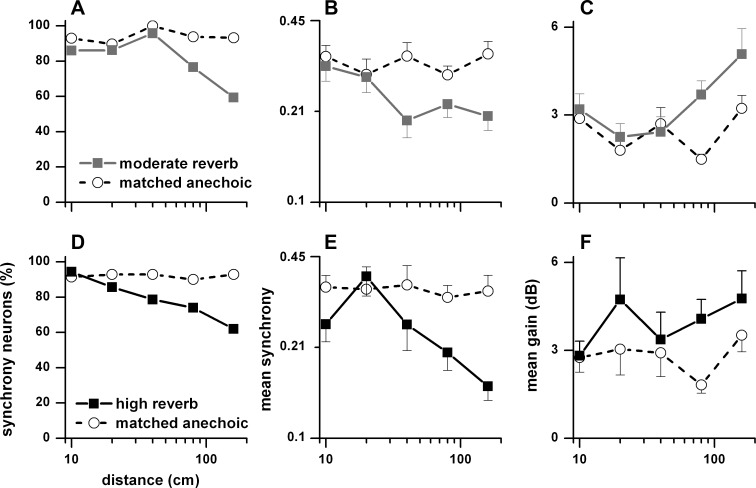
As distance decreased in a reverberant environment, acoustic modulation depth increased (Fig. 16). This relationship was also seen in the neural envelope synchrony. In Fig. 18, we plot as a function of sound source distance the percentage of neurons (Fig. 18, A and D) synchronized to the envelope to binaural stimulation in the contralateral sound field, their mean weighted synchrony (Fig. 18, B and E) and mean weighted gain (Fig. 18, C and F). Figure 18, A–C, show matched anechoic and moderately reverberant comparisons, and Fig. 18, D–F, show matched anechoic and highly reverberant comparisons. The percentage of envelope-synchronized neurons in the anechoic environment remained essentially constant across distance, whereas it decreased with distance in both reverberant environments, albeit more so in the highly reverberant condition (Fig. 18, A and D). The mean weighted synchrony also remained approximately constant across distance in the anechoic environment and decreased in the two reverberant environments, again more so in the highly reverberant condition (Fig. 18, B and E). Neural gain tended to increase with distance in both reverberant environments and was higher than in the anechoic condition (Fig. 18, C and F).
Fig. 18.
Percentage of neurons (A and D), weighted mean synchrony (B and E), and weighted mean gain (C and F) in the contralateral sound field to binaural stimulation as a function of distance (10–160 cm). A–C: matched neurons in the anechoic and moderately reverberant conditions. D–F: matched neurons in the anechoic and highly reverberant conditions. Error bars are SE. Sample size for the anechoic and moderately reverberant matched neurons: 10 cm (n = 43), 20 cm (n = 29), 40 cm (n = 24), 80 cm (n = 81), and 160 cm (n = 59). Sample size for the anechoic and highly reverberant matched neurons: 10 cm (n = 35), 20 cm (n = 14), 40 cm (n = 14), 80 cm (n = 50), and 160 cm (n = 42).
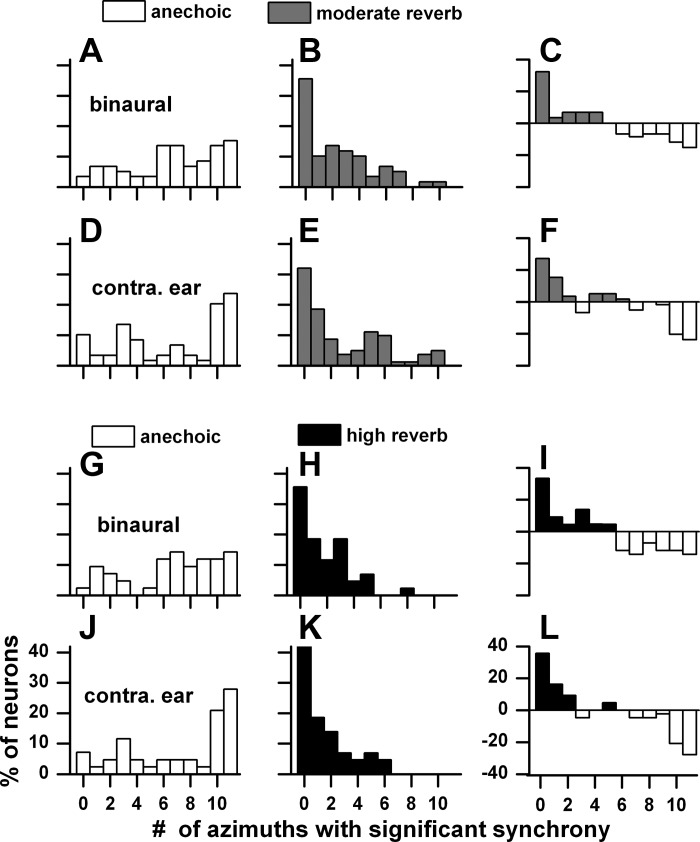
Some neurons showed significant synchrony at each of the 11 azimuths spanning ±150°, whereas others did not synchronize at all. Figure 19 shows this distribution for binaural and contralateral ear stimulation in the anechoic and two reverberant environments when the sound source distance was far (160 cm). Figure 19, A–F, compare the anechoic condition (Fig. 19, A and D) with the moderately reverberant condition (Fig. 19, B and E), and Fig. 19, G–L, compare the anechoic condition (Fig. 19, G and J) with the highly reverberant condition (Fig. 19, H and K). In the anechoic conditions, to either binaural (Fig. 19, A and G) or contralateral ear (Fig. 19, D and J) stimulation, there were more neurons showing synchrony at >5 azimuths than at <5 azimuths. In contrast, in the reverberant environments (Fig. 19, B, E, H, and K) there was bias toward fewer azimuths. In fact, the peak in the reverberant distributions all corresponded to neurons showing no synchrony at all. This pattern was similar for binaural and monaural stimulation. Figure 19, C, F, I, and L, compare the distributions in the anechoic and reverberant environments by taking the difference between percentage of neurons in each pair of environments for each point. Viewed in this way, reverberation has a pronounced, deleterious effect on envelope synchrony.
Fig. 19.
Distributions of number of azimuthal positions with significant envelope synchrony in the ±150° range for binaural and contralateral ear stimulation. Sound source distance = 160 cm. A–F: matched anechoic and moderately reverberant neurons (n = 59). G–L: matched anechoic and highly reverberant neurons (n = 33). C, F, I, and L: difference between anechoic and reverberant conditions.
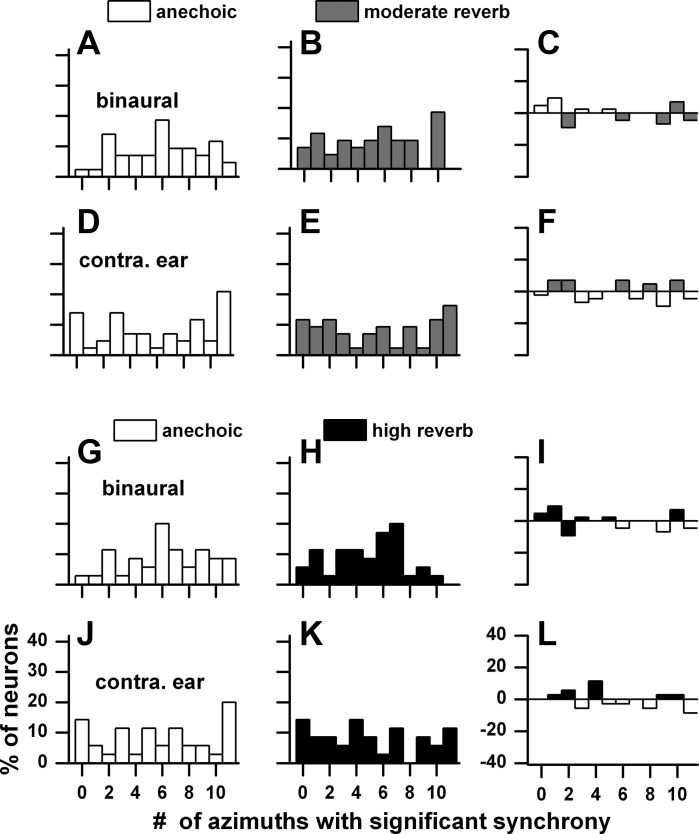
When the sound source distance was close, synchrony in reverberation was restored. Using the same format as Fig. 19, Fig. 20 plots the distribution for a distance of 10 cm. At this distance there was no clear difference between the anechoic and reverberant environments. Unlike the anechoic distribution at 160 cm (Fig. 19), there was no bias toward synchrony at >5 azimuths (Fig. 20, A, D, G, and J). There also was no bias toward fewer azimuths in the reverberant conditions (Fig. 20, B, E, H, and K), which is confirmed by the lack of bias in the difference distributions (Fig. 20, C, F, I, and L).
Fig. 20.
Same format as Fig. 19 except that the data are from a 10-cm distance. Sample size was 43 neurons for the matched anechoic and moderately reverberant distributions and 33 neurons for the matched anechoic and highly reverberant distributions.
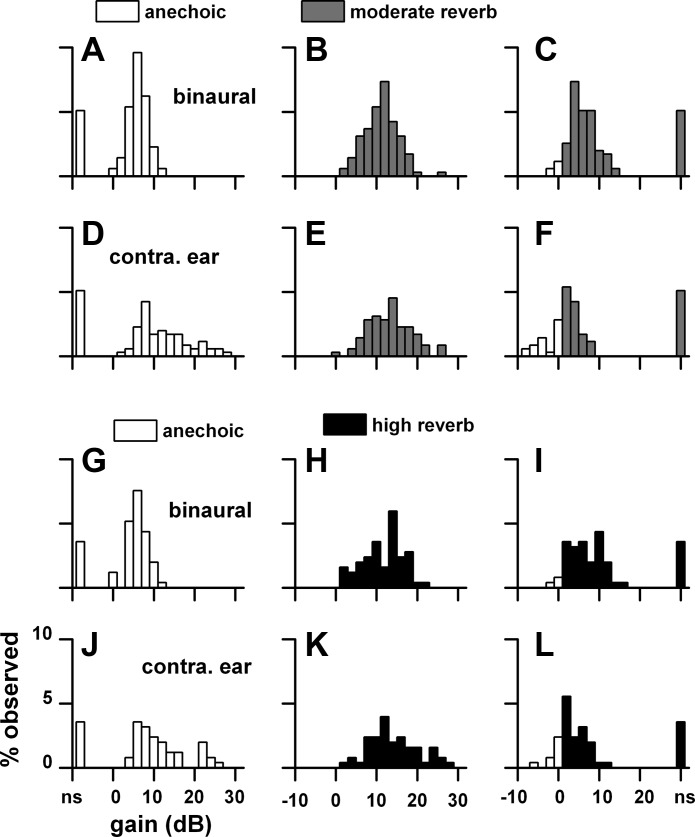
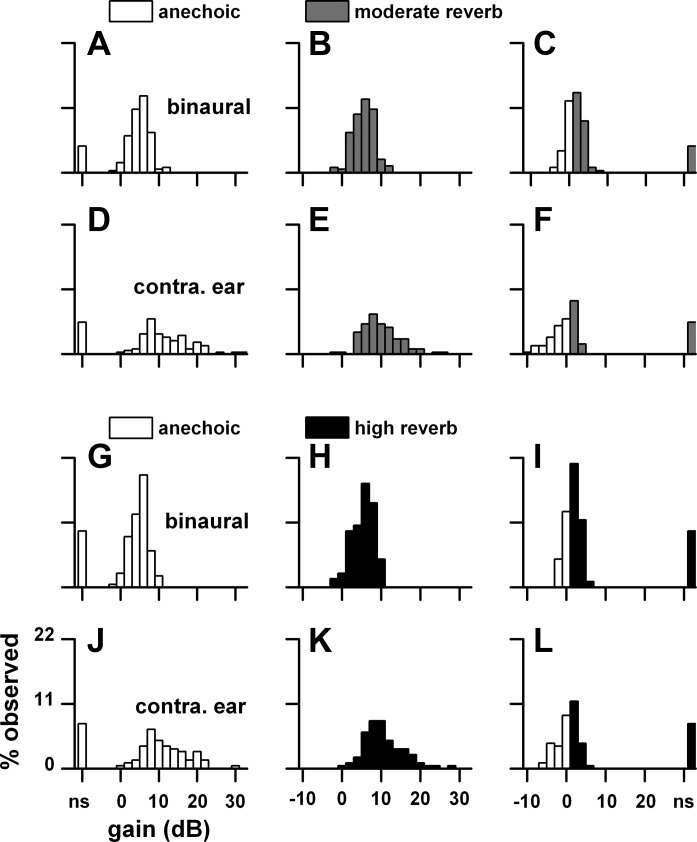
The deleterious effects of reverberation were seen in the reduced number of neurons displaying synchrony as well as in the reduced synchrony. However, we observed that the synchrony that persisted in reverberation often displayed high gains. This feature is described in Fig. 21. For each neuron that displayed synchrony in the contralateral sound field in reverberation, we identified the azimuths where this synchrony occurred and compared them to their anechoic counterparts. We then calculated the corresponding gains. Figure 21 plots these distributions for a distance of 160 cm for binaural and monaural stimulation. Gain in the anechoic environment to binaural stimulation ranged from 0 to 12 dB (Fig. 21A), whereas it ranged from 0 to 20 dB in the moderately reverberant environment (Fig. 21B). The point-by-point difference indicated that the gain in moderate reverberation was higher in the bulk of the comparisons and ranged from 0 to 12 dB (Fig. 21C). The comparisons in gain between the highly reverberant and anechoic environments for binaural stimulation (Fig. 21, G–I) were quite similar to those in the moderately reverberant environment. For monaural stimulation (Fig. 21, D–F and J–L), the distributions were broader and had larger gains than those to binaural stimulation for both anechoic and reverberant environments. Analogous to the binaural conditions, the gains to monaural stimulation in the two reverberant environments were higher than those in the anechoic condition. The large differences in gain between the anechoic and reverberant conditions seen at a far distance was dramatically reduced at a close distance (10 cm; Fig. 22).
Fig. 21.
Distributions of neural gain at individual azimuthal positions in the contralateral sound field to binaural and contralateral ear stimulation. For each neuron that displayed synchrony in the contralateral sound field in reverberation, we identified the azimuths where this synchrony occurred and compared them to their anechoic counterparts. A–F: anechoic and moderately reverberant distributions. G–L: anechoic and highly reverberant distributions. C, F, I, and L: difference between anechoic and reverberant conditions. Sample size: anechoic-moderate reverberation (n = 59), anechoic-high reverberation (n = 42). Sound source distance = 160 cm.
Fig. 22.
Same format as Fig. 21 except that the data are from a 10-cm sound source distance. Sample size: anechoic-moderate reverberation (n = 43), anechoic-high reverberation (n = 35).
Coding of azimuth and envelope.
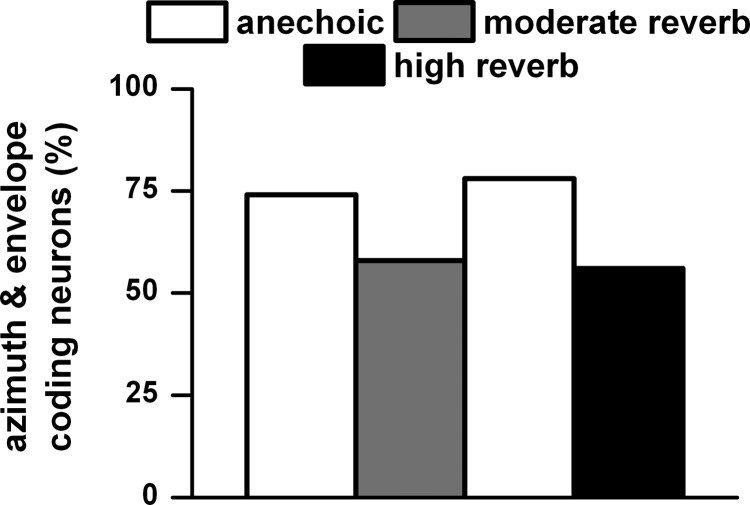
Because azimuth tuning and envelope synchrony were assessed simultaneously in all three environments, it was possible to determine the proportion of neurons that could code both features. Figure 23 shows that ∼75% of the neurons in the anechoic condition and ∼55% in the two reverberant conditions were able to code both azimuth and envelope.
Fig. 23.
Percentage of neurons that showed both azimuth tuning and envelope coding. Same sample size as described in Fig. 12. Sound source distance = 80 cm.
We showed that firing rate and envelope synchrony was stronger in the contralateral sound field. This prompted us to examine the relation between azimuth and firing rate, between azimuth and envelope synchrony, and between rate and synchrony. The azimuth-rate and azimuth-synchrony relationships was accomplished with the angular-linear correlation (Zar 1999), whereas the rate-synchrony relationship was examined with the standard linear correlation. We found high mean correlations between azimuth and firing rate for both anechoic and reverberant conditions (anechoic: 0.78 ± 0.20, moderate reverberation: 0.71 ± 0.24; anechoic: 0.80 ± 0.17, high reverberation: 0.68 ± 0.25). The mean correlation was moderate between azimuth and envelope synchrony for both anechoic and reverberant conditions (anechoic: 0.54 ± 0.25, moderate reverberation: 0.56 ± 0.24; anechoic: 0.52 ± 0.25, high reverberation: 0.60 ± 0.23). The mean correlation decreased further still between firing rate and envelope synchrony for both anechoic and reverberant conditions (anechoic: −0.27 ± 0.48, moderate reverberation: −0.24 ± 0.58; anechoic: −0.22 ± 0.48, high reverberation: −0.01 ± 0.54). This finding indicates that the stronger synchrony in the contralateral sound field is not a consequence of a strong firing rate in the contralateral sound field.
DISCUSSION
This study provides a foundation for understanding the neural coding of azimuth and envelope synchrony at different distances in reverberant and anechoic environments in the IC. To a large extent, this information is lacking in the literature, and yet such information is necessary to understand how the auditory system processes the “what” and “where” information in real environments.
Azimuth coding.
We found that many more neurons showed azimuth tuning to binaural stimulation than to monaural stimulation in all three environments. This is consistent with the fact that azimuth tuning in most neurons requires binaural cues (Delgutte et al. 1999; Tollin and Yin 2002b). At low stimulus levels (10–20 dB re: neural threshold) most neurons show azimuth tuning to monaural stimulation (Delgutte et al. 1999; Kuwada et al. 2011; Poirier et al. 2003; Tollin and Yin 2002a, 2002b), whereas at higher stimulus levels (40–50 dB re: neural threshold) azimuth tuning to monaural stimulation is degraded (Kuwada et al. 2011; Tollin and Yin 2002a, 2000b). Poirier et al. (2003), who measured azimuth tuning in the sound field, found a class of neurons that were azimuth tuned to monaural stimulation at moderate and high stimulus levels. The present findings are consistent with their findings as well as those of Tollin and Yin (2002a) and Kuwada et al. (2011). We also found that monaural azimuth tuning was sharper in reverberation than in the anechoic condition. Furthermore, this monaural azimuth tuning was sharper than the binaural azimuth tuning (Fig. 3B). This enhancement may be mediated by a combination of neural sensitivity to modulation depth and the degrading effects of reverberation on modulation depth (Fig. 9). Neural azimuth tuning to monaural stimulation may underlie the ability in humans to localize sounds in azimuth (albeit coarsely) with one ear (Butler 1975; Hausler et al. 1983; Slattery and Middlebrooks 1994).
Most studies have tested azimuth tuning only in the frontal sound field. Since a neuron's response across azimuth is not necessarily restricted to the frontal sound field, an accurate description of sharpness and direction of azimuth tuning cannot be accomplished by testing only the frontal sound field. A few studies, all in an anechoic environment, did test azimuth tuning over a wider range. Sterbing et al. (2003) tested the full range of azimuths in the IC of the anesthetized guinea pig and found that 75% of the units were tuned to the contralateral side and 56% were tuned to the front. Here we found that more neurons (97%) were tuned to the contralateral sound field and more (65%) to the front. Comparable findings were reported by Kuwada et al. (2011), where azimuth coding was studied without AM. Behrend et al. (2004) also tested the full range of azimuths in the IC of anesthetized guinea pigs and reported a mean centroid of ∼90° in the contralateral sound field. Here we found that the mean vector angle was 77° in the contralateral sound field. Slee and Young (2013) reported that in the IC of the awake marmoset the median best azimuth was 71°, and we found a median vector angle of 80°. Comparable findings regarding mean and median vector angle were reported by Kuwada et al. (2011). These studies indicate that the direction of azimuth tuning is oriented toward 70–90° in the contralateral sound field, at least for guinea pigs, marmosets, and rabbits.
The half-widths of azimuth-tuned neurons are broader in unanesthetized compared with anesthetized preparations. Delgutte et al. (1999) and Sterbing et al. (2003) reported half-widths of 64° and 60° at 20 dB (re: threshold) in the IC of the anesthetized cat and guinea pig. Anesthesia also sharpened ITD functions in the IC of the rabbit (Kuwada et al. 1989). Among the few studies that examined azimuth half-width in unanesthetized animals, Slee and Young (2013) reported it to be 141° at 20 dB in the IC of the awake marmoset and a comparable finding (165°) was reported by Kuwada et al. (2011) in the unanesthetized rabbit at this level. The present study found a half-width of 234° at 30 dB, comparable to the finding of 195° by Kuwada et al. (2011) in the IC of the unanesthetized rabbit. The large difference in half-width between anesthetized and unanesthetized preparations may be due to the sharpening effect of anesthesia (Kuwada et al. 1989), although species differences cannot be discounted.
Although azimuth tuning, in terms of both percentage of tuned neurons and vector strength of tuned neurons, was degraded, the degradation was generally moderate. This degradation in reverberation is consistent with those reported by Devore et al. (2009) and Devore and Delgutte (2010). Devore et al. (2009) suggested that an early (initial 50 ms) part of a neuron's azimuth sensitivity was less degraded by reverberation than a later (50–400 ms) part. They plotted relative firing rate range based on maximum minus minimum firing rate as a measure of azimuth sensitivity for the early and late parts and found that the early part was less degraded than the later part. When we examined vector strength as a measure of azimuth sensitivity for the initial 50 ms and the later part (50–400 ms), we found that the initial 50 ms was less degraded than the later part (not shown), consistent with their finding. This comparison of the early and late windows is confounded because the two windows are very different in length. When we employed equal-length windows over time (Fig. 10), we found that firing rate and percentage of azimuth-tuned neurons systematically declined over a time up to 500 ms. This reduction in firing rate and percentage of azimuth-tuned neurons is consistent with the view of Devore et al. (2009). In contrast, the mean significant vector strength remained approximately constant over time and is in conflict with their view. The study of Devore et al. (2009) used relative firing rate range, whereas we used vector strength. A high vector strength indicates sharp azimuth tuning, whereas a high firing rate range (maximum minus minimum firing rate) does not necessarily indicate sharp tuning.
The frequency dependence of degraded azimuthal tuning in reverberation can be largely accounted for by the frequency-dependent effects of reverberation on the acoustic signals themselves. For both azimuth coding and envelope synchrony, the neural responses were degraded the most at low frequencies, less so at midfrequencies, and hardly at all at high frequencies. ITD sensitivity (a low-frequency binaural cue) was reduced because of degradation in interaural correlation of the acoustic signal in reverberation, at low frequencies and at far distances (80 and 160 cm). ILD (a high-frequency binaural cue) was relatively preserved at high frequencies in reverberation. Similarly for envelope synchrony, at low frequencies modulation loss was severe at far distances whereas at high frequencies it was minimal. This approach highlights the power of using VAS stimuli, which comprehensively account for transformations of the acoustic input, to understand the neural responses to azimuthal location and AM envelope.
The effect of distance on neural azimuth coding in reverberation has received scant attention. The degrading effect of reverberation was large at far distances and negligible at close distances. In a reverberant environment the direct-to-reverberant ratio decreases with distance (Mershon et al. 1989; Zahorik 2002). This may underlie the distance-dependent degradation of azimuth tuning that we observed. For a low-frequency stimulus this change in direct to reverberant energy ratio with distance would systematically alter interaural correlation. This mechanism was described for a low-frequency neuron in our recent report (Kuwada et al. 2012).
Envelope coding.
The effect of reverberation on envelope processing has received scant attention both behaviorally and neurally. Zahorik and colleagues (2011, 2012) found that human listeners' sensitivity to AMs in reverberation was better than predicted from the acoustics. In contrast, Lingner et al. (2013) found that the gerbil's AM sensitivity in reverberation followed the acoustic predictions. Neurally, Delgutte and colleagues (2012) described the effect of reverberation on AM sensitivity, but only in a conference presentation. They reported that envelope sensitivity of IC neurons was better than the acoustic predictions and that the sensitivity was better in reverberant than in anechoic conditions in ∼40% of the neurons. Stated in another way, envelope sensitivity was worse in reverberation than in anechoic in ∼60% of the neurons. Our findings are consistent with their report. Delgutte et al. suggested that the enhancement in reverberation is mediated by a binaural mechanism sensitive to fluctuations in interaural correlations created by reverberation. In a related finding, Steinberg et al. (2013) found enhanced envelope sensitivity to binaural (ILD) compared with monaural stimulation in the owl's posterior part of the lateral lemniscus. However, we found that comparably high neural modulation gains were seen to monaural and binaural stimulation, indicating that a binaural enhancement mechanism is not obligatory. On the other hand, compared with monaural stimulation, we did find a binaural advantage in that more neurons synchronized to the envelope in the contralateral sound field. The mean envelope synchrony, however, did not differ between the binaural and monaural conditions in all three environments. The binaural advantage in the number of envelope-coding neurons may be explained by the fact that substantially more neurons are azimuth tuned (Fig. 3A) and the firing rate is higher (not shown) in the contralateral sound field to binaural stimulation. This reasoning requires that neurons code both azimuth and envelope, and we found this to be true for >50% of the neurons (Fig. 23).
Most traditional studies of the neural coding of envelopes used monaural stimulation (Joris et al. 2004). Our findings indicate that testing the effects of both monaural and binaural stimulation provides a more comprehensive picture of envelope and azimuth coding.
Prior to the present study, the effect of distance on neural synchrony to the envelope in reverberation was not studied. Neural synchrony improved with decreasing distance in reverberation. This improvement can be explained by an increase in modulation depth in the ear with decreasing distance. The increase in acoustic modulation depth is related to an increase in the direct-to-reverberant energy ratio with decreasing distance (Mershon et al. 1989; Zahorik 2002).
Gain was increased at far distances in reverberation. When viewed in the form of weighted mean gain, the difference between the reverberant and anechoic conditions was small (Fig. 18, C and F). The neural gains in reverberation can become much higher (up to 10 dB) than those in the anechoic condition (Fig. 21) when the gain is examined at individual azimuth positions at a far distance. The synchrony in reverberation was higher than predicted by the acoustic modulation depth. The higher synchrony and the corresponding neural gain may be produced by a compensatory mechanism that counteracts the deleterious effects of reverberation. Our neural observations and the proposed compensatory mechanism may underlie the finding that human AM sensitivity in reverberation was better than predicted by the acoustic modulation depth (Zahorik et al. 2011, 2012). Our finding of high neural gain (as high as 30 dB) is consistent with traditional earphone studies, in which gains up to 20 dB were found (Krishna and Semple 2000; Rees and Moller 1983; Rees and Palmer 1989).
More than half of the neurons simultaneously code azimuth and envelope. This finding suggests that specialized “what” and “where” pathways emerge downstream of the IC. Lomber and Malhotra (2008) elegantly showed that inactivating a specific cortical area abolished the animal's ability to localize a sound while preserving the animal's ability to recognize a sound. Inactivating another area had the reverse effect, i.e., to preserve localization and abolish recognition.
GRANTS
This study was supported by National Institute on Deafness and Other Communication Disorders Grant R01 DC-002178.
DISCLOSURES
No conflicts of interest, financial or otherwise, are declared by the author(s).
AUTHOR CONTRIBUTIONS
Author contributions: S.K., B.B., and D.O.K. conception and design of research; S.K., B.B., and D.O.K. performed experiments; S.K., B.B., and D.O.K. analyzed data; S.K., B.B., and D.O.K. interpreted results of experiments; S.K., B.B., and D.O.K. prepared figures; S.K., B.B., and D.O.K. drafted manuscript; S.K., B.B., and D.O.K. edited and revised manuscript; S.K., B.B., and D.O.K. approved final version of manuscript.
ACKNOWLEDGMENTS
We thank the reviewers for their insightful comments and suggestions that served to improve this manuscript.
REFERENCES
- Behrend O, Dickson B, Clarke E, Jin C, Carlile S. Neural responses to free field and virtual acoustic stimulation in the inferior colliculus of the guinea pig. J Neurophysiol 92: 3014–3029, 2004 [DOI] [PubMed] [Google Scholar]
- Blauert J. Spatial Hearing: The Psychophysics of Human Sound Localization (rev. ed.) Cambridge, MA: MIT Press, 1997 [Google Scholar]
- Butler RA. The influence of external and middle ear on auditory discrimination. In: Handbook of Sensory Physiology, Auditory System, edited by Keidel WD, Neff WD. Berlin: Springer, 1975, vol. 2, p. 247–260 [Google Scholar]
- Campbell RA, Doubell TP, Nodal FR, Schnupp JW, King AJ. Interaural timing cues do not contribute to the map of space in the ferret superior colliculus: a virtual acoustic space study. J Neurophysiol 95: 242–254, 2006 [DOI] [PubMed] [Google Scholar]
- Delgutte B, Joris PX, Litovsky RY, Yin TC. Receptive fields and binaural interactions for virtual-space stimuli in the cat inferior colliculus. J Neurophysiol 81: 2833–2851, 1999 [DOI] [PubMed] [Google Scholar]
- Delgutte B, Slama M, Shaheen L. Neural mechanisms for reverberation compensation in the early auditory system (Abstract). Assoc Res Otolaryngol Abstr 35: 91, 2012 [Google Scholar]
- Devore S, Delgutte B. Effects of reverberation on the directional sensitivity of auditory neurons across the tonotopic axis: influences of interaural time and level differences. J Neurosci 30: 7826–7837, 2010 [DOI] [PMC free article] [PubMed] [Google Scholar]
- Devore S, Ihlefeld A, Hancock K, Shinn-Cunningham B, Delgutte B. Accurate sound localization in reverberant environments is mediated by robust encoding of spatial cues in the auditory midbrain. Neuron 62: 123–134, 2009 [DOI] [PMC free article] [PubMed] [Google Scholar]
- Goldberg JM, Brown P. Functional organization of the dog superior olivary complex: an anatomical and electrophysiological study. J Neurophysiol 31: 639–656, 1969 [DOI] [PubMed] [Google Scholar]
- Hausler R, Colburn HS, Marr E. Sound localization in subjects with impaired hearing. Acta Otolaryngol Suppl 400: 1–62, 1983 [DOI] [PubMed] [Google Scholar]
- Heffner H, Masterton B. Hearing in Glires: domestic rabbit, cotton rat, feral house mouse, and kangaroo rat. J Acoust Soc Am 68: 1584–1599, 1980 [Google Scholar]
- Joris PX, Schreiner CE, Rees A. Neural processing of amplitude-modulated sounds. Physiol Rev 84: 541–577, 2004 [DOI] [PubMed] [Google Scholar]
- Joris PX, Yin TC. Responses to amplitude-modulated tones in the auditory nerve of the cat. J Acoust Soc Am 91: 215–232, 1992 [DOI] [PubMed] [Google Scholar]
- Keller CH, Hartung K, Takahashi TT. Head-related transfer functions of the barn owl: measurement and neural responses. Hear Res 118: 13–34, 1998 [DOI] [PubMed] [Google Scholar]
- Kim DO, Bishop B, Kuwada S. Acoustic cues for sound source distance and azimuth in rabbits, a racquetball and a rigid spherical model. J Assoc Res Otolaryngol 11: 541–557, 2010 [DOI] [PMC free article] [PubMed] [Google Scholar]
- Kim DO, Sirianni JG, Chang SO. Responses of DCN-PVCN neurons and auditory nerve fibers in unanesthetized decerebrate cats to AM and pure tones: analysis with autocorrelation/power-spectrum. Hear Res 45: 95–113, 1990 [DOI] [PubMed] [Google Scholar]
- Krishna BS, Semple MN. Auditory temporal processing: responses to sinusoidally amplitude-modulated tones in the inferior colliculus. J Neurophysiol 84: 255–273, 2000 [DOI] [PubMed] [Google Scholar]
- Kulkarni A, Colburn HS. Role of spectral detail in sound-source localization. Nature 396: 747–749, 1998 [DOI] [PubMed] [Google Scholar]
- Kuwada S, Batra R, Stanford TR. Monaural and binaural response properties of neurons in the inferior colliculus of the rabbit: effects of sodium pentobarbital. J Neurophysiol 61: 269–282, 1989 [DOI] [PubMed] [Google Scholar]
- Kuwada S, Bishop B, Alex C, Condit DW, Kim DO. Spatial tuning to sound-source azimuth in the inferior colliculus of unanesthetized rabbit. J Neurophysiol 106: 2698–2708, 2011 [DOI] [PMC free article] [PubMed] [Google Scholar]
- Kuwada S, Bishop B, Kim DO. Approaches to the study of neural coding of sound source location and sound envelope in real environments. Front Neural Circuits 6: 42, 2012 [DOI] [PMC free article] [PubMed] [Google Scholar]
- Kuwada S, Fitzpatrick DC, Batra R, Ostapoff EM. Sensitivity to interaural time differences in the dorsal nucleus of the lateral lemniscus of the unanesthetized rabbit: comparison with other structures. J Neurophysiol 95: 1309–1322, 2006 [DOI] [PubMed] [Google Scholar]
- Lingner A, Kugler K, Grothe B, Wiegrebe L. Amplitude-modulation detection by gerbils in reverberant sound fields. Hear Res 302: 107–112, 2013 [DOI] [PubMed] [Google Scholar]
- Lomber SG, Malhotra S. Double dissociation of “what” and “where” processing in auditory cortex. Nat Neurosci 11: 609–616, 2008 [DOI] [PubMed] [Google Scholar]
- Mershon DH, Ballenger WL, Little AD, McMurtry PL, Buchanan JL. Effects of room reflectance and background noise on perceived auditory distance. Perception 18: 403–416, 1989 [DOI] [PubMed] [Google Scholar]
- Moore BC. An Introduction to the Psychology of Hearing. New York: Academic, 1997 [Google Scholar]
- Nelson BS, Takahashi TT. Spatial hearing in echoic environments: the role of the envelope in owls. Neuron 67: 643–655, 2010 [DOI] [PMC free article] [PubMed] [Google Scholar]
- Plomp R. The role of modulations in hearing. In: Hearing: Physiological Bases and Psychophysics, edited by Klinke R, Hartmann R. New York: Springer, 1983, p. 270–275 [Google Scholar]
- Poirier P, Samson FK, Imig TJ. Spectral shape sensitivity contributes to the azimuth tuning of neurons in the cat's inferior colliculus. J Neurophysiol 89: 2760–2777, 2003 [DOI] [PubMed] [Google Scholar]
- Rayleigh L. On our perception of sound direction. Phil Mag 13: 214–232, 1907 [Google Scholar]
- Rees A, Moller AR. Responses of neurons in the inferior colliculus of the rat to AM and FM tones. Hear Res 10: 301–330, 1983 [DOI] [PubMed] [Google Scholar]
- Rees A, Palmer AR. Neuronal responses to amplitude-modulated and pure-tone stimuli in the guinea pig inferior colliculus, and their modification by broadband noise. J Acoust Soc Am 85: 1978–1994, 1989 [DOI] [PubMed] [Google Scholar]
- Slattery WH, 3rd, Middlebrooks JC. Monaural sound localization: acute versus chronic unilateral impairment. Hear Res 75: 38–46, 1994 [DOI] [PubMed] [Google Scholar]
- Slee SJ, Young ED. Linear processing of interaural level difference underlies spatial tuning in the nucleus of the brachium of the inferior colliculus. J Neurosci 33: 3891–3904, 2013 [DOI] [PMC free article] [PubMed] [Google Scholar]
- Steinberg LJ, Fischer BJ, Pena JL. Binaural gain modulation of spectrotemporal tuning in the interaural level difference-coding pathway. J Neurosci 33: 11089–11099, 2013 [DOI] [PMC free article] [PubMed] [Google Scholar]
- Sterbing SJ, Hartung K, Hoffmann KP. Spatial tuning to virtual sounds in the inferior colliculus of the guinea pig. J Neurophysiol 90: 2648–2659, 2003 [DOI] [PubMed] [Google Scholar]
- Tollin DJ, Yin TC. The coding of spatial location by single units in the lateral superior olive of the cat. I. Spatial receptive fields in azimuth. J Neurosci 22: 1454–1467, 2002a [DOI] [PMC free article] [PubMed] [Google Scholar]
- Tollin DJ, Yin TC. The coding of spatial location by single units in the lateral superior olive of the cat. II. The determinants of spatial receptive fields in azimuth. J Neurosci 22: 1468–1479, 2002b [DOI] [PMC free article] [PubMed] [Google Scholar]
- Wightman FL, Kistler DJ. Headphone simulation of free-field listening. I. Stimulus synthesis. J Acoust Soc Am 85: 858–867, 1989 [DOI] [PubMed] [Google Scholar]
- Yin TC, Chan JC, Carney LH. Effects of interaural time delays of noise stimuli on low-frequency cells in the cat's inferior colliculus. III. Evidence for cross-correlation. J Neurophysiol 58: 562–583, 1987 [DOI] [PubMed] [Google Scholar]
- Zahorik P. Assessing auditory distance perception using virtual acoustics. J Acoust Soc Am 111: 1832–1846, 2002 [DOI] [PubMed] [Google Scholar]
- Zahorik P, Kim D, Kuwada S, Anderson P, Brandewie E, Collecchia R, Srinivasan N. Amplitude modulation detection by human listeners in reverberant sound fields: carrier bandwidth effects and binaural versus monaural comparison (Abstract). J Acoust Soc Am Proc Mtg Acoust 15: 050002, 2012 [DOI] [PMC free article] [PubMed] [Google Scholar]
- Zahorik P, Kim DO, Kuwada S, Anderson PW, Brandewie E, Srinivasan NK. Amplitude modulation detection by human listeners in sound fields. J Acoust Soc Am Proc Mtg Acoust 12: 050005, 2011 [DOI] [PMC free article] [PubMed] [Google Scholar]
- Zar JH. Biostatistical Analysis. Upper Saddle River, NJ: Prentice Hall, 1999, p. 651–653 [Google Scholar]


