Abstract
We investigated which of cat limb kinematic variables during swing of regular walking and accurate stepping along a horizontal ladder are stabilized by coordinated changes of limb segment angles. Three hypotheses were tested: 1) animals stabilize the entire swing trajectory of specific kinematic variables (performance variables); and 2) the level of trajectory stabilization is similar between regular and ladder walking and 3) is higher for forelimbs compared with hindlimbs. We used the framework of the uncontrolled manifold (UCM) hypothesis to quantify the structure of variance of limb kinematics in the limb segment orientation space across steps. Two components of variance were quantified for each potential performance variable, one of which affected it (“bad variance,” variance orthogonal to the UCM, VORT) while the other one did not (“good variance,” variance within the UCM, VUCM). The analysis of five candidate performance variables revealed that cats during both locomotor behaviors stabilize 1) paw vertical position during the entire swing (VUCM > VORT, except in mid-hindpaw swing of ladder walking) and 2) horizontal paw position in initial and terminal swing (except for the entire forepaw swing of regular walking). We also found that the limb length was typically stabilized in midswing, whereas limb orientation was not (VUCM ≤ VORT) for both limbs and behaviors during entire swing. We conclude that stabilization of paw position in early and terminal swing enables accurate and stable locomotion, while stabilization of vertical paw position in midswing helps paw clearance. This study is the first to demonstrate the applicability of the UCM-based analysis to nonhuman movement.
Keywords: uncontrolled manifold analysis, principle of abundance, walking, accurate stepping, cat
one of the central problems of motor control is the problem of motor redundancy (Bernstein 1967). It reflects the fact that, in any analysis of the neuromotor system, the number of elemental variables (those produced by system's elements, i.e., body limbs, joints, muscles, etc.) is higher than the number of constraints associated with typical motor tasks. For example, the same movement of the hand or foot can be performed with different combinations of joint angles of the limb because the number of degrees of freedom (DOF) in the upper and lower extremities exceeds the number of space dimensions [two- (2D) or three-dimensional (3D)] in which the endpoint of the limb is constrained to move. Given an unlimited choice of combinations of elemental variables (e.g., joint angles) to move the limb endpoint along a trajectory, how does the nervous system select specific combinations of elemental variables to organize the movement? Recently, an approach to solving this problem has been developed based on the principle of abundance (Gelfand and Latash 1998; Latash 2012). According to this principle, the central nervous system (CNS) often does not look for single optimal solutions to problems of motor redundancy, but facilitates families of solutions equally capable of solving the task. A signature of this control strategy is a particular pattern of variance in the space of elemental variables. A quantitative method for analysis of motor variance has been developed within the uncontrolled manifold (UCM) hypothesis (Latash et al. 2007; Scholz and Schoner 1999). Within this method, variance across consecutive trials or cycles (for a cyclic task) is partitioned into two components. One of them (variance within the UCM, VUCM or “good variability”) keeps a potentially important performance variable unchanged, while the other (variance orthogonal to the UCM, VORT or “bad variability”) leads to changes in that variable. Neural mechanisms responsible for variance distributions characterized by an inequality VUCM > VORT have been referred to as “synergies.”
The term “synergy” has been used in the literature in at least three meanings. In clinical literature, this word has a strong negative connotation and implies pathological, stereotypical patterns of muscle activation (e.g., after stroke) interfering with voluntary movements (Bobath 1978; Dewald et al. 1995). In a more traditional meaning, synergy means a group of variables that scale together during changes in task parameters and/or over time; methods of matrix factorization have been commonly used to identify such groups of variables (reviewed in Ting and McKay 2007). This definition follows the traditions set by Bernstein (1967), who viewed such grouping as a method of reducing the number of variables a hypothetical neural controller has to manipulate. Our definition links the notion of synergies to stability of movements, which is paramount for successful performance in the changing environment.
There is no agreed-upon hypothesis on the origin of motor synergies (in our definition). Synergies have been described as products of an optimal feedback control scheme, a feed-forward scheme, a scheme with central back-coupling loops, and a hierarchical scheme based on ideas of equilibrium-point control (Goodman and Latash 2006; Latash 2010; Latash et al. 2005; Martin et al. 2009; Todorov and Jordan 2002). Most of these schemes make no claims regarding potential roles of different brain regions in synergies. Studies of patients with cortical and subcortical disorders (Park et al. 2012, 2013; Reisman and Scholz 2003) point at subcortical loops, possibly those involving the basal ganglia and the cerebellum, as crucial for synergy formation in humans.
As of now, all of the experimental evidence in favor of the principle of abundance and the idea of synergies has come from studies on people. A number of studies of animals, including reduced animal preparations, suggest that synergies may be organized at the spinal cord level (Berkinblit et al. 1986; Boyce and Lemay 2009; Hultborn et al. 2004; Mussa-Ivaldi et al. 1994). However, only indirect animal studies of the structure of variance have been available (Bauman and Chang 2013; Chang et al. 2009). One of the main goals of the current study has been to provide evidence for synergies stabilizing potentially important performance variables during a natural behavior of intact cats. We selected locomotion as the behavior of interest because, first, the central role of the spinal cord in the production of locomotion has been well established; second, one can formulate reasonable hypotheses with respect to kinematic performance variables that may be stabilized by a multijoint synergy; and third, comparing synergies in the forelimbs and hindlimbs allows the exploration of the potential role of vision in such synergies.
It is well known that animals, including humans, can voluntarily modify the location of foot placement during locomotion when they step on specific support surfaces (Beloozerova and Sirota 1993a, 1993b; Metz and Whishaw 2002), circumvent or step over obstacles (Lavoie et al. 1995; Patla and Greig 2006), walk along a prescribed path (Galvez-Lopez et al. 2011; McAndrew Young et al. 2012), or alter stride length and stance width when stability of locomotion is threatened (Dingwell et al. 2008; MacLellan and Patla 2006; Marigold and Patla 2008). Potentially, several motor strategies are available to provide accurate foot placement to a selected location. An entire foot trajectory could be planned before initiation of swing (Hollands and Marple-Horvat 1996, 2001) to enable safe foot clearance over the ground, and any deviation from the trajectory is corrected. Alternatively, foot trajectory could be stabilized only in the vicinity of a foot placement location (Reynolds and Day 2005) or in early swing of locomotion.
During quadrupedal locomotion, the animal can see only the final part of forepaw trajectory prior to paw contact with the ground, whereas the initial part of the forepaw trajectory and the entire hindpaw trajectory cannot be seen. Nevertheless, displacements and symmetric bell-shaped velocity profiles of fore- and hindpaws look essentially identical during swing of regular walking and skilled accurate stepping on a horizontal ladder (Beloozerova et al. 2010; Prilutsky et al. 2005), suggesting that, in these tasks, paw placements are planned in advance and are not corrected during swing (Beloozerova et al. 2010). Alternatively, a stereotypic paw trajectory of each limb during swing could result from a continuous or intermittent stabilization of limb endpoint position by coordinated small changes in joint angles such that they reduce variability of the paw based on a combination of visual and proprioceptive feedback. This stabilization of paw trajectory could potentially explain substantial changes in the modulation of neural activity from limbs' representation in the motor cortex during swing of skilled accurate stepping compared with the activity of the same cortical cells during regular walking, despite virtually identical limb kinematics (Beloozerova et al. 2010).
We approached the analysis of multijoint synergies potentially stabilizing the paw trajectory or other limb kinematic variables using the method developed within the UCM hypothesis. Namely, for each time sample of the swing phase, VUCM and VORT were computed across consecutive strides, both quantified per DOF in the corresponding spaces, and then a “synergy index” (ΔV) was computed reflecting the relative difference between VUCM and VORT. VUCM > VORT (ΔV > 0) is interpreted as a reflection of a purposeful neural strategy stabilizing the performance variable. In some motor behaviors, like blacksmith hammering (Bernstein 1923) or pistol shooting (Scholz et al. 2000), the performance variables can be reasonably assumed a priori, and their stabilization tested using the UCM analysis. In locomotor behaviors, hypothetical performance variables are not obvious, and their selection for the UCM analysis requires careful considerations.
During skilled walking on a horizontal ladder, i.e., accurate stepping, the cat walks by placing paws on 5-cm-wide crosspieces of the ladder (Beloozerova et al. 2010; Beloozerova and Sirota 1993a). This locomotor behavior is trained for about 1 mo using operant conditioning and food rewards (see methods), and once the task is learned the cat never fails to place paws on the ladder crosspieces during walking. Thus in this locomotor behavior, paw position during swing can be hypothesized to be a performance variable. Recent studies on dynamic stability of regular walking in humans (Hof et al. 2005, 2007) and cats (Farrell et al. 2014) have also demonstrated the importance of accurate foot or paw placement in front of the extrapolated center of mass of the body to maintain dynamic stability in the frontal and sagittal planes. Therefore, it is reasonable to assume that paw position during cat regular walking could be a performance variable. Other potential performance variables during cat regular walking that appear to be stabilized by multijoint kinematic synergies even after injury of major ankle extensors are the limb length and orientation (Bauman and Chang 2013; Chang et al. 2009), whose values may be encoded in the activity of the dorsal spinocerebellar tract neurons (Bosco et al. 2000).
Our more specific hypotheses related to possible differences in stabilization of the potential fore- and hindlimb performance variables during swing and between regular walking and accurate stepping on crosspieces of a horizontal ladder. Three hypotheses were tested: 1) animals stabilize the entire trajectory of the performance variable during swing [based on human studies (Domkin et al. 2005; Krishnan et al. 2013)]; 2) the index of performance variable trajectory stabilization during walking on a horizontal ladder is similar to that during regular walking [based on studies showing no correlation between indexes of stabilization and accuracy of performance (Gorniak et al. 2008; Shapkova et al. 2008)]; and 3) the index of performance variable trajectory stabilization is higher for forepaws compared with hindpaws [based on the importance of visual information for accurate stepping (Marigold and Patla 2008; Reynolds and Day 2005)].
METHODS
Subjects and Experimental Procedures
Locomotor kinematics of hind- and forelimbs were obtained from recordings of five adult cats (3 males and 2 females), participants of a larger study; animal characteristics are shown in Table 1. All experimental procedures were conducted in accordance with the US Public Health Service Policy on Humane Care and Use of Laboratory Animals and with the approval of the Institutional Animal Care and Use Committees of both Georgia Institute of Technology and Barrow Neurological Institute.
Table 1.
Individual and mean cat characteristics
| Cat |
||||||
|---|---|---|---|---|---|---|
| Parameter | BU | BL | AG | C8 | FM | Mean ± SD |
| Upper arm length, mm | 93 | 88 | 110 | 103 | 103 | 99 ± 9 |
| Forearm length, mm | 93 | 89 | 125 | 113 | 110 | 106 ± 15 |
| Carpals + digits length, mm | 35 | 36 | 35 | 40 | 30 | 35 ± 4 |
| Thigh length, mm | 98 | 100 | 110 | 110 | 105 | 105 ± 6 |
| Shank length, mm | 98 | 100 | 115 | 133 | 116 | 112 ± 14 |
| Tarsals + digits length, mm | 72 | 78 | 75 | 68 | 67 | 72 ± 5 |
| Mass, kg | 3.1 | 3.0 | 4.6 | 4.5 | 4.0 | 3.8 ± 0.8 |
Cats were trained for at least 1 mo to walk along a walkway in a Plexiglas-enclosed chamber on a flat surface and on a horizontal ladder (crosspieces 5 cm wide) using food reward (for details see Beloozerova et al. 2010; Gregor et al. 2006; Prilutsky et al. 2005). Food reward, several dry food pellets, was given each time the cat walked across the walkway with or without horizontal ladder with a steady speed. The cat consumed pellets during short breaks of 5–15 s before initiating the next walking trial and continued walking until it lost interest in food and stopped eating after completing 50–80 trials. After training, high-speed (sampling frequency 112–120 Hz) motion capture systems Vicon (Vicon Motion Systems) or Visualeyez System (Phoenix Technologies) were used to record 3D coordinates of markers attached to shaved skin over bony landmarks of the cat body using double-sided adhesive tape (Fig. 1) (Beloozerova et al. 2010; Prilutsky et al. 2005). Marker locations used in this study included the greater trochanter (hip joint), approximate knee joint center, lateral malleolus (ankle joint), base of the fifth metatarsal (metatarsophalangeal joint) of one or both hindlimbs and the greater tubercle (shoulder joint), approximate elbow joint center, ulna styloid process (wrist joint), base of the fifth metacarpal (metacarpophalangeal joint) of one or both forelimbs. The animals performed regular walking and accurate stepping within one experimental session, either intermittently by continuously crossing interconnected walkways with flat surface and a horizontal ladder or sequentially by performing multiple trials of one locomotion task before switching to the other task; the order of tasks was balanced between cats. The distance between crosspieces of the horizontal ladder was set for each cat to be approximately equal to the mean cat's step length of regular walking with self-selected speed (on average, about 25 cm).
Fig. 1.
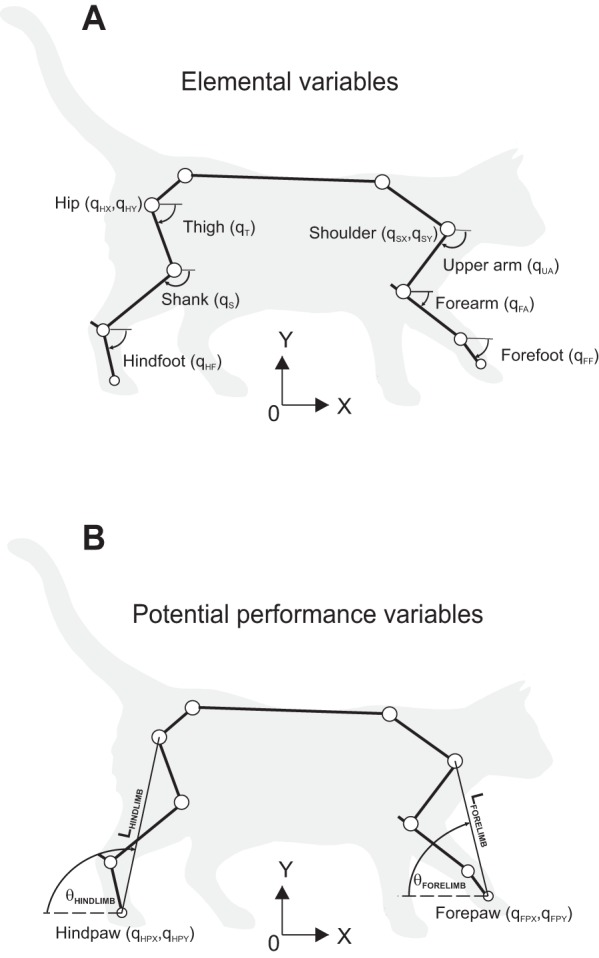
Kinematic model of fore- and hindlimbs used for uncontrolled manifold (UCM) analysis. A: kinematics of each limb is described by 5 generalized coordinates (elemental variables): Cartesian x- and y-coordinates of suspension point [hip (H) or shoulder (S)] and 3 segment angles with the horizon [thigh (T) or upper arm (UA), shank (S) or forearm (FA), hindfoot (HF) or forefoot (FF)] (hindfoot comprises tarsals and hind digits, forefoot consists of carpals and fore digits). B: potential performance variables for UCM analysis are the two-dimensional (2D) position of the limb endpoint, i.e., Cartesian x- and y-coordinates of forepaw (FP) or hindpaw (HP), vertical or horizontal position of the paw, limb length (L) and limb orientation (θ). The open circles indicate positions of reflective markers for motion capture.
Length of each segment of the fore- and hindlimb (Table 1) was measured using a caliper while the animal was sedated (dexmedetomidine, 40–60 μg/kg sc).
Data Processing
All recorded walking trials were screened to ensure that only cycles in which cats walked with a constant, steady speed were used for further analysis. Recorded marker displacement data of the main joints of left and/or right fore- and hindlimbs (Fig. 1) in the sagittal plane were low-pass filtered (fourth-order, zero-phase lag Butterworth filter, 10-Hz cutoff frequency). To minimize displacement errors caused by skin motion near the knee and elbow joints (Miller et al. 1975), coordinates of these joints were recalculated using recorded joint marker positions of the adjacent joints and measured length of the segments forming the knee and elbow joints. For example, for each instant of time, the position of the knee joint center in the sagittal plane was determined trigonometrically as an intersection point between the two circles with the centers located at the ankle joint marker and the hip joint marker positions and with the circles' radii corresponding to the shank length and thigh length, respectively. Out of two intersection points, the one corresponding to the anatomical constraint on maximum knee extension (<180°) was selected. The same procedure was used to determine the position of the elbow joint in the sagittal plane.
The relative position of the limb endpoint with respect to the limb most proximal joint (hip or shoulder) was used to identify the swing phase onset (paw-off, PO) and offset (paw contact, PC), as described elsewhere (Pantall et al. 2012). Each analyzed stride cycle was defined as the period between consecutive PO instances; the swing phase was defined as the period between PO and PC. The smoothed marker displacements were time normalized within each walking cycle and swing phase.
A 2D, 5 DOF kinematic model of a limb was used to describe kinematics of the fore- and hindlimb (Fig. 1) and derive the Jacobian matrix (see below). Generalized coordinates describing model kinematics included the Cartesian horizontal and vertical coordinates of the limb suspension point (the hip joint for hindlimb and the shoulder joint for forelimb) and three segment angles with respect to the horizon (Fig. 1: thigh, shank, and foot angles for the hindlimb and upper arm, forearm and fore foot angles for the forelimb). Since UCM analysis, as described in the Introduction, involves calculations of variance of kinematic variables at the same normalized time instant across walking cycles, it is important to ensure that each elemental kinematic variable has a similar periodic pattern within walking cycles. All generalized coordinates of the limb model are periodic functions of walking cycle time, except for the horizontal displacement of the hip and shoulder joints (e.g., Prilutsky et al. 2005). To make these latter variables periodic, a linear trend (a linear regression between the horizontal joint displacement and normalized cycle time) was computed and then subtracted from the horizontal displacement of the joint at each percent of the cycle time. This detrending procedure is analogous to determining horizontal coordinates of a joint in a coordinate frame moving with a constant speed corresponding to the average speed of walking in a given cycle. In other words, the obtained detrended horizontal coordinates of the hip and shoulder can be considered displacements, as observed during walking on a treadmill operating at a constant speed.
Uncontrolled Manifold Analysis
We used the framework of the UCM analysis (Latash et al. 2007; Scholz et al. 2000; Scholz and Schoner 1999) to partition variance of elemental kinematic task variables (limb generalized coordinates) at each time instant across multiple walking cycles into two subspaces. One subspace (UCM) consists of variance of elemental variables that does not affect a performance variable, VUCM (“good variance”); the second subspace is orthogonal to the first one and contains variance that affects a performance variable, VORT (“bad variance”). Both variance components, VUCM and VORT, were computed for each instance of the normalized walking cycle time and then normalized per DOF of the corresponding subspace. To examine whether a performance variable was stabilized over walking cycles by coordinated changes in elemental variables, the VUCM and VORT were compared by analyzing their normalized difference (index of synergy, ΔV, e.g., Klous et al. 2011).
Potential performance and elemental variables.
As discussed in the Introduction, five limb kinematic variables could be assumed to be stabilized by multijoint kinematic synergies during swing of regular and ladder walking: 1) 2D paw position in the global coordinate frame related to the ground; 2) horizontal paw position in the global coordinate frame; 3) vertical paw position in the global coordinate frame; 4) limb length (the distance between the most proximal joint and the paw); and 5) limb orientation.
To examine stabilization of potential performance variable 1, 2D paw position, the global Cartesian horizontal x and vertical y coordinates of the paw were expressed as functions of five elemental task variables (generalized limb coordinates; Fig. 1):
| (1) |
where generalized limb coordinates are as follows: q1 and q2, horizontal and vertical coordinates of hip (shoulder) joint; q3, q4 and q5, angles formed by the thigh (upper arm), shank (forearm), and tarsals (carpals) with the horizon; L3, L4, L5, lengths of the thigh (upper arm), shank (forearm), and tarsals (carpals), respectively (Table 1). In contrast to some previous UCM analyses (Auyang et al. 2009; Kapur et al. 2010; Latash et al. 2007; Scholz and Schoner 1999), we used heterogeneous elemental variables with different dimensions, i.e., angles and Cartesian linear coordinates, to analyze stabilization of paw 2D position or paw's vertical and horizontal positions separately. Note that similar approaches were used earlier (e.g., Yang and Scholz 2005). To eliminate dependence of computed variance of elemental variables on their dimensions, the variables were substituted by new variables using the range of variables' changes (Ri) across analyzed cycles (Ri = qimax − qimin, i = 1, . . ., 5; where qimax and qimin are maximum and minimum values, respectively, of ith elemental variable across walking cycles for a given cat and limb, Table 2). For horizontal coordinate q1, the range was determined after the detrending procedure. By introducing new elemental variables q̂i = (qi − qimin)/Ri that change between 0 and 1, system (Eq. 1) can be rewritten as:
| (1a) |
The Jacobian of system (Eq. 1a) for each time instant is
| (2) |
The Jacobian Jx,y was used for computing the VUCM and VORT of the five elemental variables describing the 2D paw position (see below).
Table 2.
Ranges of elemental variables describing paw position in the global coordinate system for fore- and hindlimbs during locomotor tasks
| Cat | Limb | Rq1, mm | Rq2, mm | Rq3, ° | Rq4, ° | Rq5, ° |
|---|---|---|---|---|---|---|
| AG | Fore | 63 | 47 | 81 | 85 | 125 |
| Hind | 61 | 70 | 77 | 79 | 112 | |
| BL | Fore | 75 | 37 | 84 | 117 | 137 |
| Hind | 55 | 41 | 96 | 91 | 96 | |
| BU | Fore | 81 | 45 | 104 | 108 | 152 |
| Hind | 42 | 53 | 98 | 92 | 95 | |
| C8 | Fore | 72 | 63 | 95 | 118 | 169 |
| Hind | 62 | 57 | 77 | 63 | 109 | |
| FM | Fore | 73 | 60 | 73 | 113 | 106 |
| Hind | 44 | 45 | 69 | 76 | 84 |
The Jacobians Jx and Jy for computing VUCM and VORT for paw horizontal and vertical positions (potential performance variables 2 and 3) in the space of the same five elemental variables corresponded to the first and second rows of matrix (2).
The Jacobian JL for computing VUCM and VORT for limb length (potential performance variable 4) in the space of three limb segment angles q3, q4, and q5 (Fig. 1) is:
| (2a) |
where L3, L4, and L5 are lengths of three limb segments in the fore- or hindlimb (Fig. 1); L = is the fore- or hindlimb length; xL = L3 cos q3 + L4 cos q4 + L5 cos q5 is the horizontal hind- or forepaw coordinate with respect to the hip or shoulder joint; yL = −(L3 sin q3 + L4 sin q4 + L5 sin q5) is the vertical hind- or forepaw coordinate with respect to the hip or shoulder joint.
The Jacobian Jθ for computing VUCM and VORT for limb orientation (potential performance variable 5) in the space of three limb segment angles q3, q4, and q5 (Fig. 1) is:
| (2b) |
For each potential performance variable, the corresponding Jacobian was used to linearize limb forward kinematics in the vicinity of the limb reference configuration at each time instant of jth walking cycle (Scholz and Schoner 1999):
| (3) |
where rj and qj are vectors of performance variable components and elemental variables in cycle j and r̄ and q̄ are vectors of performance and elemental variables in the limb reference configuration, respectively; the reference limb configuration was set for each normalized cycle time instant as the mean limb configuration across all walking cycles within the task and animal (Figs. 2 and 3). For each time instant, the projection of deviations of the limb segment configuration vector from the limb reference configuration vector (Δqj = qj − q̄) onto the Jacobian's null-space is computed as:
| (4) |
whereas the component of limb configuration deviations perpendicular to the null-space is
| (5) |
where the basis vector e defines the null-space of the Jacobian (0 = Je), for which deviations of limb segment configurations in the vicinity of the reference limb configuration do not affect paw position. The amount of variance per DOF within the UCM (good variance) is
| (6) |
where N is the number of cycles and NUCM is the dimension of the UCM. The amount of variance per DOF in the space orthogonal to the null-space (bad variance) is
| (7) |
where NORT is the number of DOF for the space orthogonal to the UCM. The amount of total variance per DOF is
| (8) |
where NTOT is the number of DOF of the elemental variables.
Fig. 2.
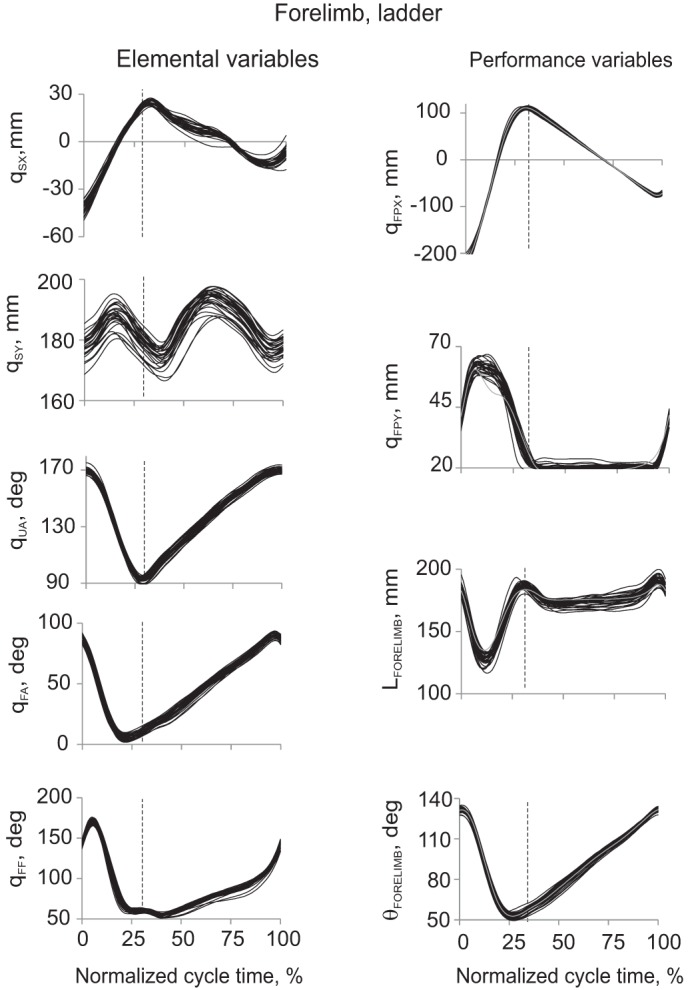
Examples of forelimb elemental (left) and potential performance variables (right) during 30 cycles of ladder walking from a representative cat BL. Each individual cycle is represented by a thin black line. Vertical dashed line in each panel separates the swing and stance phase. Left (from top to bottom): Cartesian horizontal qSX (after detrending, see text) and vertical qSY coordinates of the shoulder, orientation angles of the upper arm qUA, forearm qFA and forefoot qFF (for definition of the elemental variables, see Fig. 1). Right (from top to bottom): Cartesian horizontal qFPX (after detrending) and vertical qFPY coordinates of the forepaw, forelimb length LFORELIMB and forelimb orientation θFORELIMB (for definition of the potential performance variables see Fig. 1). The gray line in each panel represents the mean of the linearized forward kinematics solutions computed for 30 walking cycles (see Eq. 3).
Fig. 3.
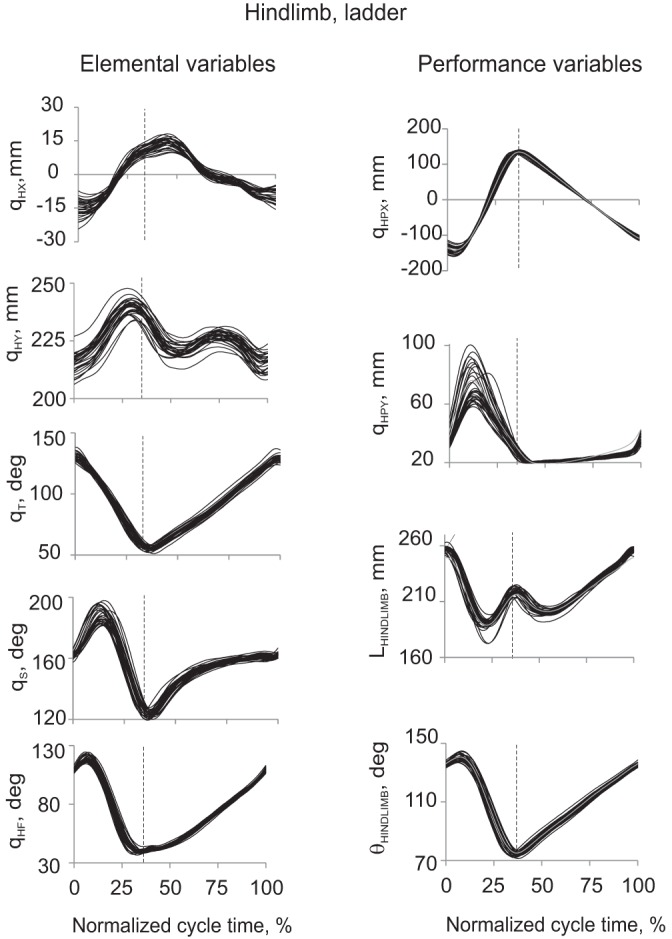
Examples of hindlimb elemental (left) and potential performance variables (right) during 30 cycles of ladder walking from a representative cat BL. Each individual cycle is represented by a thin black line. Vertical dashed line in each panel separates the swing and stance phase. Left (from top to bottom): Cartesian horizontal qHX (after detrending, see text) and vertical qHY coordinates of the hip, orientation angles of the thigh qT, shank qS and hindfoot qHF (for definition of the elemental variables, see Fig. 1). Right (from top to bottom): Cartesian horizontal qHPX (after detrending) and vertical qHPY coordinates of the hindpaw, hindlimb length LHINDLIMB and hindlimb orientation θHINDLIMB (for definition of the potential performance variables, see Fig. 1). The gray line in each panel represents the mean of the linearized forward kinematics solutions computed for 30 walking cycles (see Eq. 3).
The index of synergy ΔV was computed as
| (9) |
The range of ΔV changes depends on the dimensions of VUCM, VORT and VTOT spaces that in turn depend on dimensions of the performance variable and the number of elemental variables. It follows from Eqs. 6–9 that values of ΔV for 2D paw position (potential performance variable 1) and five elemental variables (see above) can change between −2.50 and 1.67 (NUCM = 3, NORT = 2, NTOT = 5). For one-dimensional potential performance variables 2 and 3 (horizontal and vertical paw positions analyzed separately) and the same five elemental variables, ΔV can change between −5 and 1.25 (NUCM = 4, NORT = 1, NTOT = 5). For one-dimensional potential performance variables 4 and 5 (limb length and limb orientation) and three elemental variables of segment angles, ΔV can change between −3 and 1.5 (NUCM = 2, NORT = 1, NTOT = 3). ΔV values higher than zero at a given time instant indicate that the potential performance variable (e.g., paw position or limb length) is stabilized by covarying across cycles elemental variable changes at this time instant.
The ΔV, ΔVUCM and ΔVORT were computed for every percentage of the normalized swing phase time of each walking task and limb for each cat and potential performance variable.
Statistics
To test the effects of locomotion task, limb and swing time on the ΔV, VUCM and VORT, a three-way 2 (task: regular walking, ladder walking) by 2 (limb: forelimb, hindlimb) by 10 (time: 10% time bins of swing) repeated-measures ANOVA was performed for each dependent variable. Since absolute values of ΔV are constrained by a minimum and maximum value as described above, leading to a reduction of the ΔV variance when ΔV values approach their limits, the Fisher z transformation of ΔV was performed prior to ANOVA analysis. When ANOVA analysis indicated significant results, post hoc comparisons were performed with the Bonferroni test. To test whether ΔV was significantly different from zero and if VUCM and VORT were different from each other, the nonparametric Wilcoxon matched-pairs test was used. Statistical analysis was performed using software STATISTICA 7 (StatSoft, Tulsa, OK). Significance level was set at 0.05.
RESULTS
General Kinematic Characteristics of Regular and Ladder Walking
The number of analyzed walking cycles per cat, limb and walking condition was 30. Walking speed, determined as the ratio of the horizontal displacement of the limb suspension point (hip or shoulder) over the cycle time, was not statistically different among the combinations of locomotor tasks and limbs; speed ranged from 0.71 ± 0.17 m/s for hindlimb cycles of ladder walking to 0.76 ± 0.22 m/s for forelimb cycles of ladder walking (repeated-measures ANOVA, F1,4 = 0.07–0.83, P = 0.414–0.802, Table 3). Cycle times for different walking tasks and limbs were found to be between 685 ± 151 ms (forelimb, ladder walking) and 710 ± 37 ms (hindlimb, regular walking), and no significant difference in cycle time was detected among tasks and limbs (repeated-measures ANOVA, F1,4 = 0.16–0.23, P = 0.66–0.71). Forelimb swing times were 253 ± 18 ms and 247 ± 40 ms for regular and ladder walking, respectively, whereas the corresponding hindlimb swing durations were longer, 285 ± 5 ms and 277 ± 47 ms (repeated-measures ANOVA, F1,4 = 229.4, P < 0.05, Table 3). Duty factor (the ratio of stance time and cycle time) was accordingly lower for hindlimbs with the values of 0.60 ± 0.02 for regular and ladder walking than for forelimbs during regular and ladder walking: 0.64 ± 0.04 ms and 0.63 ± 0.03 ms, respectively (repeated-measures ANOVA, F1,4 = 15.25, P < 0.05). Thus general timing characteristics of fore- and hindlimb movements during regular and ladder walking were in agreement with previously published data on cat locomotion (Beloozerova et al. 2010; Miller et al. 1975; Prilutsky et al. 2005).
Table 3.
General kinematic characteristics of fore- and hindlimbs during regular and ladder walking
| Limb | Locomotor Task | Cycle Time, ms | Swing Time, ms | Duty Factor | Walking Speed, m/s |
|---|---|---|---|---|---|
| Forelimb | Regular | 709 ± 67 | 253 ± 18 | 0.64 ± 0.04 | 0.72 ± 0.10 |
| Hindlimb | Regular | 710 ± 37 | 285 ± 5 | 0.60 ± 0.02 | 0.72 ± 0.10 |
| Forelimb | Ladder | 685 ± 151 | 247 ± 40 | 0.63 ± 0.03 | 0.76 ± 0.22 |
| Hindlimb | Ladder | 698 ± 124 | 277 ± 47 | 0.60 ± 0.01 | 0.71 ± 0.17 |
Values are means ± SD; n = 5 cats.
All cats demonstrated highly stereotypic kinematic patterns of the elemental variables: vertical and detrended horizontal coordinates of the shoulder and hip joints, fore- and hindlimb segmental angles (Figs. 2 and 3, left), as well as the potential performance variables: vertical and detrended horizontal coordinates of the fore- and hindpaw, limb length and limb orientation (Figs. 2 and 3, right) during both regular and ladder walking. Stereotypic kinematics across walking cycles within each cat were evident from the relatively small variability of the kinematic patterns and in similarity of the temporal changes in kinematic variables, i.e., their peaks and troughs were closely aligned across cycles (Figs. 2 and 3).
Linearization of limb forward kinematics in the vicinity of the limb reference configuration performed for each potential performance variable and the corresponding set of elemental variables (Eq. 3) gave close approximation of experimentally recorded 2D paw position, limb segment length and orientation for ladder walking (Figs. 2 and 3, right, gray lines) and regular walking (not shown).
Potential Performance Variables
2D paw position in 5D space of elemental variables.
Patterns of good variance of limb kinematics (VUCMx,y), bad variance (VORTx,y), and synergy index (ΔVx,y) were similar between regular and ladder walking (see a representative example for forelimbs of ladder walking in Fig. 4): VUCM achieved its maximum values in midstance, VORT had one peak in midswing and values close to zero in stance, whereas ΔVx,y had high positive values in early and late swing and during most of stance and was close to zero in midswing. Since this study focuses on paw trajectory during swing, the stance phase will not be considered further.
Fig. 4.
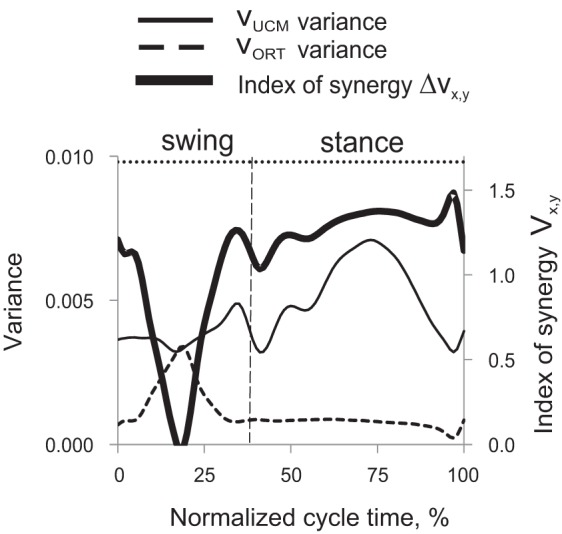
Representative patterns of index of synergy (ΔVx,y, thick line), “good” variance (VUCM, thin continuous line) and “bad” variance [variance orthogonal to the UCM (VORT), dashed line] calculated for forelimbs of one cat during a cycle of ladder walking. The left vertical axis is for VUCM and VORT; the right vertical axis shows values of ΔVx,y. The vertical dashed line separates the swing and stance phase. The top horizontal dotted line indicates the theoretical maximum of ΔVx,y (1.67, see text). Cat BL, ladder walking, N = 30.
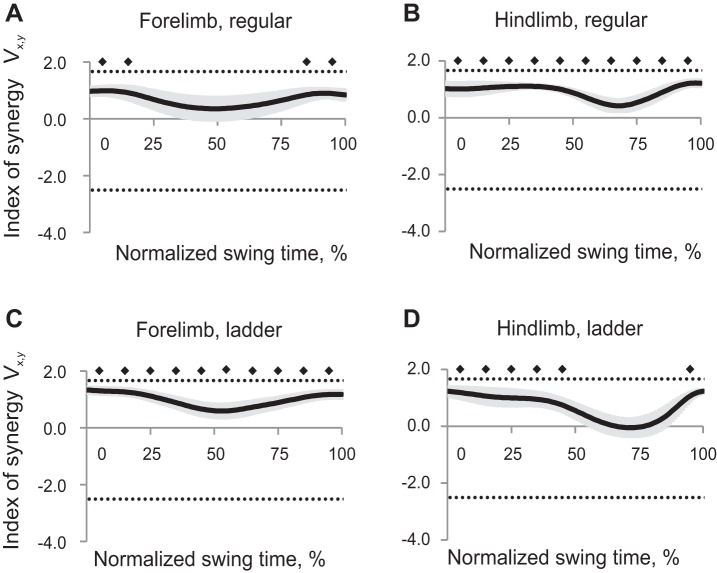
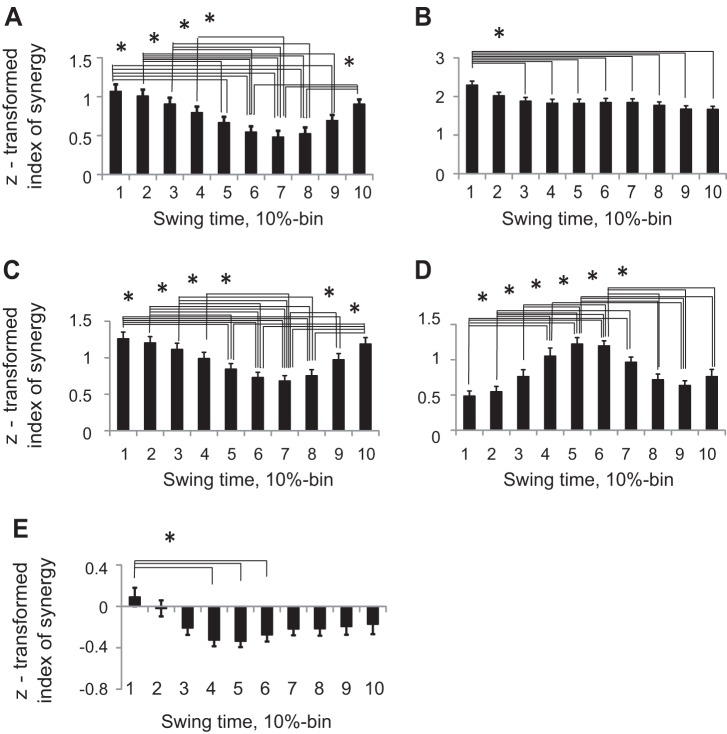
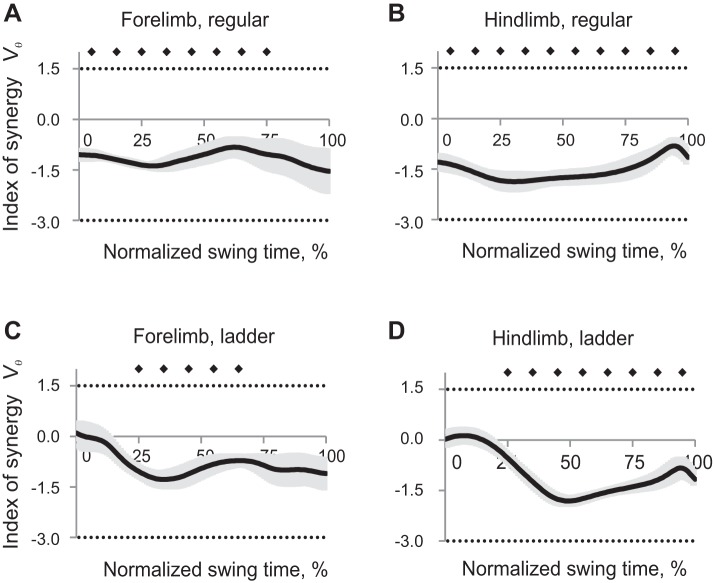
Synergy index ΔVx,y patterns averaged across all cats within each task and limb had positive values throughout the whole swing phase for hindlimbs during regular walking and forelimbs during ladder walking (Wilcoxon matched-pairs test, Z = 2.02, n = 5, P < 0.05), indicating that the 2D paw position could be stabilized throughout the swing. Index of synergy ΔVx,y for forelimb during regular walking and for hindlimbs during ladder walking was different from zero only in the beginning or first half of swing and late swing [Wilcoxon matched-pairs test, Z = 2.02, n = 5, P < 0.05, Fig. 5, mean (black line) ± SE (gray shadow)]. Thus the 2D forepaw position during regular walking and hindpaw position during ladder walking were not stabilized in midswing. ANOVA performed on z-transformed ΔVx,y values demonstrated a significant effect of swing time (F9,36 = 13.7, P < 0.05, Fig. 6A): the index of synergy ΔVx,y averaged across limbs and walking conditions for each time bin was higher at the beginning and end of swing than in midswing. There was a significant time-limb interaction effect on index of synergy ΔVx,y (F9,36 = 7.55; P < 0.05), and no significant effects of locomotion task or limb.
Fig. 5.
Index of synergy ΔVx,y as a function of the normalized swing time [mean (black line) ± SE (gray shadow), 5 cats] computed for the 2D paw position in space of 5 elemental variables. A: forelimb, regular walking. B: hindlimb, regular walking. C: forelimb, ladder walking. D: hindlimb, ladder walking. The top horizontal dotted line indicates the theoretical maximum of ΔVx,y (1.67); the bottom dotted line indicates the theoretical minimum of ΔVx,y (−2.5, see text for details). Solid diamonds indicate 10% time bins of swing for which ΔVx,y is significantly different from zero (P < 0.05).
Fig. 6.
Z-transformed index of synergy values averaged across limbs and walking conditions for each swing time bin (mean ± SE, 5 cats). A: index of synergy ΔVx,y. B: index of synergy ΔVy. C: index of synergy ΔVx. D: index of synergy ΔVL. E: index of synergy ΔVθ. Asterisks and horizontal brackets indicate statistical difference between time bins (P < 0.05).
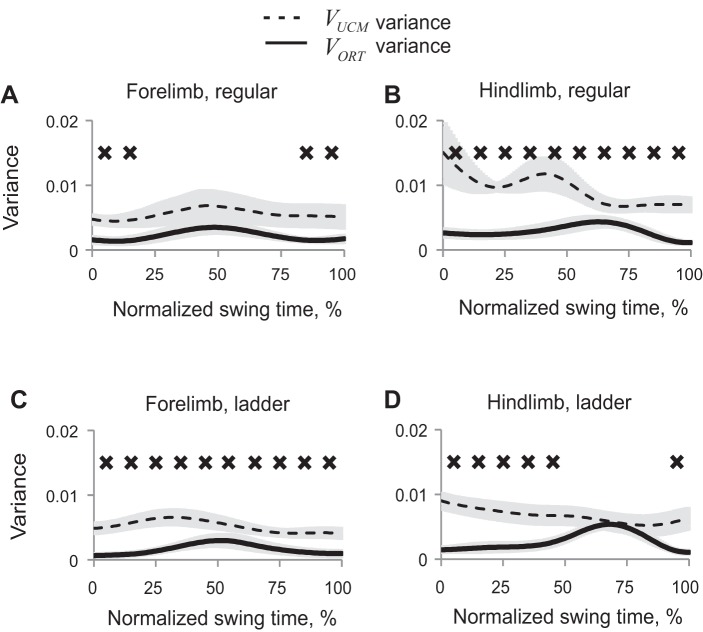
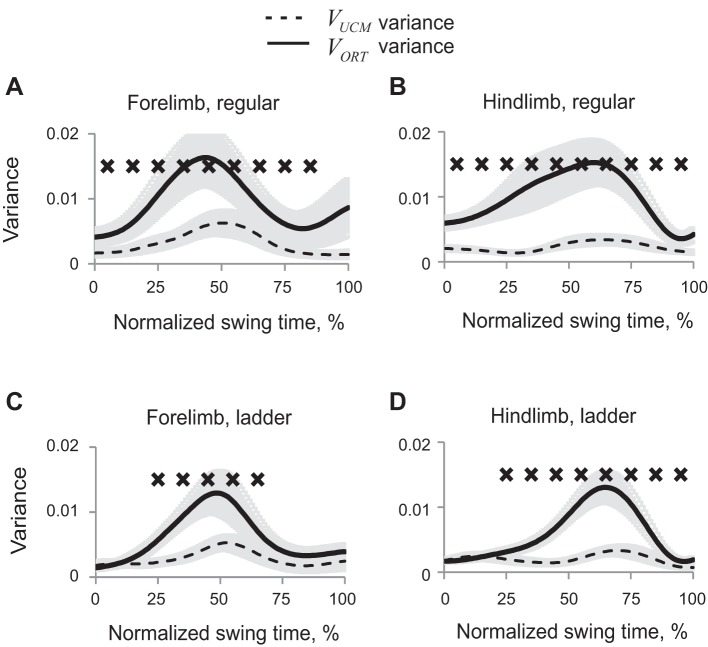
The obtained partition of synergy index ΔVx,y into VUCMx,y and VORTx,y showed that VUCMx,y (not affecting 2D paw position) exceeded VORTx,y (Wilcoxon matched-pairs test, Z = 2.02, n = 5, P < 0.05) in those phases of swing in which ΔVx,y was positive (Fig. 7). ANOVA performed on z-transformed VUCM values revealed significant effect of swing time (F9,36 = 6.48, P < 0.05), time-limb interaction (F9,36 = 2.7, P < 0.05), and no significant effect of limb or walking condition. VORT was significantly affected by swing time (F9,36 = 19.9, P < 0.05) and by time-limb (P < 0.05, F9,36 = 5.25) and time-task (P < 0.05, F9,36 = 2.63) interactions. The limb-task interaction effect was not significant (P = 0.05, F1,4 = 7.68).
Fig. 7.
Patterns of good (VUCM, dashed line) and bad variance (VORT, solid line) (mean ± SE, 5 cats) computed for the 2D paw position in space of 5 elemental variables. A: forelimb, regular walking. B: hindlimb, regular walking. C: forelimb, ladder walking. D: hindlimb, ladder walking. X's indicate 10% time bins of swing for which VUCM is significantly greater than VORT (P < 0.05).
Paw vertical position in 5D space of elemental variables.
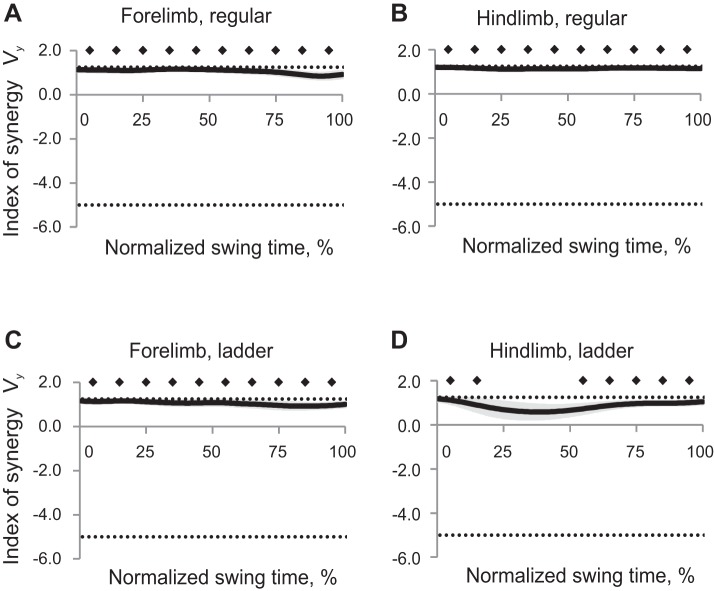
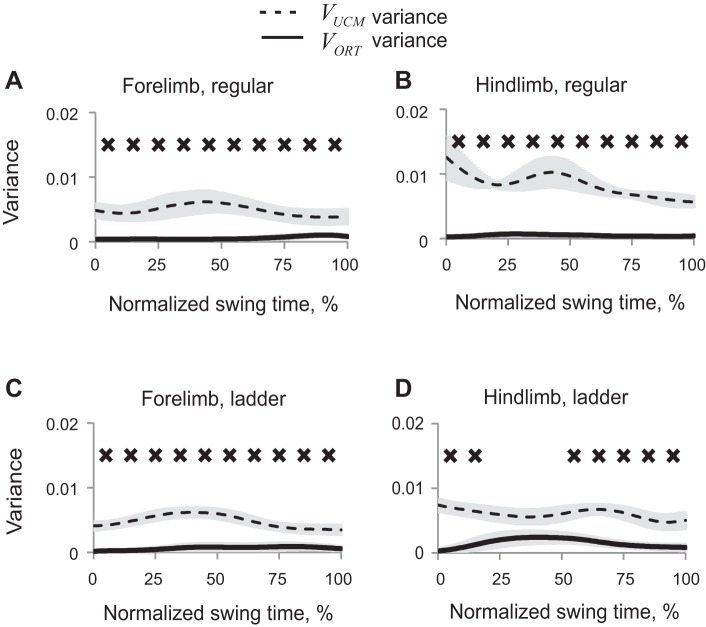
Mean synergy index ΔVy computed across all cats for each task and limb had positive values (Wilcoxon matched-pairs test, Z = 2.02, n = 5, P < 0.05), approaching the theoretical maximum 1.25 throughout the entire swing for both limbs and walking tasks, except for hindlimb during midswing of ladder walking (Fig. 8). Thus forepaw and hindpaw vertical position was highly stabilized during swing phase of regular and ladder walking, whereas hindpaw vertical position was not stabilized in midswing (30–50% of swing time) of ladder walking. ANOVA performed on z-transformed ΔVy values demonstrated a significant effect of swing time (F9,36 = 6.45, P < 0.05); the index of synergy ΔVy averaged across limbs and walking conditions for each time bin was higher in early swing (10%) than later in swing (30–100% of swing time, Fig. 6B). Locomotion task also significantly affected ΔVy (F1,4 = 12.2; P < 0.05), as the synergy index during regular walking was higher than during ladder walking. There were also significant time-limb (F9,36 = 15.1; P < 0.05) and time-task (F9,36 = 3.55; P < 0.05) interaction effects on ΔVy.
Fig. 8.
Index of synergy ΔVy as a function of the normalized swing time (mean ± SE, 5 cats) computed for the vertical paw position in space of 5 elemental variables. A: forelimb, regular walking. B: hindlimb, regular walking. C: forelimb, ladder walking. D: hindlimb, ladder walking. The top horizontal dotted line indicates the theoretical maximum of ΔVy (1.25); the bottom dotted line indicates the theoretical minimum of ΔVy (−5.0, see text for details). Solid diamonds indicate 10% time bins of swing for which ΔVy is significantly different from zero (P < 0.05).
Patterns of VUCM for the vertical paw position (Fig. 9) were generally similar to those of the 2D paw position (Fig. 7), which was not the case for VORTy values (Fig. 9) that were close to zero throughout most of swing, except for midswing of hindpaw during ladder walking.
Fig. 9.
Patterns of good (VUCM, dashed line) and bad variance (VORT, solid line) (mean ± SE, 5 cats) computed for the vertical paw position in space of 5 elemental variables. A: forelimb, regular walking. B: hindlimb, regular walking. C: forelimb, ladder walking. D: hindlimb, ladder walking. X's indicate 10% time bins of swing for which VUCM is significantly greater than VORT (P < 0.05).
Paw horizontal position in 5D space of elemental variables.
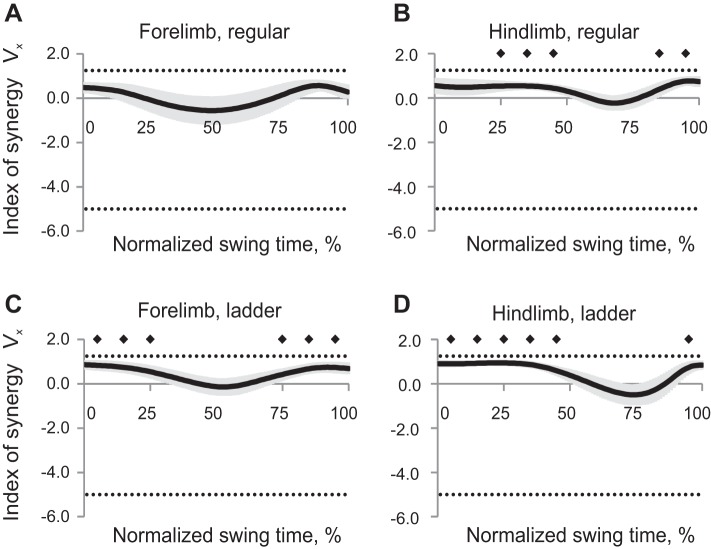
Values of synergy index ΔVx were positive (horizontal paw position was stabilized) in early and late swing of ladder walking for both fore- and hindpaw; they were also positive in mid- and late swing of hindpaw during regular walking (Wilcoxon matched-pairs test, Z = 2.02, n = 5, P < 0.05, Fig. 10). Synergy index was not different from zero during the entire swing for forepaw of regular walking. Z-transformed ΔVx values were significantly affected by swing time (ANOVA, F9,36 = 14.88, P < 0.05); the index of synergy ΔVx averaged across limbs and walking conditions for each time bin was higher in early (0–40%) and late swing (80–100%) than in midswing (50–70%, Fig. 6C). There was a significant time-limb interaction (F9,36 = 8.54; P < 0.05) and time-task interaction effect (F9,36 = 2.49; P < 0.05) on index of synergy ΔVx, and no significant effects of locomotion task or limb. Patterns of VUCMx and VORTx were generally similar to those determined for the 2D paw position with generally higher values of VORTx (not shown).
Fig. 10.
Index of synergy ΔVx as a function of the normalized swing time (mean ± SE, 5 cats) computed for the horizontal paw position in space of 5 elemental variables. A: forelimb, regular walking. B: hindlimb, regular walking. C: forelimb, ladder walking. D: hindlimb, ladder walking. The top horizontal dotted line indicates the theoretical maximum of ΔVx (1.25); the bottom dotted line indicates the theoretical minimum of ΔVx (−5.0, see text for details). Solid diamonds indicate 10% time bins of swing for which ΔVx is significantly different from zero (P < 0.05).
Limb length in 3D space of elemental variables.
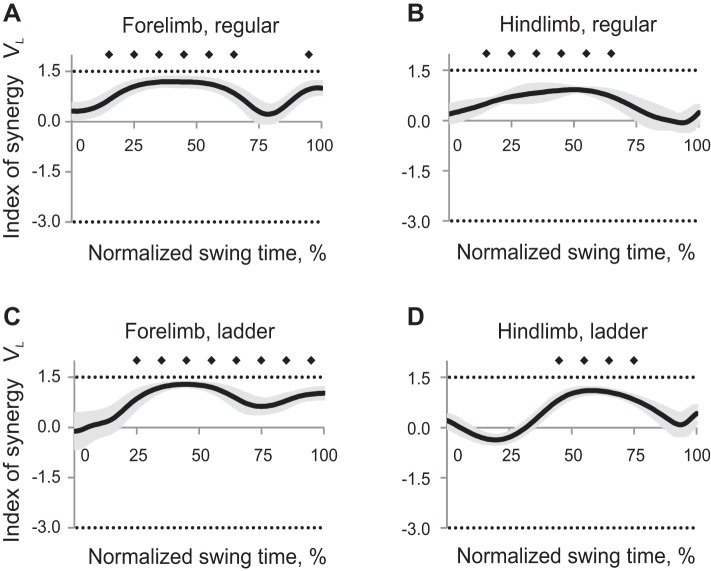
Length of forelimb and hindlimb was stabilized during midswing of regular and ladder walking as index of synergy was positive (Wilcoxon matched-pairs test, Z = 2.02, n = 5, P < 0.05) and close to the maximum value 1.5 (Fig. 11). Forelimb length was also stabilized in late swing of regular and ladder walking. ANOVA performed on z-transformed ΔVL values showed that limb length stabilization was significantly affected by swing time (F9,36 = 12.74, P < 0.05, Fig. 6D); the index of synergy ΔVL averaged across limbs and walking conditions for each time bin was higher in midswing (time bins 5 and 6) than in early or late swing. Limb also had a significant effect on index of synergy (F1,4 = 34.19; P < 0.05): ΔVL for forelimb was higher than for hindlimb. There was a significant time-limb interaction (F9,36 = 4.57; P < 0.05) and time-task interaction effects on index of synergy ΔVL (F9,36 = 4.79; P < 0.05).
Fig. 11.
Index of synergy ΔVL as a function of the normalized swing time (mean ± SE, 5 cats) computed for the limb length in space of 3 elemental variables. A: forelimb, regular walking. B: hindlimb, regular walking. C: forelimb, ladder walking. D: hindlimb, ladder walking. The top horizontal dotted line indicates the theoretical maximum of ΔVL (1. 5); the bottom dotted line indicates the theoretical minimum of ΔVL (−3.0, see text for details). Solid diamonds indicate 10% time bins of swing for which ΔVL is significantly different from zero (P < 0.05).
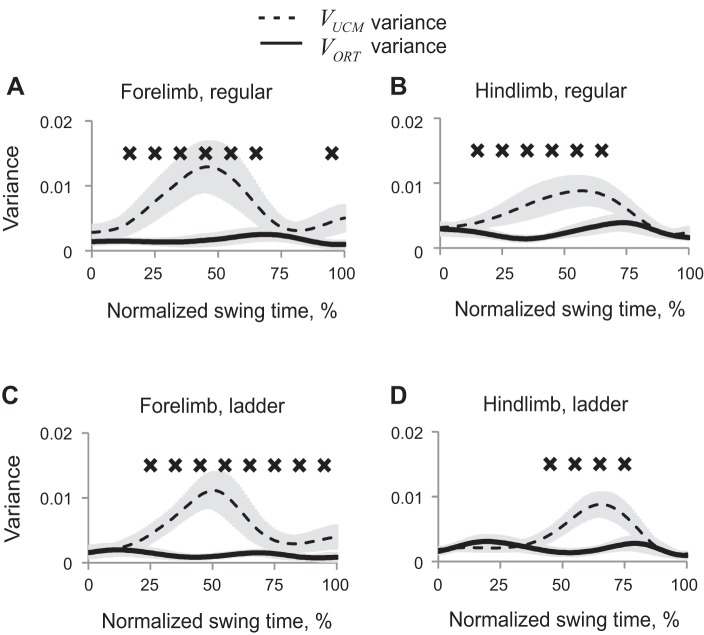
High levels of limb length stabilization in midswing resulted from elevated VUCML variance during that phase of movement, while VORTL values remained relatively constant throughout swing (Fig. 12).
Fig. 12.
Patterns of good (VUCM, dashed line) and bad variance (VORT, solid line) (mean ± SE, 5 cats) computed for the limb length in space of 3 elemental variables. A: forelimb, regular walking. B: hindlimb, regular walking. C: forelimb, ladder walking. D: hindlimb, ladder walking. X's indicate 10% time bins of swing for which VUCM is significantly greater than VORT (P < 0.05).
Limb orientation in 3D space of elemental variables.
Values of synergy index ΔVθ computed for orientation of fore- and hindlimbs during regular and ladder walking were often negative (Wilcoxon matched-pairs test, Z = 2.02, n = 5, P < 0.05) except for short time periods in early swing (fore- and hindlimb during ladder walking) and late swing (forelimb during regular and ladder walking, Fig. 13). Negative synergy index indicates that leg orientation was not actively stabilized during most of swing. ANOVA performed on z-transformed ΔVθ values demonstrated a significant effect of swing time (F9,36 = 3.43, P < 0.05, Fig. 6E); the index of synergy ΔVθ averaged across limbs and walking conditions for each time bin was higher at 10% of swing time than at 40–60% of swing phase (Fig. 6E). Although there was no significant effect of locomotor task or limb on ΔVθ, there was significant time-limb interaction (F9,36 = 5.5; P < 0.05) and time-task interaction effects (F9,36 = 5.9; P < 0.05) on index of synergy ΔVθ.
Fig. 13.
Index of synergy ΔVθ as a function of the normalized swing time (mean ± SE, 5 cats) computed for the limb orientation in space of 3 elemental variables. A: forelimb, regular walking. B: hindlimb, regular walking. C: forelimb, ladder walking. D: hindlimb, ladder walking. The top horizontal dotted line indicates the theoretical maximum of ΔVθ (1. 5); the bottom dotted line indicates the theoretical minimum of ΔVθ (−3.0, see text for details). Solid diamonds indicate 10% time bins of swing for which ΔVθ is significantly different from zero (P < 0.05).
Large negative values of synergy index ΔVθ during midswing of regular and ladder walking for both forelimbs and hindlimbs resulted from the peak of VORTθ variance in midswing, while VUCMθ was not changing substantially during swing (Fig. 14).
Fig. 14.
Patterns of good (VUCM, dashed line) and bad variance (VORT, solid line) (mean ± SE, 5 cats) computed for the limb orientation in space of 3 elemental variables. A: forelimb, regular walking. B: hindlimb, regular walking. C: forelimb, ladder walking. D: hindlimb, ladder walking. X's indicate 10% time bins of swing for which VUCM is significantly smaller than VORT (P < 0.05).
DISCUSSION
This study is the first to demonstrate that cats organize the kinematics of locomotion based on the principle of abundance: they use variable time profiles of elemental variables (limb generalized coordinates) to ensure relatively reproducible trajectory of several limb kinematic variables during the swing phase. The indexes of synergy ΔVx,y, ΔVx, ΔVy, ΔVL, and ΔVθ computed for each potential performance variable indicate that the vertical paw position was most consistently stabilized throughout the swing phase of regular and ladder walking for both fore- and hindpaw (Fig. 8). Since the horizontal paw position was also stabilized in initial and late swing of ladder walking and the horizontal hindpaw position was stabilized in late and midswing of regular walking (Fig. 10), it can be concluded that cats stabilized 2D paw position most consistently in early and late swing (see also Fig. 5 and Fig. 6, A and C). Furthermore, length of fore- and hindlimb was stabilized (in intrinsic, body-centered rather than in extrinsic, world-centered coordinates) in midswing of both walking tasks (Figs. 6D and 11). The limb length stabilization in midswing appears to occur at the expense of greater VORTθ variability of limb orientation (Figs. 6, D and E, 12, and 14). Taken together, the above results suggest that the nervous system might stabilize different sets of performance variables at different movement phases.
None of the three hypotheses formulated in the Introduction received unambiguous support for the three identified performance variables: 2D paw position, vertical paw position and limb length. Indeed, while the cats stabilized the vertical paw trajectory (hypothesis 1), they did so for the entire swing phase only in three out of four studied combinations of limbs and walking conditions; hindpaw vertical position during ladder walking was stabilized only over the early and late phases of swing, not during the midswing. Similar conclusions could be drawn about stabilization of 2D paw position that occurred in early and late swing in three out of four limb-walking task combinations, and about limb length stabilization observed in midswing. Since synergy index ΔVy during regular walking exceeded that during ladder walking, hypothesis 2 was not supported for vertical paw position, although it was supported for 2D paw position and limb length. Finally, hypothesis 3 was supported for limb length stabilization because ΔVL for forelimb was higher than for hindlimb; however, hypothesis 3 was not supported for 2D and vertical paw positions.
There are two major views on the problem of motor redundancy. One of them follows the classical formulation of Bernstein (1967) that the CNS “eliminates redundant degrees-of-freedom”; it assumes that single solutions are generated by the CNS, possibly based on an optimization principle (reviewed in Prilutsky and Zatsiorsky 2002; Seif-Naraghi and Winters 1990). The alternative view is that no DOF are ever eliminated, but they are all used in a covarying fashion to ensure stable performance with respect to important variables (principle of abundance, reviewed in Latash 2012). The UCM hypothesis has been developed based on the idea of abundance (Scholz and Schoner 1999) and applied to a variety of levels of analysis and tasks performed by different human populations (reviewed in Latash et al. 2007). The present study is the first one to show that the principle of abundance is not specific to human motor control, and that the method of UCM analysis can be successfully used to analyze movements of other animals. Animal models in combination with UCM analysis permit now the mechanistic studies of neural structures responsible for organizing motor synergies.
Several studies applied the method of analysis of joint covariation to whole body kinematics during human cyclic actions, such as rhythmic swaying (Freitas et al. 2006) and locomotion (Krishnan et al. 2013; Verrel et al. 2010). In particular, the latter two studies documented multijoint coordination stabilizing features of the step parameters and foot trajectory over the swing cycle.
The control of paw 2D position prior to paw placement during walking may be expected, given that cats [according to preliminary results (Rivers et al. 2010)] and humans (Patla and Vickers 2003) fix gaze at an intended stepping location two strides (in cats) or one stride (in humans) ahead of forepaw/foot placement. In addition, humans use the lower visual field to monitor foot trajectory during late swing of walking and use this information to improve accuracy of visually guided stepping (Marigold and Patla 2008; Reynolds and Day 2005). During accurate stepping, cats shift and rotate the head closer to the ground, presumably for a better view of the intended paw placement position (Beloozerova et al. 2010). Ensuring low variability of the paw 2D coordinates immediately prior to ground contact could also be expected because accurate paw placement is necessary for dynamically stable locomotion. Walking can be considered dynamically unstable if the vertical projection of the extrapolated center of mass of the body (that incorporates center of mass position and velocity) is beyond the base of support (Hof et al. 2005). To recover balance in this situation, the foot must be placed in front of the extrapolated center of mass and “in order to walk stable and in a straight path, the foot … has to be placed with an accuracy of a few millimetres” (p. 257: Hof et al. 2007). A recent study on dynamic stability in walking cats (Farrell et al. 2011, 2014) indicates that the cat is dynamically unstable in the sagittal plane (the extrapolated center of mass is in front of the base of support) during the short phases of double support by diagonal fore- and hindlimbs. The forward fall of the cat is prevented by placement of the swing forepaw in front of the extrapolated center of mass during both regular walking and walking with a constrained stance width (Farrell et al. 2011, 2014). Hindpaw accurate placement in front of the extrapolated center of mass in the frontal plane may also be important for maintaining body lateral stability at the transition from a double support period by ipsilateral fore- and hindlimbs to a three-legged support period (Farrell et al. 2014). Thus covarying limb segment angles (and possibly other elemental variables) to ensure reproducible paw position prior to paw placement seems important not only for accurate stepping, but also for regular walking.
The need to stabilize paw position during the first half of swing is less intuitive, especially because paw horizontal position is stabilized much less for hindlimb during regular walking (Fig. 10) or not at all (forelimb during regular walking, Fig. 10). This result can be explained by 1) considering that paw placement location is planned prior to swing onset (Hollands and Marple-Horvat 2001; 1996; Patla and Vickers 2003); and 2) assuming that accuracy of paw preplanned stepping depends to a large extent on accurate estimation of paw initial position, which is not under direct visual control for either fore- or hindlimb in early swing.
More vigorous stabilization of 2D paw position in final swing stages may be needed to adjust paw position prior to ground contact since the paw placement location estimated prior to swing initiation may be outdated. Feedback corrections of paw trajectory seem more useful in late swing than in midswing if no major motion perturbation or obstacle appearance is expected. In such a situation, humans start correcting foot trajectory for accurate target stepping in the last 120 ms of the swing phase (Reynolds and Day 2005), the period consistent with the reaction time to simple visual stimuli. In cats this type of reaction time is faster, 60–70 ms (Pettersson 1990), given shorter distances for propagation of neural signals. With reaction time of 65 ms, paw trajectory corrections would be expected to start at about 75–80% of swing time because, in our experiments, the swing durations were between 247 and 285 ms (Table 3). The obtained high positive values of the index of synergy ΔVx,y for 2D paw position in late swing agree with these estimates (see Fig. 5).
A recent study of kinematic synergies stabilizing the foot trajectory during human locomotion has produced a different time profile of the synergy index: the index showed a peak in midswing and dropped close to the toe-off and heel-strike phases (Krishnan et al. 2013). While there are major differences in the design of the two studies, given that only a handful of studies applied the UCM-based method for analysis of kinematic synergies, comparing the results is warranted. In particular, the Krishnan et al. study analyzed synergy indexes with respect to the mediolateral foot trajectory only, while our study explored the paw trajectory in two dimensions in the sagittal plane. In addition, the bipedal walking of humans is associated with higher demands for stability and a higher ability to rely on vision for guiding foot placement during stepping, in particular compared with motion of the hindlimbs in cats. Also, the differences in the synergy indexes may reflect different ecological values of accurate stepping in cats and humans. While cats frequently navigate complex terrains with highly constrained support surfaces, modern humans typically walk in conditions where accurate foot placement is not crucial. In contrast, in midswing, high stabilization of the mediolateral foot trajectory in humans may reflect the desire to avoid collision with the supporting leg.
One of the identified performance variables in this study, the limb length, was also stabilized mostly in midswing (Fig. 11). This stabilization could be related to the requirement of safe paw-ground clearance during midswing. High level of stabilization of vertical paw position throughout swing (Fig. 8) could contribute to both limb length stabilization in midswing and 2D paw position stabilization in early and late swing.
ANOVA revealed significantly higher index of synergy ΔVy during regular walking than during ladder walking, whereas ΔVL was found to be greater for forelimb than hindlimb. It has been demonstrated that, although forelimb kinematics during regular and skilled ladder walking are virtually identical (Beloozerova et al. 2010), the neural control mechanisms of these tasks are likely different. Regular walking can be performed without visual feedback (Beloozerova and Sirota 1993a), after lesion of motor cortex (Beloozerova and Sirota 1993a; Liddell and Phillips 1944) and in decerebrate (Shik et al. 1966) and spinal (Rossignol 2006) cats, whereas walking on a horizontal ladder is impossible in those conditions. Also, the modulation of neuronal activity from forelimb and hindlimb representations in the motor cortex is typically much higher during ladder walking (Armstrong and Marple-Horvat 1996; Beloozerova et al. 2010; Beloozerova and Sirota 1993a, 1993b; Drew et al. 2008). These data suggest that successful accurate stepping by the forelimbs requires visual input, which is integrated with motor cortical output. Thus different neural mechanisms involved in control of fore- and hindlimb movements during regular walking and accurate stepping appear to have differential effects on stabilization of paw position and limb length in several parts of the swing phase. The neural mechanisms responsible for hindpaw position stabilization may involve the asymmetric coupling between fore- and hindlimb locomotor pattern-generating networks (Juvin et al. 2012) and entrainment of hindlimb muscle activity by forelimbs during walking (Akay et al. 2006), also shown during postural corrections (Deliagina et al. 2006).
The combination of the nearly identical kinematics (Beloozerova et al. 2010) and modulation of indexes of synergy values (ΔVy, ΔVx,y, ΔVL, the present study) for the fore- and hindlimb swing trajectories during regular and ladder stepping (Figs. 5, 8, 11) fit the scheme of the control of redundant systems that assumes the presence of two major groups of variables (Latash 2010; Latash et al. 2005). One of them defines the time evolution of important task-specific performance variables, likely by generating neural signals that translate into trajectories of referent values for those variables. The other defines stability properties of those variables. Several studies of both kinematic and kinetic variables in humans have shown that the same performance can be associated with significantly different indexes of covariation among elemental variables (Freitas and Scholz 2009; Klous et al. 2011; Olafsdottir et al. 2005). Our present study shows that the ability of the CNS to modulate stability properties without changing the overall movement pattern is also present during cat locomotion.
Finally, it is important to note that the revealed high stabilization of three performance variables during fore- and hindlimb swing, 2D paw position, vertical paw position and limb length, is caused by different contributions of VUCM and VORT. For example, high stabilization of paw 2D position in early and late swing was caused by the low VORT rather than high VUCM (cf., Figs. 5 and 7), largest positive values of index of synergy ΔVx,y occur in phases similar to those in which VORT had the smallest values. This observation suggests that neural commands responsible for strong stabilization of paw trajectories during specific phases of swing tend to reduce deviations of limb segment configurations that affect paw position instead of increasing variability of segment angles that does not influence paw trajectory. This strategy seems to promote less variable, more stereotypic joint angle patterns in locomotion phases where stabilization of swing paw position is important. On the other hand, high values of index of synergy for limb length ΔVL in midswing (Fig. 11) resulted from increased VUCM and small changes in VORT (Fig. 12), indicating the opposite strategy of stabilization of this performance variable. Note that human experiments have provided evidence for increased VUCM during movements to uncertain targets and practice in conditions of instability (de Freitas et al. 2007; Freitas and Scholz 2009; Wu et al. 2012). The differences in patterns of VUCM and VORT for endpoint limb position between human movements and cat walking could reflect relatively high dynamic stability of quadrupedal locomotion (Farrell et al. 2011; Farrell et al. 2014).
In conclusion, we would like to acknowledge certain shortcomings of the present study. The first, and most obvious, one is the small number of animals that could potentially preclude us from reaching significance in some statistical tests. We would like to mention, however, that a large number of tests, in particular those directly related to testing the specific hypotheses, did lead to significant results. Hence, we can conclude that the sample sizes in our comparisons were sufficiently large. Second, we analyzed only a subset of kinematic variables potentially important for locomotion. For example, trajectory of the center of mass was not analyzed as a potential variable stabilized by multijoint synergies. This is partly due to problems in building a kinematic model that would link center of mass velocity to joint velocities, given that the center of mass location within the body migrates during locomotion and the spine kinematics cannot be easily reduced to a few fixed joint rotations. Third, it is possible that, due to temporal variability across strides, comparability of limb postures at specific time instances of swing could be compromised, particularly in midswing, when joint velocities are relatively high. This could have potentially had an impact on our analyses by adding spatial variance related to imprecise time alignment across strides. These effects, however, were likely small, because the temporal variability of elemental and potential performance variables was low (Figs. 2 and 3). Fourth, we used only one method of assessment of multijoint synergies. Other methods (for example, Muller and Sternad 2003; Verrel 2011; Yen and Chang 2010) could provide complementary information on the control of the kinematics of cat locomotion.
GRANTS
This work was partly supported by National Institutes of Health Grants HD-32571 and EB-012855 (to B. I. Prilutsky) and NS-058659 (to I. N. Beloozerova), and the Center for Human Movement Studies at Georgia Tech.
DISCLOSURES
No conflicts of interest, financial or otherwise, are declared by the author(s).
AUTHOR CONTRIBUTIONS
Author contributions: A.N.K., B.J.F., I.N.B., and B.I.P. performed experiments; A.N.K. and B.J.F. analyzed data; A.N.K., I.N.B., M.L.L., and B.I.P. interpreted results of experiments; A.N.K. prepared figures; A.N.K. and B.I.P. drafted manuscript; A.N.K., B.J.F., I.N.B., M.L.L., and B.I.P. approved final version of manuscript; B.J.F., I.N.B., M.L.L., and B.I.P. edited and revised manuscript; I.N.B., M.L.L., and B.I.P. conception and design of research.
ACKNOWLEDGMENTS
Authors are indebted to Erik E. Stout, Dr. Mikhail G. Sirota and Dr. Guay-haur Shue for help with data collection and technical assistance.
Present address of B. J. Farrell: Hulse Spinal Cord Injury Lab, Shepherd Center, 2020 Peachtree Rd. NW, Atlanta, GA 30309-1465.
REFERENCES
- Akay T, McVea DA, Tachibana A, Pearson KG. Coordination of fore and hind leg stepping in cats on a transversely-split treadmill. Exp Brain Res 175: 211–222, 2006 [DOI] [PubMed] [Google Scholar]
- Armstrong DM, Marple-Horvat DE. Role of the cerebellum and motor cortex in the regulation of visually controlled locomotion. Can J Physiol Pharmacol 74: 443–455, 1996 [PubMed] [Google Scholar]
- Auyang AG, Yen JT, Chang YH. Neuromechanical stabilization of leg length and orientation through interjoint compensation during human hopping. Exp Brain Res 192: 253–264, 2009 [DOI] [PubMed] [Google Scholar]
- Bauman JM, Chang YH. Rules to limp by: joint compensation conserves limb function after peripheral nerve injury. Biol Lett 9: 20130484, 2013 [DOI] [PMC free article] [PubMed] [Google Scholar]
- Beloozerova IN, Farrell BJ, Sirota MG, Prilutsky BI. Differences in movement mechanics, electromyographic, and motor cortex activity between accurate and nonaccurate stepping. J Neurophysiol 103: 2285–2300, 2010 [DOI] [PMC free article] [PubMed] [Google Scholar]
- Beloozerova IN, Sirota MG. The role of the motor cortex in the control of accuracy of locomotor movements in the cat. J Physiol 461: 1–25, 1993a [DOI] [PMC free article] [PubMed] [Google Scholar]
- Beloozerova IN, Sirota MG. The role of the motor cortex in the control of vigour of locomotor movements in the cat. J Physiol 461: 27–46, 1993b [DOI] [PMC free article] [PubMed] [Google Scholar]
- Berkinblit MB, Feldman AG, Fukson OI. Adaptability of innate motor patterns and motor control mechanisms. Behav Brain Sci 9: 585–638, 1986 [Google Scholar]
- Bernstein NA. The Co-ordination and Regulation of Movements. Oxford, UK: Pergamon, 1967 [Google Scholar]
- Bernstein NA. [Studies on biomechanics of hitting using optical recordings]. Ann Central Institute Labor 1: 19–79, 1923 [Google Scholar]
- Bobath B. Adult Hemiplegia: Evaluation and Treatment. London: Heinemann, 1978 [Google Scholar]
- Bosco G, Poppele RE, Eian J. Reference frames for spinal proprioception: limb endpoint based or joint-level based? J Neurophysiol 83: 2931–2945, 2000 [DOI] [PubMed] [Google Scholar]
- Boyce VS, Lemay MA. Modularity of endpoint force patterns evoked using intraspinal microstimulation in treadmill trained and/or neurotrophin-treated chronic spinal cats. J Neurophysiol 101: 1309–1320, 2009 [DOI] [PMC free article] [PubMed] [Google Scholar]
- Chang YH, Auyang AG, Scholz JP, Nichols TR. Whole limb kinematics are preferentially conserved over individual joint kinematics after peripheral nerve injury. J Exp Biol 212: 3511–3521, 2009 [DOI] [PMC free article] [PubMed] [Google Scholar]
- de Freitas SM, Scholz JP, Stehman AJ. Effect of motor planning on use of motor abundance. Neurosci Lett 417: 66–71, 2007 [DOI] [PMC free article] [PubMed] [Google Scholar]
- Deliagina TG, Sirota MG, Zelenin PV, Orlovsky GN, Beloozerova IN. Interlimb postural coordination in the standing cat. J Physiol 573: 211–224, 2006 [DOI] [PMC free article] [PubMed] [Google Scholar]
- Dewald JP, Pope PS, Given JD, Buchanan TS, Rymer WZ. Abnormal muscle coactivation patterns during isometric torque generation at the elbow and shoulder in hemiparetic subjects. Brain 118: 495–510, 1995 [DOI] [PubMed] [Google Scholar]
- Dingwell JB, Robb RT, Troy KL, Grabiner MD. Effects of an attention demanding task on dynamic stability during treadmill walking. J Neuroeng Rehabil 5: 12, 2008 [DOI] [PMC free article] [PubMed] [Google Scholar]
- Domkin D, Laczko J, Djupsjobacka M, Jaric S, Latash ML. Joint angle variability in 3D bimanual pointing: uncontrolled manifold analysis. Exp Brain Res 163: 44–57, 2005 [DOI] [PubMed] [Google Scholar]
- Drew T, Andujar JE, Lajoie K, Yakovenko S. Cortical mechanisms involved in visuomotor coordination during precision walking. Brain Res Rev 57: 199–211, 2008 [DOI] [PubMed] [Google Scholar]
- Farrell BJ, Bulgakova M, Sirota MG, Prilutsky BI, Beloozerova IN. Frontal plane mechanics and activity of motor cortex during locomotion tasks with challenging requirements for lateral stability. Program No. 710.710. In: 2011 Neuroscience Meeting Planner. Washington, DC: Society for Neuroscience; 2011 [Google Scholar]
- Farrell BJ, Bulgakova MA, Beloozerova IN, Sirota MG, Prilutsky BI. Body stability and muscle and motor cortex activity during walking with wide stance. J Neurophysiol. In press, 2014 [DOI] [PMC free article] [PubMed] [Google Scholar]
- Freitas SM, Duarte M, Latash ML. Two kinematic synergies in voluntary whole-body movements during standing. J Neurophysiol 95: 636–645, 2006 [DOI] [PubMed] [Google Scholar]
- Freitas SM, Scholz JP. Does hand dominance affect the use of motor abundance when reaching to uncertain targets? Hum Mov Sci 28: 169–190, 2009 [DOI] [PMC free article] [PubMed] [Google Scholar]
- Galvez-Lopez E, Maes LD, Abourachid A. The search for stability on narrow supports: an experimental study in cats and dogs. Zoology (Jena) 114: 224–232, 2011 [DOI] [PubMed] [Google Scholar]
- Gelfand IM, Latash ML. On the problem of adequate language in motor control. Motor Control 2: 306–313, 1998 [DOI] [PubMed] [Google Scholar]
- Goodman SR, Latash ML. Feed-forward control of a redundant motor system. Biol Cybern 95: 271–280, 2006 [DOI] [PubMed] [Google Scholar]
- Gorniak SL, Duarte M, Latash ML. Do synergies improve accuracy? A study of speed-accuracy trade-offs during finger force production. Motor Control 12: 151–172, 2008 [DOI] [PMC free article] [PubMed] [Google Scholar]
- Gregor RJ, Smith DW, Prilutsky BI. Mechanics of slope walking in the cat: quantification of muscle load, length change, and ankle extensor EMG patterns. J Neurophysiol 95: 1397–1409, 2006 [DOI] [PubMed] [Google Scholar]
- Hof AL, Gazendam MG, Sinke WE. The condition for dynamic stability. J Biomech 38: 1–8, 2005 [DOI] [PubMed] [Google Scholar]
- Hof AL, van Bockel RM, Schoppen T, Postema K. Control of lateral balance in walking. Experimental findings in normal subjects and above-knee amputees. Gait Posture 25: 250–258, 2007 [DOI] [PubMed] [Google Scholar]
- Hollands MA, Marple-Horvat DE. Coordination of eye and leg movements during visually guided stepping. J Mot Behav 33: 205–216, 2001 [DOI] [PubMed] [Google Scholar]
- Hollands MA, Marple-Horvat DE. Visually guided stepping under conditions of step cycle-related denial of visual information. Exp Brain Res 109: 343–356, 1996 [DOI] [PubMed] [Google Scholar]
- Hultborn H, Brownstone RB, Toth TI, Gossard JP. Key mechanisms for setting the input-output gain across the motoneuron pool. Prog Brain Res 143: 77–95, 2004 [DOI] [PubMed] [Google Scholar]
- Juvin L, Le Gal JP, Simmers J, Morin D. Cervicolumbar coordination in mammalian quadrupedal locomotion: role of spinal thoracic circuitry and limb sensory inputs. J Neurosci 32: 953–965, 2012 [DOI] [PMC free article] [PubMed] [Google Scholar]
- Kapur S, Friedman J, Zatsiorsky VM, Latash ML. Finger interaction in a three-dimensional pressing task. Exp Brain Res 203: 101–118, 2010 [DOI] [PMC free article] [PubMed] [Google Scholar]
- Klous M, Mikulic P, Latash ML. Two aspects of feedforward postural control: anticipatory postural adjustments and anticipatory synergy adjustments. J Neurophysiol 105: 2275–2288, 2011 [DOI] [PMC free article] [PubMed] [Google Scholar]
- Krishnan V, Rosenblatt NJ, Latash ML, Grabiner MD. The effects of age on stabilization of the mediolateral trajectory of the swing foot. Gait Posture 38: 923–928, 2013 [DOI] [PubMed] [Google Scholar]
- Latash ML. The bliss (not the problem) of motor abundance (not redundancy). Exp Brain Res 217: 1–5, 2012 [DOI] [PMC free article] [PubMed] [Google Scholar]
- Latash ML. Motor synergies and the equilibrium-point hypothesis. Motor Control 14: 294–322, 2010 [DOI] [PMC free article] [PubMed] [Google Scholar]
- Latash ML, Scholz JP, Schoner G. Toward a new theory of motor synergies. Motor Control 11: 276–308, 2007 [DOI] [PubMed] [Google Scholar]
- Latash ML, Shim JK, Smilga AV, Zatsiorsky VM. A central back-coupling hypothesis on the organization of motor synergies: a physical metaphor and a neural model. Biol Cybern 92: 186–191, 2005 [DOI] [PMC free article] [PubMed] [Google Scholar]
- Lavoie S, McFadyen B, Drew T. A kinematic and kinetic analysis of locomotion during voluntary gait modification in the cat. Exp Brain Res 106: 39–56, 1995 [DOI] [PubMed] [Google Scholar]
- Liddell EG, Phillips CG. Pyramidal section in the cat. Brain 67: 1–9, 1944 [Google Scholar]
- MacLellan MJ, Patla AE. Adaptations of walking pattern on a compliant surface to regulate dynamic stability. Exp Brain Res 173: 521–530, 2006 [DOI] [PubMed] [Google Scholar]
- Marigold DS, Patla AE. Visual information from the lower visual field is important for walking across multi-surface terrain. Exp Brain Res 188: 23–31, 2008 [DOI] [PubMed] [Google Scholar]
- Martin V, Scholz JP, Schoner G. Redundancy, self-motion, and motor control. Neural Comput 21: 1371–1414, 2009 [DOI] [PMC free article] [PubMed] [Google Scholar]
- McAndrew Young PM, Wilken JM, Dingwell JB. Dynamic margins of stability during human walking in destabilizing environments. J Biomech 45: 1053–1059, 2012 [DOI] [PMC free article] [PubMed] [Google Scholar]
- Metz GA, Whishaw IQ. Cortical and subcortical lesions impair skilled walking in the ladder rung walking test: a new task to evaluate fore- and hindlimb stepping, placing, and co-ordination. J Neurosci Methods 115: 169–179, 2002 [DOI] [PubMed] [Google Scholar]
- Miller S, Van Der Burg J, Van Der Meche F. Coordination of movements of the hindlimbs and forelimbs in different forms of locomotion in normal and decerebrate cats. Brain Res 91: 217–237, 1975 [DOI] [PubMed] [Google Scholar]
- Muller H, Sternad D. A randomization method for the calculation of covariation in multiple nonlinear relations: illustrated with the example of goal-directed movements. Biol Cybern 89: 22–33, 2003 [DOI] [PubMed] [Google Scholar]
- Mussa-Ivaldi FA, Giszter SF, Bizzi E. Linear combinations of primitives in vertebrate motor control. Proc Natl Acad Sci U S A 91: 7534–7538, 1994 [DOI] [PMC free article] [PubMed] [Google Scholar]
- Olafsdottir H, Yoshida N, Zatsiorsky VM, Latash ML. Anticipatory covariation of finger forces during self-paced and reaction time force production. Neurosci Lett 381: 92–96, 2005 [DOI] [PMC free article] [PubMed] [Google Scholar]
- Pantall A, Gregor RJ, Prilutsky BI. Stance and swing phase detection during level and slope walking in the cat: effects of slope, injury, subject and kinematic detection method. J Biomech 45: 1529–1533, 2012 [DOI] [PMC free article] [PubMed] [Google Scholar]
- Park J, Lewis MM, Huang X, Latash ML. Effects of olivo-ponto-cerebellar atrophy (OPCA) on finger interaction and coordination. Clin Neurophysiol 124: 991–998, 2013 [DOI] [PMC free article] [PubMed] [Google Scholar]
- Park J, Wu YH, Lewis MM, Huang X, Latash ML. Changes in multifinger interaction and coordination in Parkinson's disease. J Neurophysiol 108: 915–924, 2012 [DOI] [PMC free article] [PubMed] [Google Scholar]
- Patla AE, Greig M. Any way you look at it, successful obstacle negotiation needs visually guided on-line foot placement regulation during the approach phase. Neurosci Lett 397: 110–114, 2006 [DOI] [PubMed] [Google Scholar]
- Patla AE, Vickers JN. How far ahead do we look when required to step on specific locations in the travel path during locomotion? Exp Brain Res 148: 133–138, 2003 [DOI] [PubMed] [Google Scholar]
- Pettersson LG. Forelimb movements in the cat; kinetic features and neuronal control. Acta Physiol Scand Suppl 594: 1–60, 1990 [PubMed] [Google Scholar]
- Prilutsky BI, Sirota MG, Gregor RJ, Beloozerova IN. Quantification of motor cortex activity and full-body biomechanics during unconstrained locomotion. J Neurophysiol 94: 2959–2969, 2005 [DOI] [PubMed] [Google Scholar]
- Prilutsky BI, Zatsiorsky VM. Optimization-based models of muscle coordination. Exerc Sport Sci Rev 30: 32–38, 2002 [DOI] [PMC free article] [PubMed] [Google Scholar]
- Reisman DS, Scholz JP. Aspects of joint coordination are preserved during pointing in persons with post-stroke hemiparesis. Brain 126: 2510–2527, 2003 [DOI] [PubMed] [Google Scholar]
- Reynolds RF, Day BL. Visual guidance of the human foot during a step. J Physiol 569: 677–684, 2005 [DOI] [PMC free article] [PubMed] [Google Scholar]
- Rivers TJ, Shaw NA, Sirota MG, Beloozerova IN. The relationship between vertical gaze shifts and stride cycle in freely walking cats. Program No. 278.273 In: 2010 Neuroscience Meeting Planner San Diego, CA: Society for Neuroscience, 2010 [Google Scholar]
- Rossignol S. Plasticity of connections underlying locomotor recovery after central and/or peripheral lesions in the adult mammals. Philos Trans R Soc Lond B Biol Sci 361: 1647–1671, 2006 [DOI] [PMC free article] [PubMed] [Google Scholar]
- Scholz JP, Schoner G. The uncontrolled manifold concept: identifying control variables for a functional task. Exp Brain Res 126: 289–306, 1999 [DOI] [PubMed] [Google Scholar]
- Scholz JP, Schoner G, Latash ML. Identifying the control structure of multijoint coordination during pistol shooting. Exp Brain Res 135: 382–404, 2000 [DOI] [PubMed] [Google Scholar]
- Seif-Naraghi AH, Winters JM. Optimized strategies for scaling goal-directed dynamic limb movements. In: Multiple Muscle Systems Biomechanics and Movement Organization, edited by Winters JM, Woo SL-Y. New York: Springer-Verlag, 1990, p. 312–334 [Google Scholar]
- Shapkova EY, Shapkova AL, Goodman SR, Zatsiorsky VM, Latash ML. Do synergies decrease force variability? A study of single-finger and multi-finger force production. Exp Brain Res 188: 411–425, 2008 [DOI] [PMC free article] [PubMed] [Google Scholar]
- Shik ML, Severin FV, Orlovskii GN. [Control of walking and running by means of electric stimulation of the midbrain]. Biofizika 11: 659–666, 1966 [PubMed] [Google Scholar]
- Ting LH, McKay JL. Neuromechanics of muscle synergies for posture and movement. Curr Opin Neurobiol 17: 622–628, 2007 [DOI] [PMC free article] [PubMed] [Google Scholar]
- Todorov E, Jordan MI. Optimal feedback control as a theory of motor coordination. Nat Neurosci 5: 1226–1235, 2002 [DOI] [PubMed] [Google Scholar]
- Verrel J. A formal and data-based comparison of measures of motor-equivalent covariation. J Neurosci Methods 200: 199–206, 2011 [DOI] [PubMed] [Google Scholar]
- Verrel J, Lovden M, Lindenberger U. Motor-equivalent covariation stabilizes step parameters and center of mass position during treadmill walking. Exp Brain Res 207: 13–26, 2010 [DOI] [PubMed] [Google Scholar]
- Wu YH, Pazin N, Zatsiorsky VM, Latash ML. Practicing elements vs. practicing coordination: changes in the structure of variance. J Mot Behav 44: 471–478, 2012 [DOI] [PMC free article] [PubMed] [Google Scholar]
- Yang JF, Scholz JP. Learning a throwing task is associated with differential changes in the use of motor abundance. Exp Brain Res 163: 137–158, 2005 [DOI] [PubMed] [Google Scholar]
- Yen JT, Chang YH. Rate-dependent control strategies stabilize limb forces during human locomotion. J R Soc Interface 7: 801–810, 2010 [DOI] [PMC free article] [PubMed] [Google Scholar]


