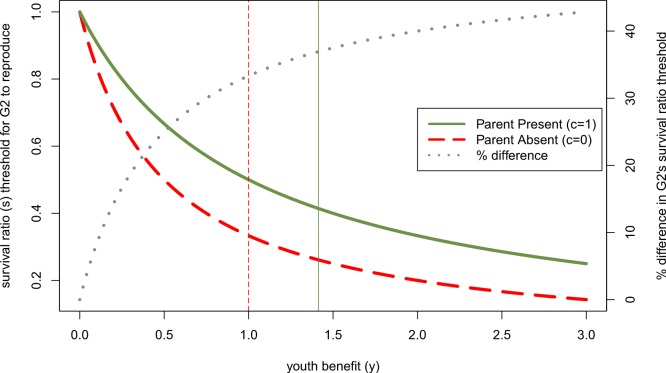
Figure 3. Effect of other parent’s absence (parental continuity, c, is 0 rather than 1) on adolescent’s willingness to reproduce if her parent has done so, as a function of youth benefit.
Green and red curves denote minimum survival ratios (s) at which adolescent will reproduce, derived from Eq. (7). When the second parent is absent, the adolescent will reproduce for a larger part of the parameter space. The dotted grey line (plotted on the right axis) shows that the relative size of the parental absence effect increases with the youth benefit (y)—i.e., the difference between these threshold levels of s when c = 1 relative to c = 0 as a percent of the effect when c = 1 increases with y. Vertical lines mark the y-values above which the parent becomes more reticent to add a 2nd infant to the household than the adolescent for the respective parental continuity values.

