Summary
Bacillus anthracis Edema Toxin (ET) and Bordetella pertussis Adenylate Cyclase Toxin (ACT) enter host cells and produce cAMP. To understand the cellular consequences, we exposed J774 cells to these toxins at ng/ml (pM) concentrations, then followed cell number and changes in cell signaling pathways. Under these conditions, both toxins produce a concentration-dependent inhibition of cell proliferation without cytotoxicity. ET and ACT increase the proportion of cells in G1/G0 and reduce S-phase, such that a single addition of ET or ACT inhibits cell division for 3 to 6 days. Treatment with ET or ACT produces striking changes in proteins controlling cell cycle, including virtual elimination of phosphorylated ERK 1/2 and Cyclin D1 and increases in phospho-CREB and p27Kip1. Importantly, PD98059, a MEK inhibitor, elicits a comparable reduction in Cyclin D1 to that produced by the toxins and blocks proliferation.
These data show that non-lethal concentrations of ET and ACT impose a prolonged block on the proliferation of J774 cells by impairment of the progression from G1/G0 to S-phase in a process involving cAMP-mediated increases in phospho-CREB and p27Kip1 and reductions in phospho-ERK 1/2 and Cyclin D1. This phenomenon represents a new mechanism by which these toxins affect host cells.
Introduction
Several bacteria produce adenylate cyclases, which can enter host cells and catalyze the production of the ubiquitous second messenger, cyclic AMP (cAMP). This feature is the basis for their being designated “adenylate cyclase toxins” and the most extensively characterized of these are produced by Bacillus anthracis and the Bordetella species, especially Bordetella pertussis (Hewlett and Gray, 2000;Ladant and Ullmann, 1999;Leppla, 1999;Vojtova et al., 2006a).
Anthrax Edema Toxin (ET) is composed of two separate proteins, edema factor (EF) and protective antigen (PA), which were first purified from the culture medium of B. anthracis by Smith, Keppie and Stanley (Smith et al., 1955). EF is a calmodulin-activated adenylate cyclase (Leppla, 1982). PA, which serves as the binding component of this toxin, interacts with one of two host-cell surface proteins, TEM8 (tumor endothelial marker 8) or CMG2 (the product of capillary morphogenesis gene 2) (Bradley et al., 2001;Scobie et al., 2003). The binding of PA heptamers by EF, initiates the process of receptor-mediated endocytosis, by which the entire complex is internalized and the adenylate cyclase is delivered to the cytoplasm (Gordon et al., 1988;Rainey et al., 2005;Zornetta et al., 2010). EF, its companion molecule, lethal factor (LF) and PA are released from B. anthracis during localized and systemic infections and are, therefore, disseminated throughout the body during anthrax bacteremia. It is likely that ET is responsible for the edema associated with cutaneous anthrax and it has been demonstrated to be lethal for mice, when administered intravenously (Firoved et al., 2005;Tessier et al., 2007). Voth et al. reported previously that ET causes tissue damage in specific organs of the zebrafish embryo and is cytotoxic for cultured mammalian cells, such as IC-21, RAW 264.7 and NIH/3T3 at microgram/ml concentrations (Voth et al., 2005). In further studies directed at identification of small-molecule inhibitors of the biological effects produced by ET, Larabee et al. noted that ET at >1000ng/ml affected the distribution of cells among the phases of the cell cycle, with largest change occurring in G2/M (Larabee et al., 2008).
Adenylate cyclase toxin (ACT) from B. pertussis and other bordetella species is a single polypeptide, which is released by a Type I secretion apparatus (CyaB, D and E) and activated through a post-translational acylation, which is catalyzed by CyaC (Barry et al., 1991;Glaser et al., 1988;Hackett et al., 1994;Hewlett et al., 1993). Intoxication of myeloid cells by ACT appears to involve an interaction with the integrin heterodimer, CD11b/CD18, which is expressed on these cells (Guermonprez et al., 2001;Hewlett et al., 2006)). However, ACT is capable of intoxicating other cell types that do not possess CD11b/CD18 (Bellalou et al., 1990;Eby et al., 2010;Vojtova et al., 2006b). Unlike ET, it is believed that ACT is delivered by bacteria in close proximity to the host target cell and translocates its catalytic domain across the cytoplasmic membrane in a process that is driven by the membrane potential of the target cell (Gray et al., 2004;Szabo et al., 1994). ACT, at concentrations greater than 30ng/ml but less than 1µg/ml, kills J774 cells by apoptosis (Hewlett et al., 2006). However, concentrations of ACT greater than 1µg/ml cause cell death by an additional, non-apopotic process, which is believed to reflect a synergistic effect of the hemolytic/pore-forming activity of this toxin along with its ability to increase intracellular cAMP and decrease intracellular ATP (Basler et al., 2006;Hewlett et al., 2006). While studying the effects of ACT and ET over this wide range of concentrations, we noticed that treatment of J774 cells with less than 30ng/ml of ACT or comparable concentrations of ET results in reduced cell numbers and an altered morphology, relative to control cells.
In the present studies, we found that 1 and 10ng/ml concentrations of adenylate cyclase toxins from both Bacillus anthracis and Bordetella pertussis inhibit the proliferation of the macrophage cell line, J774. Both toxins increase phosphorylation of Cyclic AMP Response-Element Binding (CREB) protein and decrease the phosphorylation of extracellular signal-regulated kinase (ERK) 1/2. These effects are mediated by toxin-produced cAMP, in part through cAMP-dependent Protein Kinase A (PKA), in that they do not occur in response to enzymatically inactive forms of either toxin and they are reduced in the presence of the PKA inhibitor H-89. In addition, treatment of cells with these toxins decreases the amount of Cyclin D1 and increases the level of p27Kip1, resulting in an accumulation of cells in G1/G0 and a decrease of cells in S phase. They differ, however, in kinetics and stoichiometry of the relationships between cAMP and cell cycle delay, raising new questions about the bases for their differences, as well as the possible roles they might have in the pathogenesis of pertussis and of anthrax.
Results
Inhibitory effects of ET and ACT on cell number
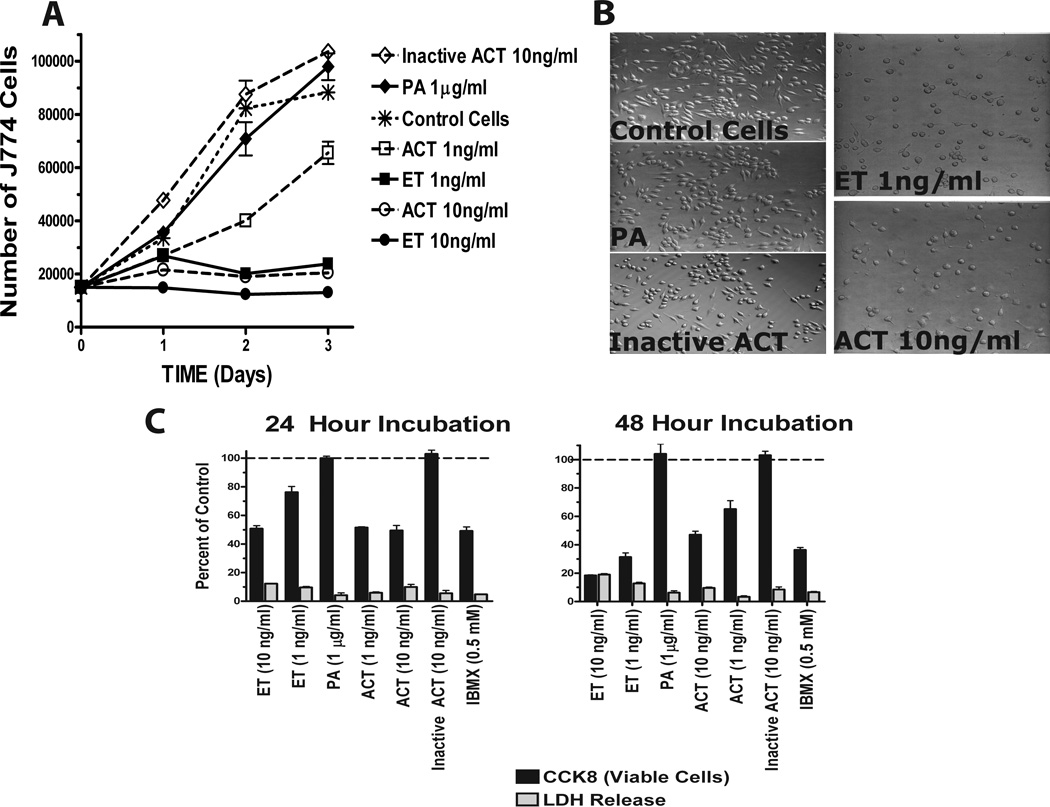
In the present studies, we examined the functional consequences of ACT (1–10 ng/ml, 5.7–57 pM) and ET (1–10ng/ml, 11.2–112 pM) on J774 cells. As shown in Figure 1A, control cells proliferate at a linear rate over the course of 3 days, while J774 cells treated with ET at 1 and 10ng/ml and ACT at 10ng/ml do not increase in number over this same time course. ACT at 1ng/ml induces a slower increase in cell number, only up to day 2, at which time the cells resume a linear rate of proliferation. PA alone, enzymatically inactive ET (data not shown), or enzymatically inactive ACT, serve as controls, and have no effect on growth (Figure 1A). In addition, cells treated with ET or ACT (1 and 10ng/ml, respectively) display a distinct morphologic change, appearing rounder and flatter (Figure 1B). To determine the nature of the toxin effect under these conditions, LDH release into the culture medium was measured and the number of viable cells quantified. Figure 1C demonstrates that there is a concentration and time-dependent decrease in the number of J774 cells with little or no LDH after 24 or 48 hours of exposure to active ACT or ET, suggesting that these concentrations of toxin are not cytotoxic but anti-proliferative. Again, there is no effect with PA or the inactive ACT and there is a similar inhibitory response on cell number elicited by the cAMP phosphodiesterase inhibitor, isobutylmethyl xanthine (IBMX). Taken together, these data strongly suggest that intracellular cAMP is involved in and likely responsible for the effects on proliferation produced by ET and ACT.
Figure 1. Although the number of J774 cells, as a function of time and exposure to ET and AC toxin, seems to decrease when compared to control cells, this decrease does not represent cell death but a lack of cell growth.
For panels A and D, J774 cells were plated in 96 well plates and allowed to adhere for 3 hours. Media was removed, replaced with fresh and toxins added. At indicated time, CCK8 was added and incubated an additional hour. A) Results are expressed as a percent of control cells which are actively dividing. D) Results are expressed as number of viable J774 cells as described in Experimental Procedures. B) J774 cells were treated with toxins for 24 hours at 37 ° C and visualized using an Olympus 1X71 inverted microscope. C) J774 cells were treated as indicated and CCK8 and LDH measured as described in Experimental Procedures. A, C and D represent the mean ± standard deviation of triplicate samples of a single experiments that are representative of at least 3 independent experiments.
Effects of ET and ACT on cell cycle
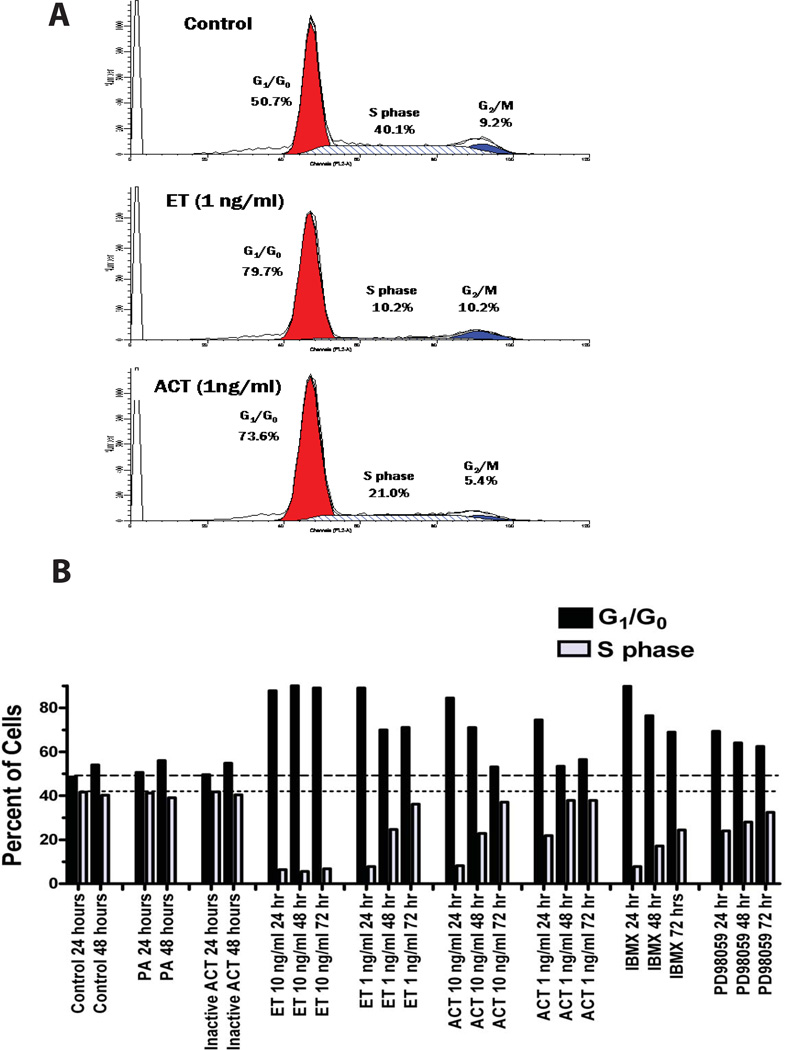
In order to characterize the inhibition of proliferation seen here, we used propidium iodide to quantify the amount of DNA in control and toxin-treated J774 cells. Analysis by flow cytometry revealed that treatment, with either ACT or ET, results in a higher proportion of cells in G1/G0, relative to untreated cells. At 24 hours, almost 80% of cells treated with ET and 74% of cells treated with ACT at 1ng/ml are in G1/G0, compared to 51% of control cells (Figure 2A). As a consequence, fewer cells are in S phase (10% of those treated with ET and 21% with ACT at 24 hours) compared to control cells (40%). Treatments with PA alone or enzymatically inactive ACT serve as negative controls and yield comparable values to those of untreated cells (Figure 2B). Notably, treatment with ET at 10ng/ml, results in a sustained increase in G1/G0-phase cells (80–90%) lasting for at least 72 hours and a concomitant reduction in S-phase cells (to 10% or less). The effect of ET at 1ng/ml is of shorter duration with the proportion of cells in G1/G0 decreasing and those in S phase, nearing control levels at 72 hours. ACT has a similar effect, but of relatively shorter duration; the cell cycle distributions of cells treated with 1 or 10ng/ml of ACT have returned to control values by 48 and 72 hours, respectively. IBMX has inhibitory effects of similarly short duration to those of ACT. When these data are considered in combination with those shown in Figure 1, it is clear that the primary effect of ET and ACT at these picomolar concentrations is to impair the ability of the J774 cells to progress normally though the cell cycle. That this phenomenon is mediated by increases in toxin-produced intracellular cAMP is established by the lack of effect on cell number or cell cycle progression by enzymatically inactive ACT or PA alone and the ability of IBMX to mimic the effect.
Figure 2. ET and AC toxin cause an increase in the proportion of J774 cells in G1/G0 and a reduction in S-phase that is cAMP dependent.
A) J774 cells were treated with ET or AC toxin for 24 hours and cell cycle measurements made as described in Experimental Procedures. B) J774 cells were treated as indicated for 24, 48, and 72 hours and the percentage of cells in G1/G0 and S-phase shown. Both panel A and B represent a single experiments but are representative of at least 4 independent experiments. The apparent differences between control and ACT-treated cells in G2/M in the representative experiment shown in panel A did not occur in aggregate data (G2/M for control cells = 7.7 ± 2.4% and for ACT-treated cells = 6.0 ± 2.5, n = 4, p = 0.378)
Duration of toxin effects on cell proliferation and intracellular cAMP
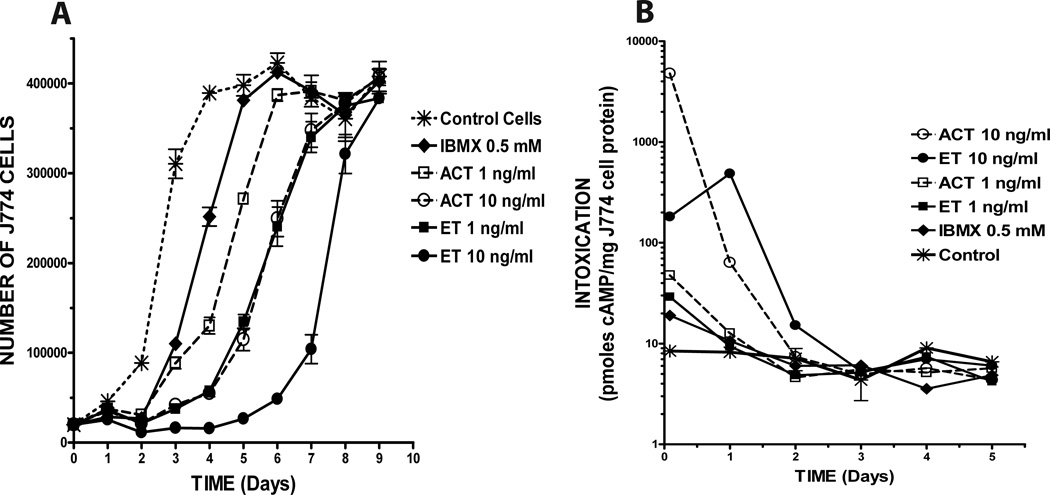
Since the effects of ET and ACT on cell cycle are sustained, with apparent differences in duration, a single 24-hour treatment was compared to conditions in which there is continuous exposure to each toxin. The initial experiments (described above) were conducted with continuous exposure to toxins over the course of 3 days; therefore, we compared results under those conditions with treatment of cells for 24 hours, followed by washing and incubation for an additional 24 or 48 hours without re-addition of toxins. There were no differences (within treatment groups) when cells were treated with ET, ACT or IBMX for the first 24 hours only versus with treatment left in place and no medium change (data not shown), indicating that the initial 24-hour exposure determines the ultimate outcome within this 72-hour window of observation. Since addition of fresh medium each 24 hours is important for valid assessment of cell growth, the remaining experiments were conducted with a single 24-hour exposure to toxin or IBMX, after which the medium was removed and replaced with fresh medium daily. Figure 3A shows the number of cells present at the end of each twenty four hour period over the course of nine days, in response to two concentrations (1 and 10ng/ml) of ET or ACT or IBMX at 0.5 mM. The proliferation profile for control cells, inoculated on Day 0 at 15,000 cells/well (asterisks with hashed line), reflects normal growth for these cells. Most strikingly, cells treated with 10ng/ml ET (closed circles with solid line) do not increase in number until Day 5–6 following toxin treatment and then reach exponential growth between days 7 and 8. The effects of 1ng/ml ET (closed boxes with solid line) and 10ng/ml ACT (open circles with dashed line) are indistinguishable over the entire time course, consistent with the differential potencies of the two toxins observed in initial experiments. Although similar to each other in the first twenty-four to forty-eight hours, the responses to IBMX (0.5mM; solid diamonds with solid line) and ACT (1ng/ml; open boxes with dashed line) diverge at three to four days, with ACT showing a modestly longer duration of effect. Thus, the primary actions of ET and ACT over the concentration range used in these studies are to block transition of cells from G1/G0 to S phase and the only apparent differences are their relative potencies and durations of effect.
Figure 3. A single 24 hour exposure to ET and AC toxin causes a long term effect on proliferation, the duration of which is concentration dependent but not necessarily cAMP-dependent.
J774 cells were plated as described in Experimental Procedures and treated with toxins at indicated concentrations for 24 hours. Cells were then washed and media was replaced every 24 hours for the duration of the experiment. A) Number of viable cells was determined using the CCK8 Assay. B) Intracellular cAMP was determined as described. Data presented are: Panel A, the mean ± standard deviation of triplicate samples of a single experiment that is representative of 3 independent experiments, Panel B, the mean of duplicate samples of a single experiment that is representative of 2 independent experiments.
To investigate the nature of the relationship between toxin-elicited increases in cAMP and cellular proliferation in J774 cells, we measured intracellular cAMP levels following treatment with ET, ACT or IBMX after 30 min and then every 24 hours over the course of 5 days (Figure 3B). Although ACT at 10ng/ml reaches the highest absolute level of intoxication, the cAMP concentration has returned to background levels by Day 2 for all treatments, except ET at 10ng/ml and that condition was not distinguishable from control by Day 3 (note that cAMP concentrations in pmol/mg cell protein are displayed on a log scale). As seen in Figure 3A, the fate of cells treated with ACT at 1ng/ml or with IBMX, is different than that of cells treated with ET at 1ng/ml or ACT at 10ng/ml; for this first group, proliferation is re-initiated and cell number begins to increase between days 2 and 3 and the latter group between days 3 and 4. Most strikingly, cells treated with ET at 10 ng/ml do not begin to proliferate at an exponential rate comparable to control cells until day 7, even though the intracellular cAMP in these cells was maximal on Day 1 and returned to background levels by day 3, having reached only 10% of that seen with ACT at 10 ng/ml. Comparison of these data using “area-under-the-curve” (AUC) determinations to reflect total intracellular cAMP as a function of time illustrates the striking dissociation between cAMP and duration of inhibitory effect. For example, the AUC for ET 10 ng/ml is 577, 25% of that seen with ACT 10 ng/ml (2301), yet proliferation begins again on day 4 for ACT and not until day 6 for ET. More strikingly, the AUC for ET 1 ng/ml is 41.9, less than 2% of that seen with ACT 10 ng/ml (2301), yet the two conditions are inseparable with regard to recovery of cellular proliferation and the additional variables shown below.
Effects of ET and ACT on regulatory pathways controlling cell cycle
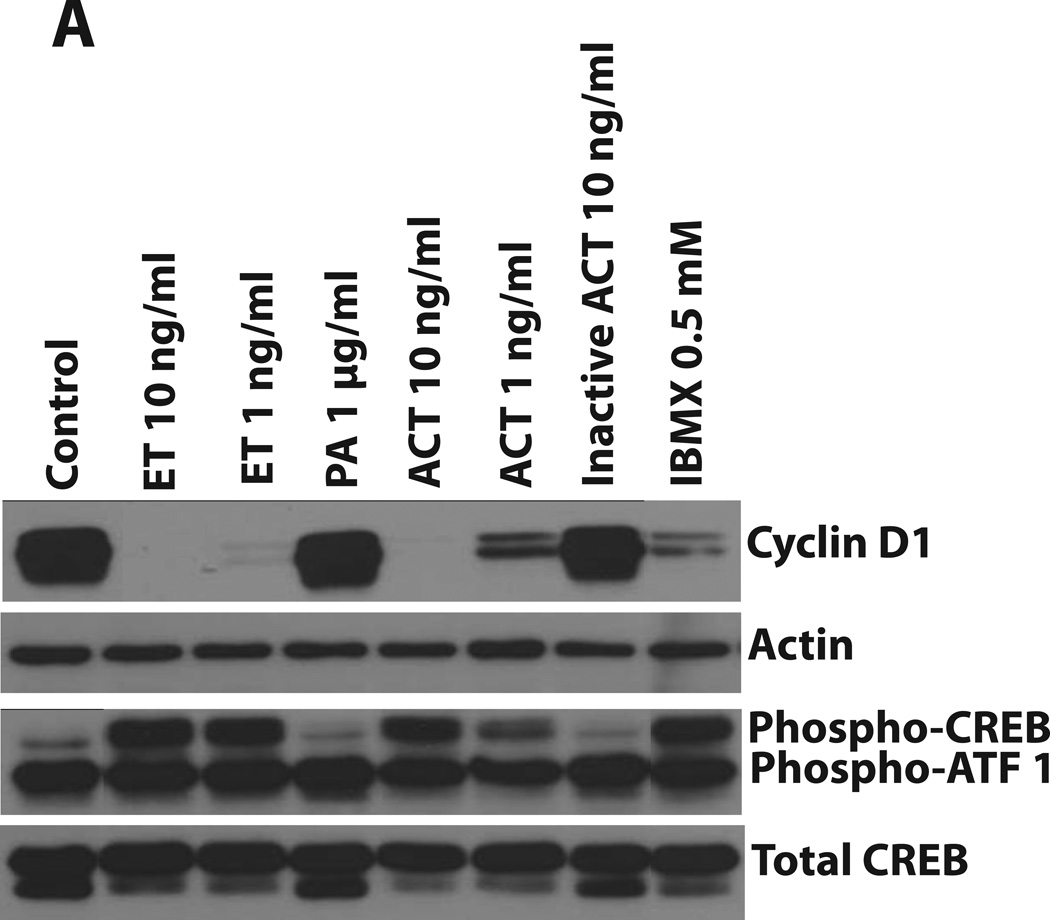
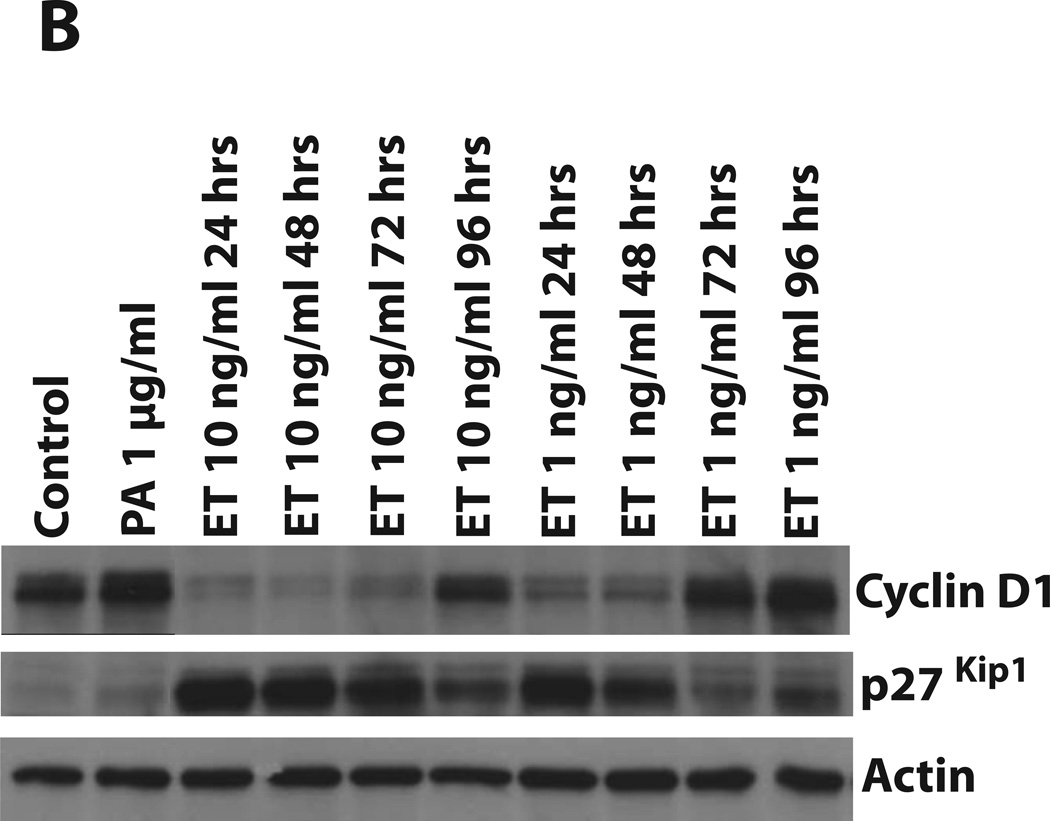
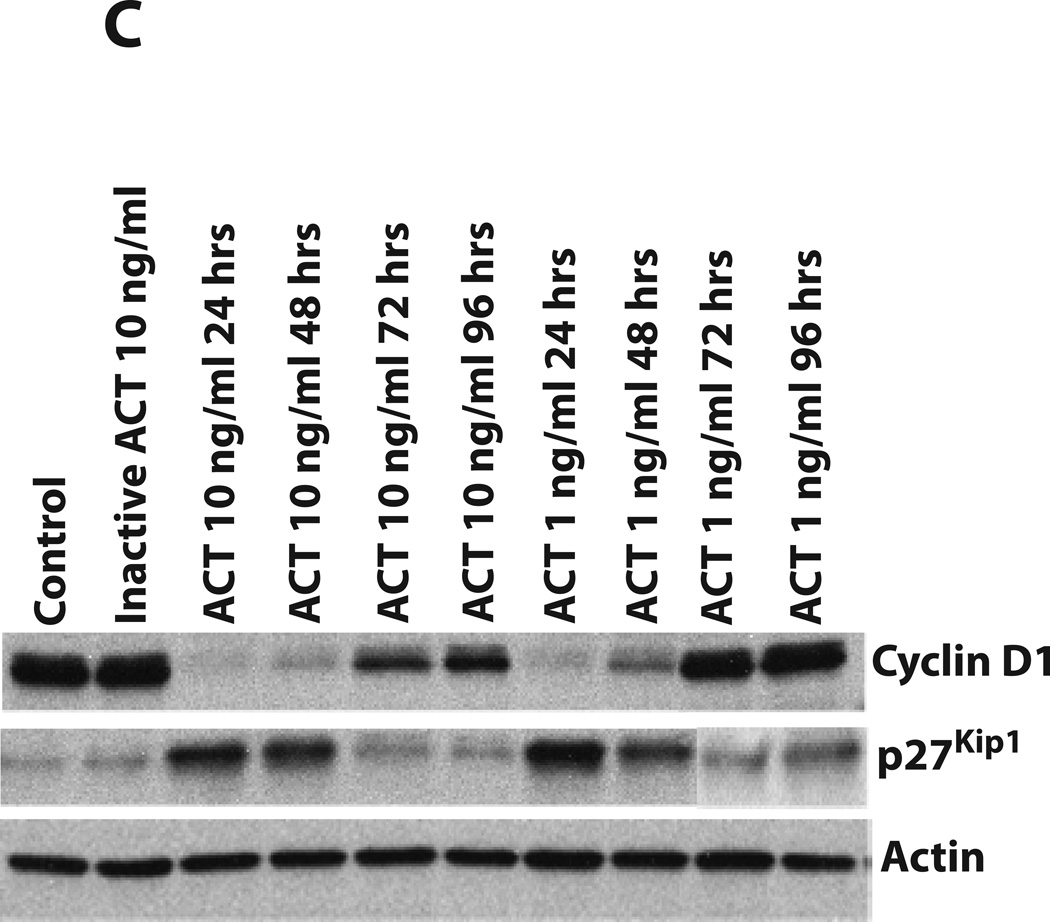
Cell proliferation can be regulated through several different signaling pathways, but ultimately, entry into S phase involves a balance between the cyclins/cyclin-dependent kinases and cyclin-dependent kinase (CDK) inhibitors. Since effects of cAMP on transcriptional regulation can be modulated through the phosphorylation of CREB, we first examined the effects of ACT and ET on phospho-CREB and on the quantities of Cyclin D1. As shown in Figure 4A, PA alone and inactive ACT have no effect on the phosphorylation of CREB or Cyclin D1. However, ACT, ET and IBMX all elicit dramatic increases in the phosphorylation of CREB and decreases in Cyclin D1 levels. While ACT at 10ng/ml and ET at 10 and 1ng/ml cause virtual elimination of Cyclin D1 by 24 hours, the more modest effect of ACT at 1ng/ml at this time point is consistent with the more transient nature of its action. Figures 4B and 4C show the time courses (24 to 96 hours) of the effects of each toxin (at 10 and 1 ng/ml) on levels of Cyclin D1 and the CDK inhibitor, p27Kip1. In addition to the ability of the toxins to reduce the quantities of Cyclin D1, they both increase p27Kip1, suggesting that the growth arrest results from the combination of these two responses. These data also illustrate the differences in kinetics between the two toxins, with Cyclin D1 returning and p27Kip1 decreasing by 48 hours in the cells treated with ACT 1 ng/ml. In contrast in cells treated with ET 10 ng/ml, Cyclin D1 is nearing that of control cells by 96 hours, but p27Kip1 is still elevated.
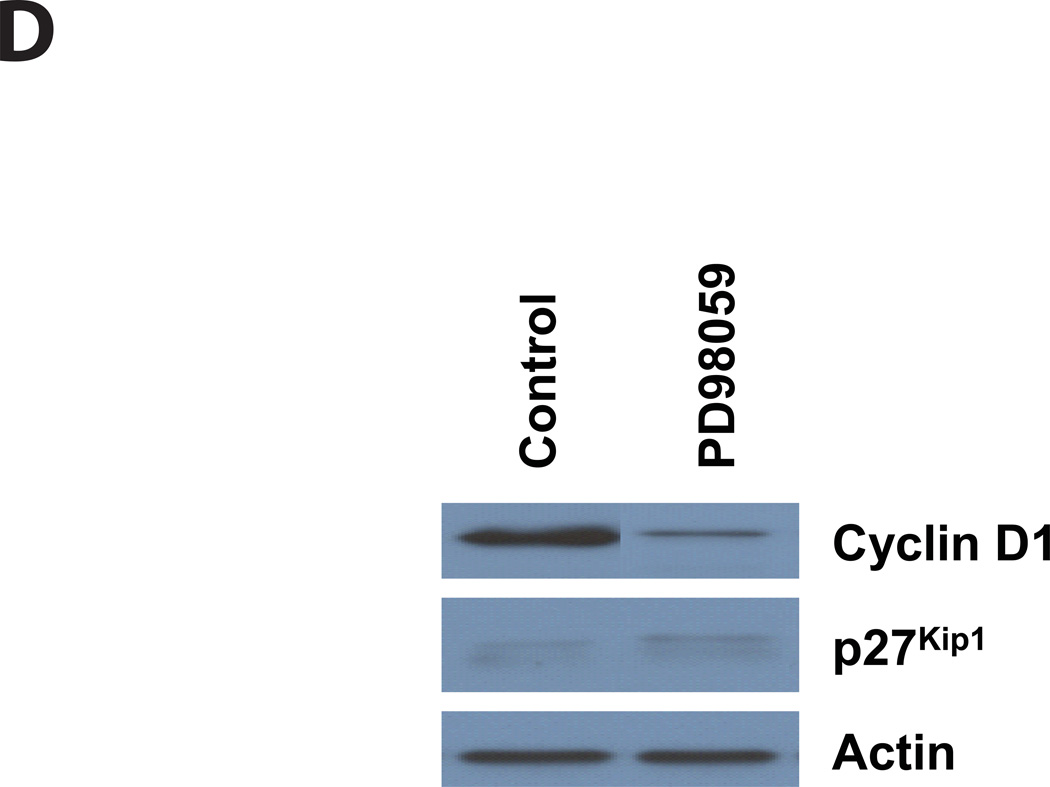
Figure 4. ET and AC toxin cause an increase in phosphorylation of CREB at 24 hours. In addition, both toxins cause a decrease in Cyclin D1 expression and a concomitant increase in p27Kip1, while the MEK inhibitor, PD98059, only effects Cyclin D1.
Immunoblots were carried out as described in Experimental Procedures. J774 cells were incubated with toxins at indicated concentrations, IBMX (0.5 mM, A), or PD98059 (40µM, D) for: A and D) 24 hours, B and C) 24, 48, 72, and 96 hours. Actin was used as a loading control for Cyclin D1 and p27Kip1 and total CREB was used for phosphor-CREB.
Upstream from the cyclin/CDK/CDK inhibitors, proliferation in many cells is driven or controlled through the phosphorylation of ERK1/2 by MAPK kinases (MEK1/2) and cAMP has been shown to have effects on this pathway (New and Wong, 2007). In seeking to understand the striking cell-cycle arrest caused by ET and ACT, we hypothesized that the pro-proliferative effect of phospho-ERK is being countered by toxin-mediated reductions in ERK phosphorylation. If this hypothesis is correct, inhibition of ERK phosphorylation by PD98059, a specific inhibitor of MEK activation and the MAP kinase cascade, should mimic the actions of these toxins. As shown in Figure 2B (far right, PD98059 at 24, 48 and 72 hours), PD98059 elicits a profile similar to that seen following toxin treatment, with an increase in the number of cells in G1/G0 and a decrease in S phase. In addition, we found that when J774 cells are treated with this MEK1 inhibitor for 24 hours, Cyclin D1 is reduced, while the amount of p27Kip1 remains the same as in control cells (Figure 4D).
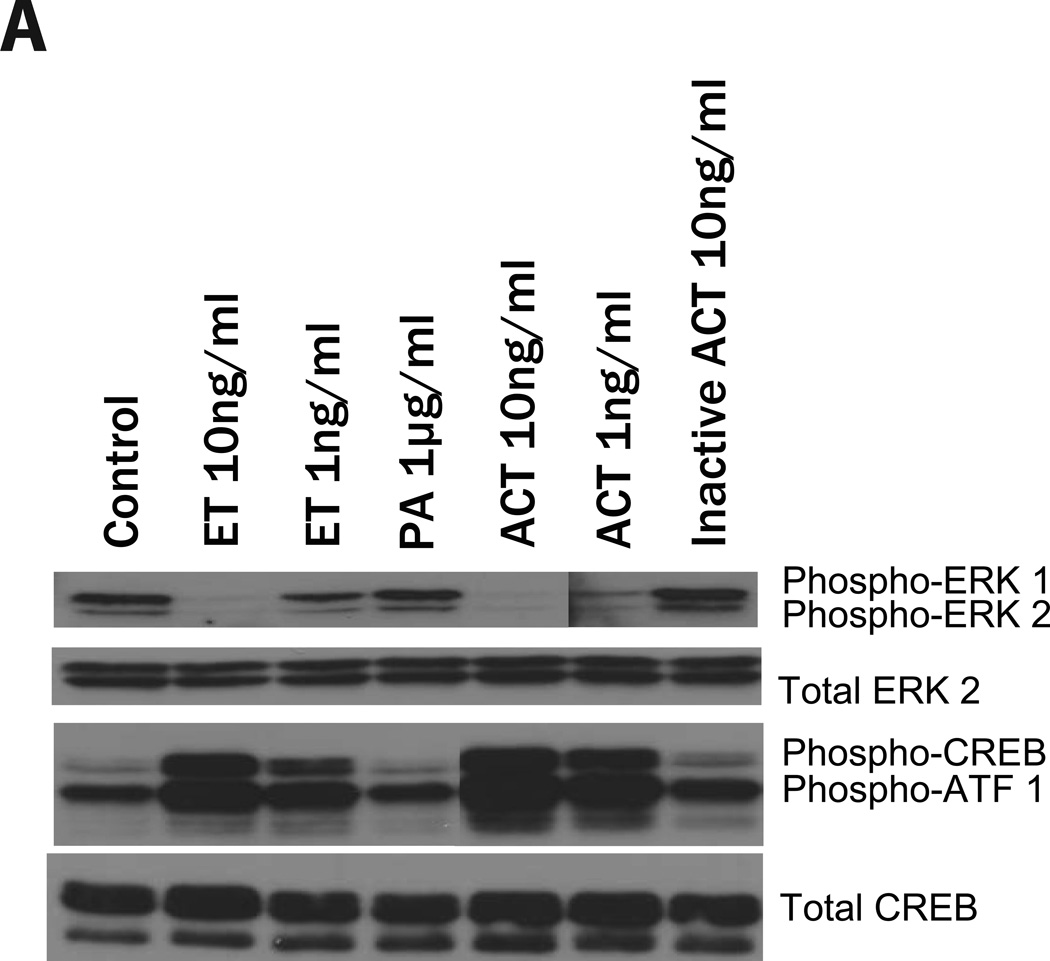
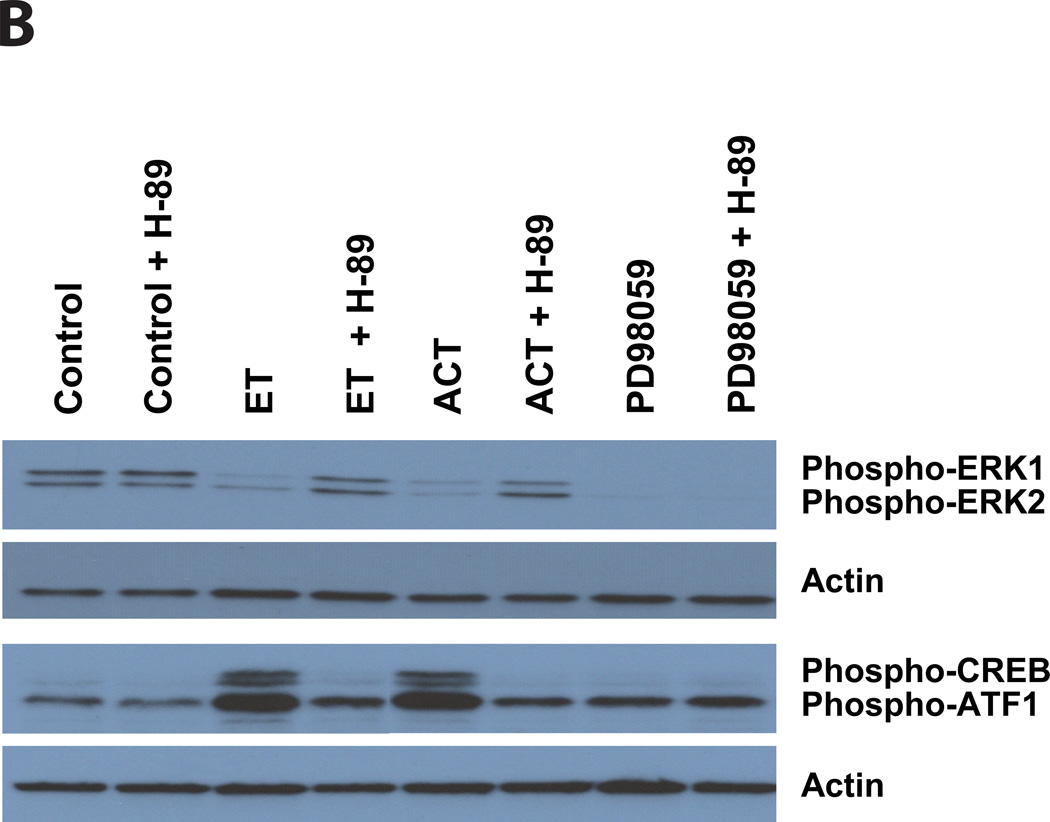
To address whether these two adenylate cyclase toxins inhibit the phosphorylation of ERK1/2, J774 cells were treated with ACT (for 30 minutes) or ET (for 60 minutes) and phospho-ERK 1/2 was measured. As shown in Figure 5A, there is no effect of PA or inactive ACT on the phosphorylation of CREB or the quantity of phospho-ERK 1/2. In contrast, both ET and ACT elicit a reduction in phospho-ERK, in parallel with the increase in phospho-CREB, indicating that both of these regulatory pathways are contributing to the toxin-mediated growth arrest. The lack of response to PA alone or to enzymatically inactive ACT establishes that toxin-produced cAMP is central to this phenomenon. Furthermore, it is well known that intracellular cAMP can elicit its biological effects through several pathways, the best studied of which is through activation of PKA. To determine the role of PKA in these toxin effects, we used the PKA inhibitor, H-89. Figure 5B shows that when J774 cells are treated with H-89 (25 uM, added 1 hour before toxin), neither the phosphorylation of CREB nor the inhibition of ERK phosphorylation produced by ET or ACT occurs; these data establish a major role for PKA in mediating the effects of toxin-generated cAMP on CREB and ERK. As expected, the block of ERK1/2 phosphorylation by PD98059 is not affected by H-89. That PD98059 produces similar growth arrest and changes in cell cycle distribution to that elicited by the toxins (Figure 2B) and reduction in the level of Cyclin D1 (Figure 4D) provides strong evidence that the inhibition of ERK phosphorylation by the toxins is central to the observed growth arrest. Furthermore, the lack of effect of the MEK inhibitor, PD98059, on phospho-CREB or p27Kip1 expression, suggests that these toxins have an additional mechanism, likely downstream from CREB phosporylation, to increase the cyclin-dependent kinase inhibitor, p27Kip1.
Figure 5. ET and ACT cause a decrease in the phosphorylation of ERK 1/2 and an increase in phosphorylation of CREB, both of which are blocked by H-89. In contrast, while PD98059 completely inhibits the phosphorylation of ERK 1/2, H-89 has no on this activity and there is no CREB phosphorylation.
Immunoblots were carried out as described in Experimental Procedures. J774 cells were incubated with ACT, Inactive ACT for 30 minutes or ET, PA, IBMX, PD98059 for 1 hour. B) J774 cells were treated with H-89 (25µM) for 1 hour before the addition of ET (10ng/ml), ACT (10ng/ml), or PD98059 (40 µM). Total ERK 1/2 and total CREB were used as loading controls in panel A, actin was used in panel B.
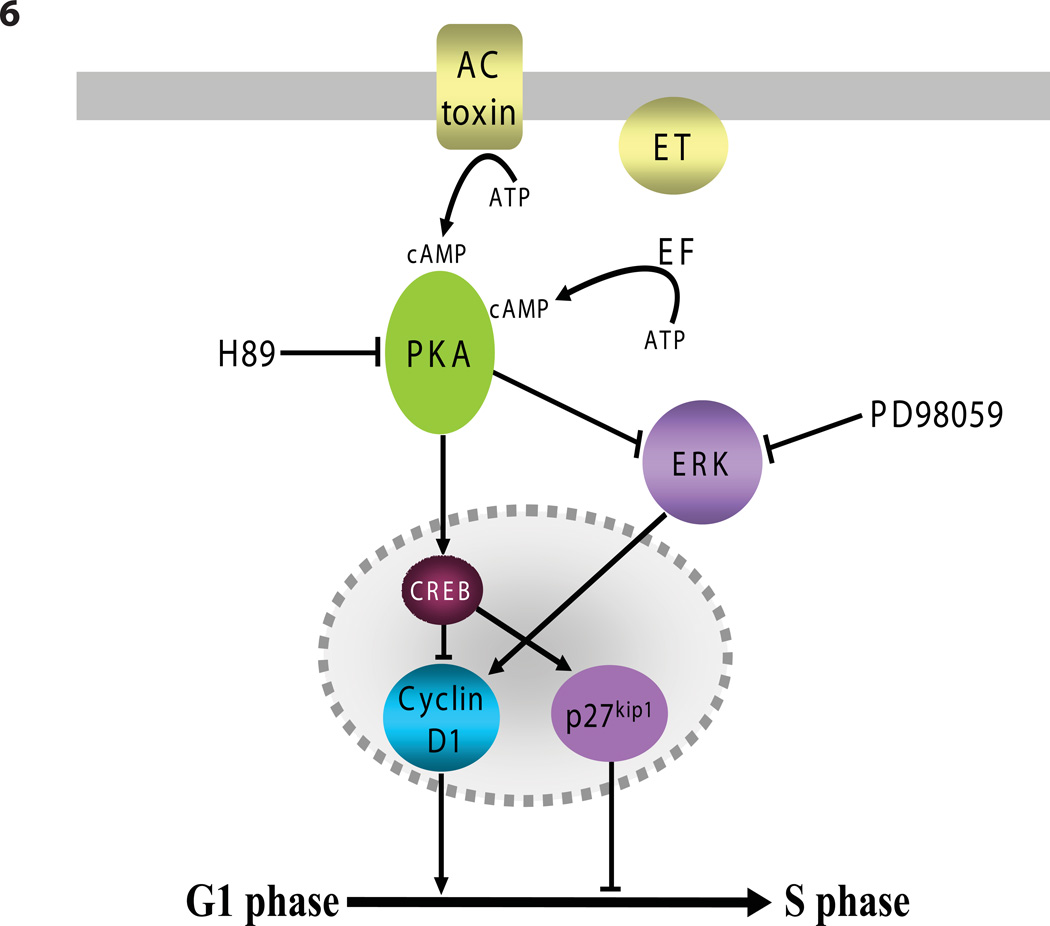
A model illustrating the relationships among components key to the toxin-induced cell cycle arrest is presented diagrammatically in Figure 6. ET and ACT, which enter cells by different processes and pathways to convert ATP into cAMP, have several striking effects with regard to cell cycle control; they: 1) stimulate CREB phosphorylation (Figures 4A and 5A); 2. cause a reduction in the amount of phospho-ERK 1/2 (Figures 5A and 5B), both of which are blocked by the PKA inhibitor, H-89; 3) increase the expression of the cyclin-dependent kinase inhibitor p27Kip1 (Figures 4B and 4C) and; 4) cause gross reduction in the quantity of Cyclin D1 (Figures 4A, 4B and 4C).
Figure 6. Diagramatic representation of ET and ACT effects on steps in regulation of cell cycle.
Discussion
ACT and ET were identified and further characterized on the basis of their calmodulin-activated enzymatic activities and the subsequent observations that they are able to enter host target cells to produce high levels of cyclic AMP (Berkowitz et al., 1980;Confer and Eaton, 1982;Hewlett and Wolff, 1976;Leppla, 1982). It has been assumed that the production of cAMP is an appropriate measure of the relative potencies of these toxins in different cell types, but inadequate attention has been paid to the consequences of cAMP production and the specific mechanisms by which the target eukaryotic cells are affected. The present studies were initiated as a part of a long-term program to understand how these molecules function as virulence factors for the organisms by which they are produced.
In this study we found that ET and ACT can cause reversible (non-lethal) inhibition of proliferation in J774 cells following a single 24 hour exposure to toxin at 1 or 10ng/ml. It is clear that these effects are mediated by toxin-produced cAMP, but there are several kinetic and quantitative disparities between the effects of ET and ACT that will require additional studies. For example, the cAMP level produced by each toxin does not correlate directly with the magnitude and duration of the cell-cycle delay caused by that toxin. Despite cAMP levels that are lower (in absolute value or in area-under-the-curve; Figure 3B), the duration of the ET-induced block in cell cycle progression is longer than that of ACT. Since the absence of Cyclin D1 and the presence of p27Kip1 correlate temporally with the cell cycle delay with each toxin, it is likely that other factor/s downstream from cAMP, but upstream from Cyclin D1 and p27Kip1 are responsible for the differential time course of the effects of ET and ACT. Whether or not the intracellular site at which cAMP is generated by these two toxins is responsible for this difference remains to be determined (Scott and Pawson, 2009). In studies of the early responses of Jurkat cells to cAMP produced by ET and ACT (CyaA), Puhar et al. noted kinetic differences in CREB phosphorylation between the two toxins (Puhar et al., 2008). They did not, however, address functional consequences to the target cells.
Cyclic AMP has been shown to activate or inhibit cellular proliferation, depending on the cell type, and much work has been done to identify the mechanisms to account for these opposing effects (Stork and Schmitt, 2002). As a result, the effects of cAMP on a particular cell type and the signaling pathways by which they are occurring cannot be predicted a priori. The Extracellular signaling-Regulated Kinases (ERKs), also known as mitogen-activated protein (MAP) kinases, belong to a family of highly conserved serine/theonine kinases. Activation of ERK 1/2 by MEK 1/2-mediated phosphorylation is a well-recognized step in the regulation of cellular proliferation by a range of extracellular signaling molecules, such as hormones, neuropeptides, and growth factors (New and Wong, 2007). The ability of the MEK inhibitor PD98059 to produce cell-cycle arrest similar to that of ET and ACT (Figure 2B), to eliminate ERK phosphorylation to an extent similar to ET and ACT (Figure 5B) and reduce Cyclin D1 levels (Figure 4D), as well as the H-89 dependence of the toxin-mediated reduction of ERK phosphorylation, establish ERK as central to the pathways by which these toxins are acting.
The role of PKA in these cAMP-elicited toxin effects has been addressed with the use of H-89, a specific inhibitor of PKA. In addition to blocking the reduction in ERK phosphorylation produced by ET and ACT, H-89, also prevents the phosphorylation of CREB by both toxins, indicating that PKA has a role in these early toxin effects (Figure 5B). H-89 had, however, only a modest effect on the decrease in Cyclin D1 and the increase in p27Kip1 levels (data not shown). These results indicate that PKA is not likely to be solely responsible for all the down stream events leading to the reduction in proliferation and cell cycle progression and EPAC, an alternative cAMP effector molecule, could be involved. In fact, the mechanisms by which cAMP, through PKA and/or EPAC, influence cell cycle and ultimately cellular proliferation represent an active area of research in cell and molecular biology (Stork and Schmitt, 2002). For this reason, it is intriguing to speculate how further investigation of these previously unrecognized toxin effects might be used to dissect the relevant pathways and identify additional elements that are contributing to the observed outcomes.
In eukaryotic cells, progression through the cell cycle is tightly controlled by the interactions of cyclins and cyclin-dependent kinases (CDKs), which dictate whether cells are able to pass specific checkpoints. During G1 phase, these CDK-driven events are responsive to extracellular cues and signal-transduction pathways activated through G-protein-coupled receptors have been shown to affect cell cycle progression, both positively and negatively (New and Wong, 2007). Cyclin D1 is an essential component in the complex with cyclin-dependent kinases (CDK4 and CDK6), which regulates entry into S phase, and p27Kip1 inhibits the cyclin-dependent kinase complex, thereby impairing its function and preventing the G1-S transition. Similar to our results, CREB phosphorylation, which is strikingly increased by the toxins (Figure 4A and 5A), is known to decrease Cyclin D1 and increase p27Kip1 (Kato et al., 1994;Li et al., 2007), causing a block in cell cycle progression at the G1-S transition (Figure 2).
During systemic infection with Bacillus anthracis, impairment of cellular proliferation by ET could have profound consequences, especially since the effects of ET, even following a single exposure, are, as shown here, multiple days in duration (Figure 3A). The development of bacteremia with B. anthracis elicits an acute release of myeloid cells from the bone marrow, as well as stimulating proliferation of the precursor cells to replace the cells, which have been mobilized. During clinical anthrax, continuous exposure to ET could, through the mechanisms described here, compromise the ability of the host to mount a sustained inflammatory response by inhibiting regeneration of these cell populations, as well as by the other effects that ET and LT have on the immune system (Chou et al., 2008;Comer et al., 2005;Crawford et al., 2006;Paccani et al., 2007).
The quantity of anthrax toxins in the serum of an infected host is an area of significant interest, given the documented episodes of anthrax organisms being used in acts of bioterrorism in 2001 (Jernigan et al., 2001). Methods have been developed for measuring individual components of the tripartite toxin, specifically PA and LF and it is believed that the components are produced in similar quantities (Mabry et al., 2006). Using mass spectrometry of serum samples from B. anthracis-infected rhesus macaques, Boyer et al. determined that on the second day post infection, the macaque serum contained 30–250ng/ml of LF (Boyer et al., 2007), levels comparable to those used in this study, suggesting that proliferation of bone marrow cells and other rapidly dividing cell populations could be compromised in clinical anthrax.
Other bacterial toxins have been recognized to affect cell cycle progression in their respective target cells, and this group of disparate toxins has been designated the “cyclomodulins” by Nougayrede et al. (Nougayrede et al., 2005). These virulence factors include Cytolethal Distending Toxin (CDT) from E. coli (Peres et al., 1997), Actinobacillus actinmycetemcomitans, Helicobacter species and Shigella dysenteriae (De Rycke and Oswald, 2001); a “cell-cycle inhibiting factor” (Cif), produced by E. coli (Marches et al., 2003); and Helicobacter pylori VacA (Gebert et al., 2003). Each of these imposes a block at some point in the cell cycle. Other toxins in this newly described category, such as Cytotoxic Necrotizing Factor (CNF) expressed by E. coli and Yersinia pseudotuberculosis and Dermonecrotic Toxin (DNT) from Bordetella species and Pasteurella multocida Toxin (PMT), increase DNA synthesis (Horiguchi, 2001) and can block cell division, thereby promoting formation of multinucleated cells. It is clear from the present work that ET and ACT exhibit the requisite properties to be included among the cyclomodulins and that this activity is a novel addition to their other known biological effects.
Experimental procedures
Cells and Reagents
J774A.1 (J774) cells, a murine macrophage cell line, were cultured in Dulbecco’s Modified Eagles Medium with high glucose (DMEM-H; Gibco) plus 10% heat-inactivated fetal bovine serum (FBS; Gibco) in 5 % CO2. B. anthracis EF and PA were obtained from Biodefense and Emerging Infection Resources (BEI). H-89 was obtained from Sigma, PD98059 and the following antibodies were from Cell Signaling Technology: phospho p44/42 MAP Kinase (ERK 1/2,Thr 202/Tyr 204), p44/42 MAP Kinase (ERK 1/2), phospho-CREB (Ser 133), CREB (48H2), Cyclin D1, p27Kip1, Anti Rabbit IgG HRP-linked Antibody. Actin (C2) was obtained from Santa Cruz Biotechnology. Cell Counting Kit-8 (CCK8) was purchased from Dojindo and LDH was measured using the CytoTox 96 Cytotoxicity Assay from Promega. Intracellular cAMP was determined with the Direct Cyclic AMP Enzyme Immunoassay Kit (Assay Designs). LAL assay kit was obtained from Associates of Cape Cod and used to quantify the bacterial lipopolysaccharide (LPS) in the toxin preparations. ACT (wild type) contained 485 EU/ug toxin and inactive ACT, 650EU/ug. Neither PA nor EF contained any detectable LPS.
Production and Purification of AC toxin
Escherichia coli XL-1 Blue cells (Stratagene) containing pT7CACT1, for wild type toxin (Basar et al., 1999) or 188CysThr189, for enzymatically inactive AC toxin (Osicka et al., 2000) were grown as previously described (Betsou et al., 1993;Lee et al., 1999;Osicka et al., 2000). Cultured bacteria were centrifuged and the resulting pellet resuspended in 50 mM Tris, pH 7.5, sonicated and extracted in 8 M urea. Urea-extracted AC toxin was purified on a DEAE ion-exchange column and a calmodulin affinity column as described (Gray et al., 2001). AC toxin was stored at −70° C in 8 M urea, 10 mM Tricine, 0.5 mM EDTA, 0.5 mM EGTA, pH 8.0. The enzymatically inactive ACT used in these studies has a mutation in the ATP-binding site, which abolished cAMP production but retains pore formation, reduces intracellular K+ concentrations, promotes IL-1β production, and inflammasome activation (Dunne et al., 2010).
Cell Viability and Cytotoxicity
Number of viable cells was determined using the CCK8 Assay, which measures the reduction of WST-8, a water-soluble tetrazolium salt by dehydrogenases in viable cells. J774 cells (20,000 in 100 µl) were seeded in each well of a 96 well plate and allowed to attach (3 hours - overnight) at 37° C with 5% CO2. Toxin was added and the cells incubated at 37° C for indicated time. CCK-8 solution (10 µl) was added and incubated for 1 hour at 37° C. Absorbance was measured at 450 nm using a µQuant (Bio-Tek Instruments) microplate reader. Results reported as a percent of control cells were calculated as follows:
For experiments in which results were reported as the number of viable cells, an increasing number of J774 cells (15,000 –300,000) were plated and incubated with CCK-8 solution for 1 hour. Absorbance was measured as above, graphed using linear regression, and this line used to determine the number of viable cells in experimental conditions.
Cytotoxicity was measured using J774 cells (20,000/well) that were plated and attached to a 96 well tissue culture plate. Cells were washed once to remove any LDH in the supernatant. Toxin was then added and incubated for indicate times. Cells were spun down, supernatants removed and LDH measured using the Cytotox 96 Assay. Results were reported as a percent of the total LDH present in lyzed control cells.
Intoxication
Approximately 24 hours prior to the start of experiments, 5 × 10⁵ J774 cells/well were plated in 12 well tissue culture plates. Toxin was added to wells and incubated for indicated time. All wells were washed after 24 hours of exposure to toxin and fed daily. Intracellular cAMP was measured using the Correlate EIA Direct Cyclic AMP Enzyme Immunoassay Kit by Assay Designs. Since the number of cells varies with the incubation of toxin over the given time frame, protein determinations were done on each condition and intracellular cAMP is reported as pmoles cAMP/mg of cell protein.
Cell Cycle Analysis
Cell cycle distribution was measured by flow cytometry. J774 cells (2 × 10⁶) were plated in small non-tissue culture treated Petri dishes and incubated at 37° C for 2–3 hours. Toxin was added and incubated at 37° C for the indicated time. Petri dishes were placed on ice and cells removed by gently pipetting up and down. Cells were washed with PBS, resuspended at 2 × 10⁶/ml, and fixed in 70% ethanol overnight. Fixed cells were then washed in PBS and stained with propidium iodide (20 µg/ml) in PBS containing 0.1 % Triton X-100 and 0.2 mg/ml DNase-free Rnase A for 30 min at room temperature. Stained cells (10,000) were analyzed on a FACSCalibur, Becton Dickinson, using an excitation wavelength of 488 and emission at 585 nm.
Immunoblot Analysis
J774 cells (1 × 10⁶) were plated in 6 well tissue culture plates and grown for approximately 24 hours before toxin addition. After treatment for indicated time, plates were then spun down, washed with ice-cold PBS, and lysed with 200 µl of homogenization buffer (10 mM HEPES, pH 7.4, 150 mM NaCl, 10 mM NaPPi, 10 mM NaF, 10 mM EDTA, 4 mM EGTA, 0.1 mM PMSF, 1 % Triton X-100, and 2 µg/ml of Chymostatin, Leupeptin, Antipain, and Pepstatin) on ice. Cells were scraped and lysates cleared by centrifugation at 16,000 µg for 5 min at 4°C. Protein concentration was measured and 25 µg of cell lysate were boiled for 5 min in 6µ Reducing Sample Buffer (Pierce) and separated on a 10 % SDS-PAGE, followed by transfer onto polyvinylidene difluoride membranes. Membranes were subsequently blocked with PBS-T (PBS, pH 7.4, 0.1% Tween 20) containing 5 % skim milk for 2 hours at room temperature and then incubated with primary antibody at 1:1000 overnight at 4°C. Membranes were washed 5 µ, incubated with secondary antibody conjugated with horseradish peroxidase at 1:1000 for 2 hours at room temperature and developed by the chemiluminescence detection system (Pierce). To determine if equal amounts of cell lysates were loaded onto gels, PVDF membranes where then stripped of initial antibodies by incubation for 30 minutes at 50°C with 10 mM Tris, 2% SDS, 0.7% β-mercaptoethanol. Membranes were then rinsed, blocked, and incubated with antibodies to Actin, total ERK1/2, or CREB as described above.
Acknowledgements
The authors wish to acknowledge the financial support of the NIH/NIAID (US) through RO1 AI18000 and the Middle Atlantic Regional Center of Excellence in Biodefense and Emerging Infectious Diseases Research (grant U54 AI057168) and the administrative assistance of Pam Schaefer.
References
- Barry EM, Weiss AA, Ehrmann IE, Gray MC, Hewlett EL, Goodwin MS. Bordetella pertussis adenylate cyclase toxin and hemolytic activities require a second gene, cyaC, for activation. J Bacteriol. 1991;173:720–726. doi: 10.1128/jb.173.2.720-726.1991. [DOI] [PMC free article] [PubMed] [Google Scholar]
- Basar T, Havlicek V, Bezouskova S, Halada P, Hackett M, Sebo P. The conserved lysine 860 in the additional fatty-acylation site of Bordetella pertussis adenylate cyclase is crucial for toxin function independently of its acylation status. J Biol Chem. 1999;274:10777–10783. doi: 10.1074/jbc.274.16.10777. [DOI] [PubMed] [Google Scholar]
- Basler M, Masin J, Osicka R, Sebo P. Pore-forming and enzymatic activities of Bordetella pertussis adenylate cyclase toxin synergize in promoting lysis of monocytes. Infect Immun. 2006;74:2207–2214. doi: 10.1128/IAI.74.4.2207-2214.2006. [DOI] [PMC free article] [PubMed] [Google Scholar]
- Bellalou J, Sakamoto H, Ladant D, Geoffroy C, Ullmann A. Deletions affecting hemolytic and toxin activities of Bordetella pertussis adenylate cyclase. Infect Immun. 1990;58:3242–3247. doi: 10.1128/iai.58.10.3242-3247.1990. [DOI] [PMC free article] [PubMed] [Google Scholar]
- Berkowitz SA, Goldhammer AR, Hewlett EL, Wolff J. Activation of prokaryotic adenylate cyclase by calmodulin. Ann N Y Acad Sci. 1980;1:356–360. doi: 10.1111/j.1749-6632.1980.tb29626.x. [DOI] [PubMed] [Google Scholar]
- Betsou F, Sebo P, Guiso N. CyaC-mediated activation is important not only for toxic but also for protective activities of Bordetella pertussis adenylate cyclase-hemolysin. Infect Immun. 1993;61:3583–3589. doi: 10.1128/iai.61.9.3583-3589.1993. [DOI] [PMC free article] [PubMed] [Google Scholar]
- Boyer AE, Quinn CP, Woolfitt AR, Pirkle JL, McWilliams LG, Stamey KL, Bagarozzi DA, Hart JC, Jr, Barr JR. Detection and quantification of anthrax lethal factor in serum by mass spectrometry. Anal Chem. 2007;79:8463–8470. doi: 10.1021/ac701741s. [DOI] [PubMed] [Google Scholar]
- Bradley KA, Mogridge J, Mourez M, Collier RJ, Young JA. Identification of the cellular receptor for anthrax toxin. Nature. 2001;414:225–229. doi: 10.1038/n35101999. [DOI] [PubMed] [Google Scholar]
- Chou PJ, Newton CA, Perkins I, Friedman H, Klein TW. Suppression of dendritic cell activation by anthrax lethal toxin and edema toxin depends on multiple factors including cell source, stimulus used, and function tested. DNA Cell Biol. 2008;27:637–648. doi: 10.1089/dna.2008.0760. [DOI] [PMC free article] [PubMed] [Google Scholar]
- Comer JE, Chopra AK, Peterson JW, Konig R. Direct inhibition of T-lymphocyte activation by anthrax toxins in vivo. Infect Immun. 2005;73:8275–8281. doi: 10.1128/IAI.73.12.8275-8281.2005. [DOI] [PMC free article] [PubMed] [Google Scholar]
- Confer DL, Eaton JW. Phagocyte impotence caused by an invasive bacterial adenylate cyclase. Scnce. 1982;217:948–950. doi: 10.1126/science.6287574. [DOI] [PubMed] [Google Scholar]
- Crawford MA, Aylott CV, Bourdeau RW, Bokoch GM. Bacillus anthracis toxins inhibit human neutrophil NADPH oxidase activity. J Immunol. 2006;176:7557–7565. doi: 10.4049/jimmunol.176.12.7557. [DOI] [PubMed] [Google Scholar]
- De Rycke J, Oswald E. Cytolethal distending toxin (CDT): a bacterial weapon to control host cell proliferation? FEMS Microbiol Lett. 2001;203:141–148. doi: 10.1111/j.1574-6968.2001.tb10832.x. [DOI] [PubMed] [Google Scholar]
- Dunne A, Ross PJ, Pospisilova E, Masin J, Meaney A, Sutton CE, Iwakura Y, Tschopp J, Sebo P, Mills KHG. Inflammasome activation by adenylate cycalse toxin directs Th17 responses and protection against Bordetella pertussis. J Immunol. 2010;185:1711–1719. doi: 10.4049/jimmunol.1000105. [DOI] [PubMed] [Google Scholar]
- Eby JC, Ciesla WP, Hamman W, Donato GM, Pickles RJ, Hewlett EL, Lencer WI. Selective translocation of the Bordetella pertussis adenylate cyclase toxin across the basolateral membranes of polarized epithelial cells. J Biol Chem. 2010;285:10662–10670. doi: 10.1074/jbc.M109.089219. [DOI] [PMC free article] [PubMed] [Google Scholar]
- Firoved AM, Miller GF, Moayeri M, Kakkar R, Shen Y, Wiggins JF, McNally EM, Tang WJ, Leppla SH. Bacillus anthracis edema toxin causes extensive tissue lesions and rapid lethality in mice. Am J Pathol. 2005;167:1309–1320. doi: 10.1016/S0002-9440(10)61218-7. [DOI] [PMC free article] [PubMed] [Google Scholar]
- Gebert B, Fischer W, Weiss E, Hoffmann R, Haas R. Helicobacter pylori vacuolating cytotoxin inhibits T lymphocyte activation. Scnce. 2003;301:1099–1102. doi: 10.1126/science.1086871. [DOI] [PubMed] [Google Scholar]
- Glaser P, Sakamoto H, Bellalou J, Ullmann A, Danchin A. Secretion of cyclolysin, the calmodulin-sensitive adenylate cyclase-haemolysin bifunctional protein of Bordetella pertussis. EMBO J. 1988;7:3997–4004. doi: 10.1002/j.1460-2075.1988.tb03288.x. [DOI] [PMC free article] [PubMed] [Google Scholar]
- Gordon VM, Leppla SH, Hewlett EL. Inhibitors of receptor-mediated endocytosis block the entry of Bacillus anthracis adenylate cyclase toxin but not that of Bordetella pertussis adenylate cyclase toxin. Infect Immun. 1988;56:1066–1069. doi: 10.1128/iai.56.5.1066-1069.1988. [DOI] [PMC free article] [PubMed] [Google Scholar]
- Gray MC, Donato GM, Jones FR, Kim T, Hewlett EL. Newly secreted adenylate cyclase toxin is responsible for intoxication of target cells by Bordetella pertussis. Mol Microbiol. 2004;53:1709–1719. doi: 10.1111/j.1365-2958.2004.04227.x. [DOI] [PubMed] [Google Scholar]
- Gray MC, Lee SJ, Gray LS, Zaretzky FR, Otero AS, Szabo G, Hewlett EL. Translocation-specific conformation of adenylate cyclase toxin from Bordetella pertussis inhibits toxin-mediated hemolysis. J Bacteriol. 2001;183:5904–5910. doi: 10.1128/JB.183.20.5904-5910.2001. [DOI] [PMC free article] [PubMed] [Google Scholar]
- Guermonprez P, Khelef N, Blouin E, Rieu P, Ricciardi-Castagnoli P, Guiso N, Ladant D, Leclerc C. The adenylate cyclase toxin of Bordetella pertussis binds to target cells via the αMβ2 (integrin CD11b/CD18) J Exp Med. 2001;193:1035–1044. doi: 10.1084/jem.193.9.1035. [DOI] [PMC free article] [PubMed] [Google Scholar]
- Hackett M, Guo L, Shabanowitz J, Hunt DF, Hewlett EL. Internal lysine palmitoylation in adenylate cyclase toxin from Bordetella pertussis. Scnce. 1994;266:433–435. doi: 10.1126/science.7939682. [DOI] [PubMed] [Google Scholar]
- Hewlett E, Wolff J. Soluble adenylate cyclase from the culture medium of Bordetella pertussis: purification and characterization. J Bacteriol. 1976;127:890–898. doi: 10.1128/jb.127.2.890-898.1976. [DOI] [PMC free article] [PubMed] [Google Scholar]
- Hewlett EL, Donato GM, Gray MC. Macrophage cytotoxicity produced by adenylate cyclase toxin from B. pertussis: more than just making cyclic AMP! Mol Microbiol. 2006;59:447–459. doi: 10.1111/j.1365-2958.2005.04958.x. [DOI] [PubMed] [Google Scholar]
- Hewlett EL, Gray MC. Adenylyl-cyclase toxin from Bordetella pertussis. In: Aktories K, Just I, editors. Bacterial Protein Toxins. Berlin: Springer-Verlag; 2000. pp. 473–488. [Google Scholar]
- Horiguchi Y. Escherichia coli cytotoxic necrotizing factors and Bordetella dermonecrotic toxin: the dermonecrosis-inducing toxins activating Rho small GTPases. Toxicon. 2001;39:1619–1627. doi: 10.1016/s0041-0101(01)00149-0. [DOI] [PubMed] [Google Scholar]
- Jernigan JA, Stephens DS, Ashford DA, Omenaca C, Topiel MS, Galbraith M, Tapper M, Fisk TL, Zaki S, Popovic T, Meyer RF, Quinn CP, Harper SA, Fridkin SK, Sejvar JJ, Shepard CW, McConnell M, Guarner J, Shieh WJ, Malecki JM, Gerberding JL, Hughes JM, Perkins BA Anthrax Bioterrorism Investigation Team. Bioterrorism-related inhalational anthrax: the first 10 cases reported in the United States. Emerg Infect Dis. 2001;7:933–944. doi: 10.3201/eid0706.010604. [DOI] [PMC free article] [PubMed] [Google Scholar]
- Kato JY, Matsuoka M, Polyak K, Massague J, Sherr CJ. Cyclic AMP-induced G1 phase arrest mediated by an inhibitor (p27Kip1) of cyclin-dependent kinase 4 activation. Cell. 1994;79:487–496. doi: 10.1016/0092-8674(94)90257-7. [DOI] [PubMed] [Google Scholar]
- Ladant D, Ullmann A. Bordetella pertussis adenylate cyclase: a toxin with multiple talents. Trends Microbiol. 1999;7:172–176. doi: 10.1016/s0966-842x(99)01468-7. [DOI] [PubMed] [Google Scholar]
- Larabee JL, DeGiusti K, Regens JL, Ballard JD. Bacillus anthracis edema toxin activates nuclear glycogen synthase kinase 3beta. Infect Immun. 2008;76:4895–4904. doi: 10.1128/IAI.00889-08. [DOI] [PMC free article] [PubMed] [Google Scholar]
- Lee SJ, Gray MC, Sebo P, Hewlett EL. Epitope mapping of monoclonal antibodies against Bordetella pertussis adenylate cyclase toxin. Infect Immun. 1999;67:2090–2095. doi: 10.1128/iai.67.5.2090-2095.1999. [DOI] [PMC free article] [PubMed] [Google Scholar]
- Leppla S. The bifactorial Bacillus anthracis lethal and oedema toxins. In: Alouf JE, Freer JH, editors. The Comprehensive Sourcebook of Bacterial Protein Toxins. London: Academic Press; 1999. pp. 243–263. [Google Scholar]
- Leppla SH. Anthrax toxin edema factor: a bacterial adenylate cyclase that increases cyclic AMP concentrations in eukaryotic cells. Proc Natl Acad Sci USA. 1982;79:3162–3166. doi: 10.1073/pnas.79.10.3162. [DOI] [PMC free article] [PubMed] [Google Scholar]
- Li Y, Yin W, Wang X, Zhu W, Huang Y, Yan G. Cholera toxin induces malignant glioma cell differentiation via the PKA/CREB pathway. Proc Natl Acad Sci U S A. 2007;104:13438–13443. doi: 10.1073/pnas.0701990104. [DOI] [PMC free article] [PubMed] [Google Scholar]
- Mabry R, Brasky K, Geiger R, Carrion R, Jr, Hubbard GB, Leppla S, Patterson JL, Georgiou G, Iverson BL. Detection of anthrax toxin in the serum of animals infected with Bacillus anthracis by using engineered immunoassays. Clin Vaccine Immunol. 2006;13:671–677. doi: 10.1128/CVI.00023-06. [DOI] [PMC free article] [PubMed] [Google Scholar]
- Marches O, Ledger TN, Boury M, Ohara M, Tu X, Goffaux F, Mainil J, Rosenshine I, Sugai M, De Rycke J, Oswald E. Enteropathogenic and enterohaemorrhagic Escherichia coli deliver a novel effector called Cif, which blocks cell cycle G2/M transition. Mol Microbiol. 2003;50:1553–1567. doi: 10.1046/j.1365-2958.2003.03821.x. [DOI] [PubMed] [Google Scholar]
- New DC, Wong YH. Molecular mechanisms mediating the G protein-coupled receptor regulation of cell cycle progression. J Mol Signal. 2007;2:2. doi: 10.1186/1750-2187-2-2. [DOI] [PMC free article] [PubMed] [Google Scholar]
- Nougayrede JP, Taieb F, De Rycke J, Oswald E. Cyclomodulins: bacterial effectors that modulate the eukaryotic cell cycle. Trends Microbiol. 2005;13:103–110. doi: 10.1016/j.tim.2005.01.002. [DOI] [PubMed] [Google Scholar]
- Osicka R, Osickova A, Basar T, Guermonprez P, Rojas M, Leclerc C, Sebo P. Delivery of CD8+ T-cell epitopes into major histocompatibility complex class I antigen presentation pathway by Bordetella pertussis adenylate cyclase: delineation of cell invasive structures and permissive insertion sites. Infect Immun. 2000;68:247–256. doi: 10.1128/iai.68.1.247-256.2000. [DOI] [PMC free article] [PubMed] [Google Scholar]
- Paccani SR, Tonello F, Patrussi L, Capitani N, Simonato M, Montecucco C, Baldari CT. Anthrax toxins inhibit immune cell chemotaxis by perturbing chemokine receptor signalling. Cell Microbiol. 2007;9:924–929. doi: 10.1111/j.1462-5822.2006.00840.x. [DOI] [PubMed] [Google Scholar]
- Peres SY, Marches O, Daigle F, Nougayrede JP, Herault F, Tasca C, De Rycke J, Oswald E. A new cytolethal distending toxin (CDT) from Escherichia coli producing CNF2 blocks HeLa cell division in G2/M phase. Mol Microbiol. 1997;24:1095–1107. doi: 10.1046/j.1365-2958.1997.4181785.x. [DOI] [PubMed] [Google Scholar]
- Puhar A, Dal Molin F, Horvath S, Ladants D, Montecucco C. Anthrax edema toxin modulates PKA- and CREB-dependent signaling in two phases. PLoS ONE. 2008;3:e3564. doi: 10.1371/journal.pone.0003564. [DOI] [PMC free article] [PubMed] [Google Scholar]
- Rainey GJ, Wigelsworth DJ, Ryan PL, Scobie HM, Collier RJ, Young JA. Receptor-specific requirements for anthrax toxin delivery into cells. Proc Natl Acad Sci U S A. 2005;102:13278–13283. doi: 10.1073/pnas.0505865102. [DOI] [PMC free article] [PubMed] [Google Scholar]
- Scobie HM, Rainey JA, Bradley KA, Young JAT. Human capillary morphogenesis protein 2 functions as an anthrax toxin receptor. Proc Natl Acad Sci USA. 2003;100:5170–5174. doi: 10.1073/pnas.0431098100. [DOI] [PMC free article] [PubMed] [Google Scholar]
- Scott JD, Pawson T. Cell signaling in space and time: where proteins come together and when they're apart. Scnce. 2009;326:1220–1224. doi: 10.1126/science.1175668. [DOI] [PMC free article] [PubMed] [Google Scholar]
- Smith H, Keppie J, Stanley JL. The chemical basis of the virulence of Bacillus anthracis. V. The specific toxin produced by B. anthracis in vivo. Exp Path. 1955;36:460–472. [PMC free article] [PubMed] [Google Scholar]
- Stork PJ, Schmitt JM. Crosstalk between cAMP and MAP kinase signaling in the regulation of cell proliferation. Trends Cell Biol. 2002;12:258–266. doi: 10.1016/s0962-8924(02)02294-8. [DOI] [PubMed] [Google Scholar]
- Szabo G, Gray MC, Hewlett EL. Adenylate cyclase toxin from Bordetella pertussis produces ion conductance across artificial lipid bilayers in a calcium- and polarity-dependent manner. J Biol Chem. 1994;269:22496–22499. [PubMed] [Google Scholar]
- Tessier J, Green C, Padgett D, Zhao W, Schwartz L, Hughes M, Hewlett E. Contributions from histamine, prostanoids, and neurokinins to edema elicited by edema toxin from Bacillus anthracis. Infect Immun. 2007;75:1895–1903. doi: 10.1128/IAI.01632-06. [DOI] [PMC free article] [PubMed] [Google Scholar]
- Vojtova J, Kamanova J, Sebo P. Bordetella adenylate cyclase toxin: a swift saboteur of host defense. Curr Opin Microbiol. 2006a;9:69–75. doi: 10.1016/j.mib.2005.12.011. [DOI] [PubMed] [Google Scholar]
- Vojtova J, Kofronova O, Sebo P, Benada O. Bordetella adenylate cyclase toxin induces a cascade of morphological changes of sheep erythrocytes and localizes into clusters in erythrocyte membranes. Microsc Res Tech. 2006b;69:119–129. doi: 10.1002/jemt.20277. [DOI] [PubMed] [Google Scholar]
- Voth DE, Hamm EE, Nguyen LG, Tucker AE, Salles II, Ortiz-Leduc W, Ballard JD. Bacillus anthracis oedema toxin as a cause of tissue necrosis and cell type-specific cytotoxicity. Cell Microbiol. 2005;7:1139–1149. doi: 10.1111/j.1462-5822.2005.00539.x. [DOI] [PubMed] [Google Scholar]
- Zornetta I, Brandi L, Janowiak B, Dal Molin F, Tonello F, Collier RJ, Montecucco C. Imaging the cell entry of the anthrax oedema and lethal toxins with fluorescent protein chimeras. Cell Microbiol. 2010 doi: 10.1111/j.1462-5822.2010.01480.x. [DOI] [PubMed] [Google Scholar]


