

Abstract
Aims
Citalopram (CT) and escitalopram (S-CT) are among the most widely prescribed selective serotonin reuptake inhibitors used to treat major depressive disorder (MDD). We applied a genome-wide association study to identify genetic factors that contribute to variation in plasma concentrations of CT or S-CT and their metabolites in MDD patients treated with CT or S-CT.
Methods
Our genome-wide association study was performed using samples from 435 MDD patients. Linear mixed models were used to account for within-subject correlations of longitudinal measures of plasma drug/metabolite concentrations (4 and 8 weeks after the initiation of drug therapy), and single-nucleotide polymorphisms (SNPs) were modelled as additive allelic effects.
Results
Genome-wide significant associations were observed for S-CT concentration with SNPs in or near the CYP2C19 gene on chromosome 10 (rs1074145, P = 4.1 × 10⁻⁹) and with S-didesmethylcitalopram concentration for SNPs near the CYP2D6 locus on chromosome 22 (rs1065852, P = 2.0 × 10⁻¹⁶), supporting the important role of these cytochrome P450 (CYP) enzymes in biotransformation of citalopram. After adjustment for the effect of CYP2C19 functional alleles, the analyses also identified novel loci that will require future replication and functional validation.
Conclusions
In vitro and in vivo studies have suggested that the biotransformation of CT to monodesmethylcitalopram and didesmethylcitalopram is mediated by CYP isozymes. The results of our genome-wide association study performed in MDD patients treated with CT or S-CT have confirmed those observations but also identified novel genomic loci that might play a role in variation in plasma levels of CT or its metabolites during the treatment of MDD patients with these selective serotonin reuptake inhibitors.
Keywords: citalopram, escitalopram, genome-wide association study, major depressive disorder, plasma drug concentration, selective serotonin reuptake inhibitor
WHAT IS ALREADY KNOWN ABOUT THIS SUBJECT
Major depressive disorder (MDD) is the most common psychiatric disorder, and selective serotonin reuptake inhibitors are the most commonly prescribed antidepressants. Citalopram (CT) and escitalopram (S-CT) are among the most widely used selective serotonin reuptake inhibitors to treat MDD.
Previous studies have indicated that a major factor affecting CT and S-CT plasma concentrations is biotransformation catalysed by the cytochrome P450 (CYP) enzymes CYP2C19 and CYP2D6.
WHAT THIS STUDY ADDS
We conducted a genome-wide association study for plasma concentrations of S-CT and its metabolites in 435 patients with MDD.
We observed single-nucleotide polymorphisms in or near the CYP2C19 and the CYP2D6 genes that were significantly associated with plasma S-CT and S-didesmethylcitalopram concentrations, respectively.
We also identified additional novel associations that warrant further investigation.
Introduction
Citalopram (CT) and escitalopram (S-CT) are among the most widely prescribed serotonin reuptake inhibitors (SSRIs) used to treat patients with major depressive disorder (MDD) [1,2]. Unfortunately, a large proportion of MDD patients do not respond or fail to respond adequately to treatment with these drugs [3]. This large individual variation may reflect, to some extent, variation in the disposition of these drugs as well as the complex nature of MDD and our incomplete understanding of SSRI action at the molecular level.
In vitro and in vivo studies performed with CT and S-CT indicated that the biotransformation of these drugs is catalysed primarily by three human hepatic cytochrome P450 (CYP) enzymes, specifically, CYP2C19 and CYP2D6, with a minor contribution to the initial step by CYP3A4 [4–7]. CYP2C19 appears to play a major role in the conversion of CT to monodesmethylcitalopram (DCT), while CYP2D6 is thought to catalyse the conversion of DCT to didesmethylcitalopram (DDCT; see Figure 1). There is an increase in plasma levels of CT (S-CT) during the co-administration of fluvoxamine [8], and the relatively minor role played by CYP3A has been verified clinically by studies showing no effect on CT or S-CT plasma levels during the co-administration of strong CYP3A inhibitors [9–11]. Citalopram is a racemic mixture of S- and R-enantiomers, but most or all of its therapeutic effect is thought to be mediated by the effect of the S-enantiomer [12]. The R-isomer (R-CT) undergoes biotransformation similar to that of the S-enantiomer during in vitro assays performed with human hepatic microsomes or recombinant CYP enzymes [6,13]. However, R-CT appears to have a longer half-life than that of S-CT in clinical pharmacokinetic studies, suggesting stereoselective disposition [8,14,15]. Based on these studies of CT biotransformation, genotyping of the genetically polymorphic CYP2C19 and CYP2D6 genes has been included in previous CT and S-CT pharmacogenetic studies [16,17].
Figure 1.
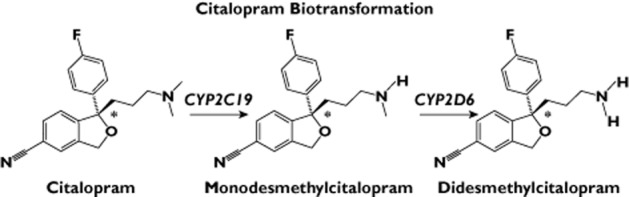
Citalopram biotransformation. *Asymmetric carbon. CYP3A4 may play a minor role in the formation of monodesmethylcitalopram
The present study was performed in an attempt to characterize the contribution of genetic variation to individual variation in plasma concentrations of S-CT and its metabolites, S-DCT and S-DDCT, but to do so across the entire genome by applying a genome-wide association study (GWAS). The application of GWAS would make it possible not only to verify, in patients, the results of candidate gene studies but also to move beyond candidate genes to identify novel loci that might contribute to pharmacokinetic variation. The present GWAS identified, as anticipated, genome-wide significant associations for plasma S-CT and S-DDCT concentrations within regions containing the CYP2C19 and CYP2D6 genes, respectively. In addition, novel associations were observed either after adjusting for the effect of CYP2C19 functional alleles or by performing the analyses using ratios of metabolites over their precursor substrates (i.e. S-DCT/S-CT and S-DDCT/S-DCT ratios). These observations serve to increase our understanding of the contribution of genetics to individual variation in the biotransformation of these very widely prescribed SSRI antidepressant medications.
Methods
Study subjects
The Mayo Clinic NIH-Pharmacogenomics Research Network-Antidepressant Medication Pharmacogenomic Study (PGRN-AMPS) is an 8 week, outpatient SSRI clinical trial performed at the Mayo Clinic in Rochester, MN, USA. Both CT and S-CT were used to treat these patients because the Mayo Pharmacy Formulary Committee required that prescribing physicians be given a choice of these medications. This trial has been described in detail elsewhere [18,19]. A brief description of the trial is included in Appendix S1.
Assay of blood drug and drug metabolite concentrations
Plasma concentrations of S-CT, CT and their metabolites were determined using liquid chromatography tandem mass spectrometry (LC-MS/MS). A chiral LC column was used to assay CT and CT metabolites in patients treated with that drug. Drugs and drug metabolites were quantified using the ratio of peak area to the peak area of the internal standard, and calibration curves were constructed using known concentrations of analytes added to blank plasma. The limit of quantification was 1 ng ml−1 for R- and S-citalopram as well as for R-and S-DCT, and 5 ng ml−1 for R- and S-DDCT. The interday and intraday coefficients of variation were <15% for R- and S-CT and their monodemethylated metabolites and <20% for R- and S-DDCT. Additional details of these assays can be found in Appendix S1.
Genotyping, genome-wide imputation and quality control
Genotyping of genome-wide single-nucleotide polymorphisms (SNPs) and quality control procedures have been described previously [18]. Genotyping was performed at the RIKEN Center for Integrative Medical Science (Yokohama, Japan) using Illumina Human610-Quad BeadChips (Illumina, San Diego, CA, USA). Details of the genotyping quality control and imputation can be found in Appendix S1. More than 97% of study participants reported their race/ethnicity as white non-Hispanic. Further evaluation of genetic ancestry by use of SNPs for ancestry clustering using the STRUCTURE software [20] provided estimates of the probability of European ancestry [18]. Restricting subjects to those having ≥75% European ancestry and also having drug in their plasma resulted in 435 subjects who qualified for inclusion in the analysis.
Genome-wide association study statistical analysis
Linear mixed models (LMMs) were used to account for within-subject correlations of longitudinal measures of plasma drug/metabolite concentrations (4 and 8 weeks). Specifically, plasma drug/metabolite concentrations were log-transformed, and clinical/demographic variables, including drug, gender, age and other demographic variables, were evaluated for their association with plasma drug concentrations. An association with a P value of 5 × 10⁻⁸ was considered genome-wide significant. Associations of plasma drug/metabolite concentrations with clinical/demographic variables were evaluated with an LMM, as described subsequently in greater detail in the Results. The following variables were found to be statistically significant: age at study entry, gender, drug and prescribed dose (see Appendix S1, Table S1 for P values). These variables were used as adjusting covariates when evaluating the association of SNPs with plasma drug/metabolite concentrations. The random within-subject component was modelled by nesting week of measurement within subjects. The genotype of each SNP was coded as the ‘dose’ of the minor allele, so the effects of SNPs were modelled as additive allelic effects in the LMM. The 4 week dose was sometimes changed by the patients’ physician based on tolerance, side-effects or inadequate response. Our statistical model included the actual prescribed dose as a time-dependent covariate to reflect these changes.
Given that CYP2C19 is known to catalyse the demethylation of CT, we also included known functional alleles of CYP2C19 as covariates in some analyses, classifying patients into ‘poor’, ‘intermediate’ or ‘extensive’ metabolizer phenotypes based on the *2 (SNP rs4244285) and the *17 alleles (SNP rs12248560). No CYP2C19*3 (rs4986893) alleles were observed in our patients.
Database mining and informatics analyses
Details with regard to the tools that were used for database mining and informatic analyses can be found in Appendix S1.
Results
Plasma drug and metabolite concentrations
Plasma samples from 435 MDD patients enrolled in the Mayo Clinic PGRN-AMPS were used to measure plasma concentrations of CT, S-CT and their respective metabolites in blood samples drawn after 4 weeks of therapy, but prior to dose escalation, and at the end of the trial at 8 weeks. Demographic and clinical characteristics of the patients enrolled in the study are listed in Table 1. Among the 435 patients studied, 303 were treated with S-CT and 132 with CT. Given that the S-enantiomers for the parent drug and metabolites are thought to play the major role in their clinical effect [12], we focused our statistical analyses on S-enantiomers.
Table 1.
Demographic and clinical characteristics as well as plasma drug and drug metabolite concentrations for the major depressive disorder patients studied
| S-CT | CT | ||
|---|---|---|---|
| Age at consent | |||
| n | 303 | 132 | |
| Mean (95% CI) | 41.4 (39.8, 42.9) | 37.9 (35.6, 40.2) | |
| Range | (19.0–84.7) | (18.7–82.4) | |
| Gender | |||
| Female | 188 (62.0%) | 89 (67.4%) | |
| Male | 115 (38.0%) | 43 (32.6%) | |
| QIDSC total score at baseline | |||
| n | 303 | 132 | |
| Mean (95% CI) | 15.2 (14.8, 15.5) | 14.8 (14.2, 15.4) | |
| Range | (7.0–25.0) | (9.0–22.0) | |
| QIDSC depression category at baseline | |||
| Mild | 27 (8.9%) | 10 (7.6%) | |
| Moderate | 140 (46.2%) | 67 (50.8%) | |
| Severe | 114 (37.6%) | 46 (34.8%) | |
| Very severe | 22 (7.3%) | 9 (6.8%) | |
| Plasma concentrations at week 4 (ng ml−1) | |||
|---|---|---|---|
| S-CT | S-CT | R-CT | |
| n | 300 | 130 | 130 |
| Mean (95% CI) | 24.3 (22.5, 26) | 16.8 (14.5, 19) | 46.4 (41.4, 51.5) |
| Range | (1.6–119.7) | (2.2–62.9) | (0.0–153.3) |
| S-DCT | S-DCT | R-DCT | |
|---|---|---|---|
| n | 300 | 130 | 130 |
| Mean (95% CI) | 6.4 (6.1, 6.7) | 8.2 (7.1, 9.2) | 7.6 (6.5, 8.7) |
| Range | (1.0–20.1) | (0.0–29.7) | (1.2–41.4) |
| S-DDCT | S-DDCT | R-DDCT | |
|---|---|---|---|
| n | 300 | 130 | 130 |
| Mean (95% CI) | 0.9 (0.8, 0.9) | 0.2 (0.2, 0.3) | 1.2 (1, 1.5) |
| Range | (0.0–4.3) | (0.0–1.8) | (0.0–10.5) |
| Plasma concentrations at week 8 (ng ml−1) | |||
|---|---|---|---|
| S-CT | S-CT | R-CT | |
| n | 264 | 120 | 120 |
| Mean (95% CI) | 33.2 (30.3, 36.1) | 22.8 (18, 27.5) | 64.1 (54.5, 73.7) |
| Range | (1.5–135.0) | (1.3–161.3) | (7.8–294.8) |
| S-DCT | S-DCT | R-DCT | |
|---|---|---|---|
| n | 264 | 120 | 120 |
| Mean (95% CI) | 8.5 (8, 9) | 10.5 (8.8, 12.2) | 10.3 (8.5, 12.2) |
| Range | (0.8–25.9) | (0.0–52.8) | (0.7–48.2) |
| S-DDCT | S-DDCT | R-DDCT | |
|---|---|---|---|
| n | 264 | 120 | 120 |
| Mean (95% CI) | 1 (0.9, 1.1) | 0.4 (0.2, 0.5) | 1.8 (1.3, 2.3) |
| Range | (0.0–5.1) | (0.0–9.0) | (0.0–19.5) |
Abbreviations are as follows: CI, confidence interval; CT, citalopram; DCT, desmethylcitalopram; DDCT, didesmethylcitalopram; S-CT, escitalopram. QIDSC refers to the Quick Inventory of Depressive Symptomatology (QIDS), clinician rated.
Statistical modelling of plasma drug and metabolite concentrations
Plasma drug and metabolite concentrations were measured at 4 and 8 weeks. Of the 435 patients studied, 379 had drug levels at both 4 and 8 weeks, while 56 had only a single assay (51 at 4 weeks and five at 8 weeks), resulting in a total of 814 drug and metabolite measurements. To account for the different number of observations per patient, as well as within-subject correlations of the 4 and 8 week values, we used an LMM, a traditional statistical approach to longitudinal data [21], an approach similar to the nonlinear mixed models that have often been applied for pharmacokinetic analyses [22].
The following variables were found to be statistically significant for most metabolites (see Appendix S1, Table S1 for P values), each variable adjusted for the others: age at study entry (increasing concentrations of metabolites with increasing age), gender (women had higher metabolite concentrations), drug (S-CT had higher metabolite concentrations than did CT) and prescribed dose (CT/2 was equated with the dose of S-CT), with increasing doses, not surprisingly, being associated with higher drug and metabolite concentrations. The effect of increasing age on plasma levels of CT has been reported previously [23]. All of these clinical/demographic variables were used as adjusting covariates during the GWAS analyses described in subsequent paragraphs.
Genome-wide association study for concentrations of parent drug and metabolites
Our current understanding of the sequential, stepwise biotransformation of citalopram is shown schematically in Figure 1. As explained in the preceding paragraph, to make it possible to take advantage of all of the data available for each subject, we used values adjusted for clinical variables within the LMM model as GWAS phenotypes.
The GWAS analyses were performed in two ways. In the first set of analyses, we treated each of the drug or metabolite concentrations as dependent variables in the LMM. However, because the ratio of the product of each biotransformation reaction over the substrate for that reaction might be more meaningful biochemically than the concentrations themselves, we also performed GWAS analysis for the ratios of product/substrate, that is S-DCT/S-CT and S-DDCT/S-DCT. Log transformations of the ratios were used in the analyses. The GWAS analyses described subsequently were performed based on a total of 545 115 SNPs that were genotyped in DNA samples from each of our 435 patients, followed by imputation using ‘1000 Genomes Project’ data as a reference, resulting in a total of 7 537 437 SNPs that were used in the GWAS analyses after imputation.
The Manhattan plot for the GWAS analysis of S-CT concentration in Figure 2A shows the strong association of SNPs in and near the CYP2C19 gene locus on chromosome 10 with concentrations of S-CT. The rs1074145 SNP (P = 4.1 × 10⁻⁹) displayed genome-wide significance, which required a P value of <5.0 × 10⁻⁸. Very strong associations with S-DDCT plasma concentrations were observed in or near the CYP2D6 locus on chromosome 22, with the nonsynonymous SNP, rs1065852 (Pro34Ser, P = 2.0 × 10⁻¹⁶), as one of the SNPs with a very low P value (Figure 2B).
Figure 2.
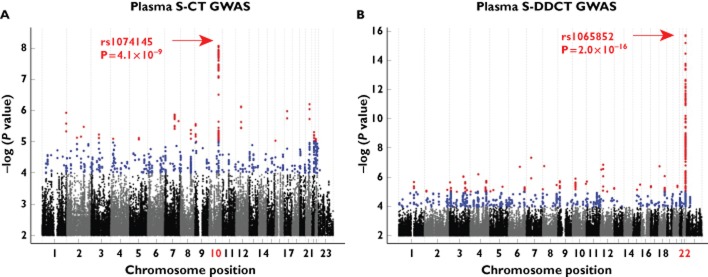
Genome-wide association study (GWAS) analyses for S-citalopram (S-CT) and S-didesmethylcitalopram (S-DDCT) plasma concentrations. (A) Manhattan plot for S-CT plasma concentration GWAS after 1000 Genomes imputation. (B) Manhattan plot for S-DDCT plasma concentration GWAS after 1000 Genomes imputation. Red dots represent single-nucleotide polymorphisms (SNPs) with P values ≤10−5 and blue dots represent SNPs with P values ≤10−4. Associations with P values of 5 × 10⁻⁸ or less were considered genome-wide significant
A plot of regional associations of plasma S-CT concentration for SNPs in and near the CYP2C19 locus is shown in Figure 3A. Genome-wide significant associations (P values <5 × 10⁻⁸) were observed across this region, a region that includes CYP2C18, CYP2C19 and CYP2C9. After adjusting for the effect of CYP2C19 ‘metabolizer phenotypes’ defined on the basis of CYP2C19 functional alleles (*2 and *17) to determine whether we could identify any additional loci that might be associated with plasma S-CT concentrations, we observed two novel loci, SNP rs55734731 on chromosome 20 (P = 3.9 × 10⁻⁷) and rs1722229 SNP on chromosome 7 (P = 9.9 × 10⁻⁷; Table 2). Neither of these two SNPs reached genome-wide significance. In addition, neither of the genes near these SNPs, HSPEP1 (heat shock 10 kDa protein 1 pseudogene) and MYL10 (myosin regulatory light chain 10 gene), respectively, have been reported to play a role in citalopram biotransformation or transport.
Figure 3.
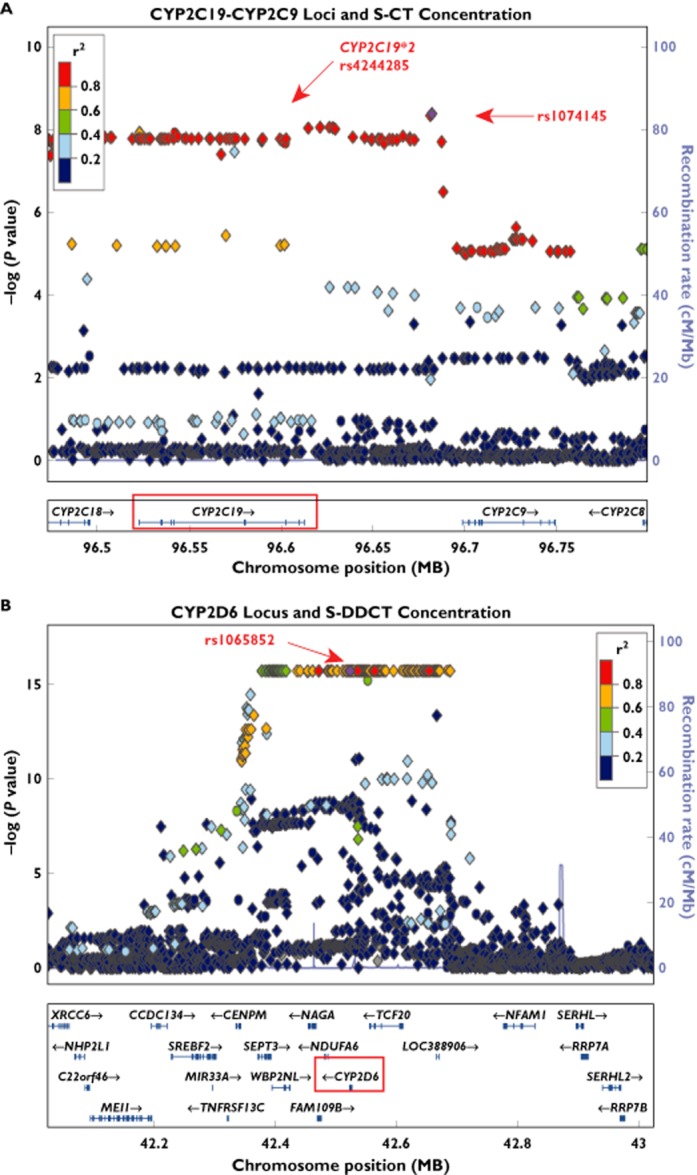
Locus Zoom [31] regional association plots for plasma S-CT and S-DDCT concentrations. (A) The CYP2C19–CYP2C9 locus and the S-CT concentration phenotype. (B) The CYP2D6 locus and the S-DDCT concentration phenotype. Diamond shapes represent imputed SNPs, while circles represent genotyped SNPs. Colours of the points represent linkage equilibrium relationships for the plotted markers with the rs1074145 SNP for the CYP2C19–CYP2C9 locus in (A) and the rs1065852 SNP for the CYP2D6 locus in (B), respectively. Associations with P values of 5 × 10⁻⁸ or less were considered genome-wide significant
Table 2.
Top 10 associations for the GWAS for S-CT concentration and the GWAS for the S-desmethylcitalopram/S-citalopram (S-DCT/S-CT) ratio
| SNP | P value | Genotype | MAF | Chromosome | Chromosome position | Gene | Gene location | Distance to gene (bp) |
|---|---|---|---|---|---|---|---|---|
| S-CT concentration | ||||||||
| rs1074145 | 4.07 × 10⁻⁹ | A/G | 0.162 | 10 | 96681846 | CYP2C19/CYP2C9 | Intergenic | 68829/16569 |
| rs2181097 | 4.51 × 10⁻⁹ | A/G | 0.162 | 10 | 96681000 | CYP2C19/CYP2C9 | Intergenic | 67983/17415 |
| rs12569735 | 8.65 × 10⁻⁹ | G/A | 0.160 | 10 | 96621103 | CYP2C19/CYP2C9 | Intergenic | 8086/77312 |
| rs12573074 | 8.66 × 10⁻⁹ | C/T | 0.161 | 10 | 96626202 | CYP2C19/CYP2C9 | Intergenic | 13185/72213 |
| rs4589212 | 8.83 × 10⁻⁹ | T/A | 0.159 | 10 | 96628105 | CYP2C19/CYP2C9 | Intergenic | 15088/70310 |
| rs35709381 | 9.04 × 10⁻⁹ | T/G | 0.160 | 10 | 96614725 | CYP2C19 | 3′-Downstream | 1708/83690 |
| rs12763230 | 9.54 × 10⁻⁹ | A/G | 0.161 | 10 | 96629341 | CYP2C19/CYP2C9 | Intergenic | 16324/69074 |
| rs17882066 | 1.15 × 10⁻⁸ | A/G | 0.073 | 10 | 96523073 | CYP2C19 | Intronic | 0 |
| rs12773342 | 1.18 × 10⁻⁸ | C/T | 0.119 | 10 | 96523083 | CYP2C19 | Intronic | 0 |
| rs12571421* | 1.24 × 10⁻⁸ | G/A | 0.164 | 10 | 96541982 | CYP2C19 | Intronic | 0 |
| S-CT concentration, adjusted for CYP2C19 alleles | ||||||||
| rs55734731 | 3.91 × 10⁻⁷ | T/C | 0.124 | 20 | 38572414 | HSPEP1 | 5′-Upstream intergenic | 10533 |
| rs62212409 | 4.12 × 10⁻⁷ | G/C | 0.125 | 20 | 38576752 | HSPEP1 | 5′-Upstream intergenic | 14871 |
| rs12479736 | 5.87 × 10⁻⁷ | G/A | 0.122 | 20 | 38584590 | HSPEP1 | 5′-Upstream intergenic | 22709 |
| rs1722229 | 9.90 × 10⁻⁷ | G/T | 0.034 | 7 | 101286177 | MYL10 | 5′-Upstream intergenic | 13601 |
| rs1619382 | 1.07 × 10⁻⁷ | C/T | 0.031 | 7 | 101284857 | MYL10 | 5′-Upstream intergenic | 12281 |
| rs848648 | 1.15 × 10⁻⁶ | A/G | 0.031 | 7 | 101274653 | MYL10 | 5′-Upstream | 2077 |
| rs4727506 | 1.22 × 10⁻⁶ | A/G | 0.030 | 7 | 101270780 | MYL10 | Intronic | 0 |
| rs7799319 | 1.22 × 10⁻⁶ | A/G | 0.030 | 7 | 101269515 | MYL10 | Intronic | 0 |
| rs848645 | 1.24 × 10⁻⁶ | T/C | 0.030 | 7 | 101272926 | MYL10 | 5′-Upstream | 350 |
| rs4727504 | 1.28 × 10⁻⁶ | A/G | 0.031 | 7 | 101269939 | MYL10 | Intronic | 0 |
| S-DCT/S-CT ratio | ||||||||
| rs1074145 | 2.00 × 10⁻¹⁶ | A/G | 0.162 | 10 | 96681846 | CYP2C19/CYP2C9 | Intergenic | 68829/16569 |
| rs2181097 | 2.00 × 10⁻¹⁶ | A/G | 0.162 | 10 | 96681000 | CYP2C19/CYP2C9 | Intergenic | 67983/17415 |
| rs12569735 | 2.00 × 10⁻¹⁶ | G/A | 0.160 | 10 | 96621103 | CYP2C19/CYP2C9 | Intergenic | 8086/77312 |
| rs12573074 | 2.00 × 10⁻¹⁶ | C/T | 0.161 | 10 | 96626202 | CYP2C19/CYP2C9 | Intergenic | 13185/72213 |
| rs4589212 | 2.00 × 10⁻¹⁶ | T/A | 0.159 | 10 | 96628105 | CYP2C19/CYP2C9 | Intergenic | 15088/70310 |
| rs35709381 | 2.00 × 10⁻¹⁶ | T/G | 0.160 | 10 | 96614725 | CYP2C19 | 3′-Downstream | 1708/83690 |
| rs12763230 | 2.00 × 10⁻¹⁶ | A/G | 0.161 | 10 | 96629341 | CYP2C19/CYP2C9 | Intergenic | 16324/69074 |
| rs17882066 | 2.00 × 10⁻¹⁶ | A/G | 0.073 | 10 | 96523073 | CYP2C19 | Intronic | 0 |
| rs12773342 | 2.00 × 10⁻¹⁶ | C/T | 0.119 | 10 | 96523083 | CYP2C19 | Intronic | 0 |
| rs12571421* | 2.00 × 10⁻¹⁶ | G/A | 0.164 | 10 | 96541982 | CYP2C19 | Intronic | 0 |
| S-DCT/S-CT ratio, adjusted for CYP2C19 alleles | ||||||||
| rs71607999 | 7.08 × 10⁻⁹ | A/G | 0.165 | 4 | 189191111 | TRIML1 | 3′-Downstream intergenic | 122214 |
| rs11736476 | 3.28 × 10⁻⁸ | A/G | 0.277 | 4 | 189191166 | TRIML1 | 3′-Downstream intergenic | 122269 |
| rs11725970 | 4.94 × 10⁻⁸ | G/A | 0.224 | 4 | 189189463 | TRIML1 | 3′-Downstream intergenic | 120566 |
| rs9790703 | 8.90 × 10⁻⁸ | T/C | 0.373 | 4 | 189203711 | TRIML1 | 3′-Downstream intergenic | 134814 |
| rs11934750 | 1.49 × 10⁻⁷ | T/A | 0.160 | 4 | 27964405 | AC007106.1 | 3′-Downstream | 4940 |
| rs13115076 | 2.22 × 10⁻⁷ | T/C | 0.228 | 4 | 189194478 | TRIML1 | 3′-Downstream intergenic | 125581 |
| rs13129087 | 2.81 × 10⁻⁷ | T/C | 0.232 | 4 | 189196141 | TRIML1 | 3′-Downstream intergenic | 127244 |
| rs111874200 | 3.56 × 10⁻⁷ | A/G | 0.188 | 4 | 189188713 | TRIML1 | 3′-Downstream intergenic | 119816 |
| rs10024857 | 3.92 × 10⁻⁷ | A/G | 0.136 | 4 | 189188765 | TRIML1 | 3′-Downstream intergenic | 119868 |
| rs13121835 | 6.02 × 10⁻⁷ | A/G | 0.351 | 4 | 189195068 | TRIML1 | 3′-Downstream intergenic | 126171 |
Abbreviations are as follows: DCT, desmethylcitalopram; DDCT, didesmethylcitalopram; GWAS, genome-wide association study; MAF, minor allele frequency; S-CT, escitalopram. Associations with P values of 5 × 10 or less were considered genome-wide significant.
Indicates genotyped SNPs; otherwise, imputed SNPs.
The strongest associations for S-DCT level (Appendix S1) were observed in a region 3′- of the chromobox homologue 4 gene, CBX4, on chromosome 17 (rs9747992, P = 1.6 × 10⁻⁷) and in an intron of a PDZ domain-containing protein gene, PDZD2, on chromosome 5 (rs2059865, P = 2.6 × 10⁻⁷). The SNP associations with S-DCT concentrations were less striking than were those observed with either S-CT or S-DDCT levels, with none reaching genome-wide significance. Adjusting for CYP2C19 metabolizer status did not appear to have a major impact on the strongest associations that we observed for S-DCT and S-DDCT concentrations (Appendix S1).
Genome-wide association study for concentration of metabolite over precursor ratios
To determine whether analyses performed using the ratio of metabolite over precursor for the reactions shown schematically in Figure 1 might provide additional biological insight, the GWAS analyses were repeated using the ratio of metabolite/precursor as a phenotype. The strongest signals for the ratio of S-DCT/S-CT once again mapped to the region of CYP2C19, but with a highly significant P value (P = 2.0 × 10⁻¹⁶ for rs1074145; see Figure 4A). In addition, after adjusting for the effect of the CYP2C19 signal, a novel genome-wide significant association was found on chromosome 4 for the S-DCT/S-CT ratio with SNPs in the vicinity of the tripartite motif family-like 1 gene, TRIML1, with the lowest P value for the rs71607999 SNP (P = 7.1 × 10⁻⁹; Figure 4B). The SNP signal near the TRIML1 locus is shown graphically in the Locus Zoom plot shown in Figure 4C. It should be emphasized that it cannot be assumed that a gene close to a SNP signal is necessarily related to the observed association. The function of the TRIML1 gene is unclear, but, on the basis of sequence homology, it may be an E3 ubiquitin-protein ligase. There is currently no evidence linking TRIML1 to citalopram metabolism or transport. However, data in the Mouse Phenome Database show a significant association between Triml1 mRNA expression in the mouse liver and urinary creatinine concentration (r value = −0.83, P = 2.1 × 10⁻⁴) [24]. The possible mechanism for the relationship of Triml1 to the circulating S-DCT/S-CT ratio will have to be the subject of future studies.
Figure 4.
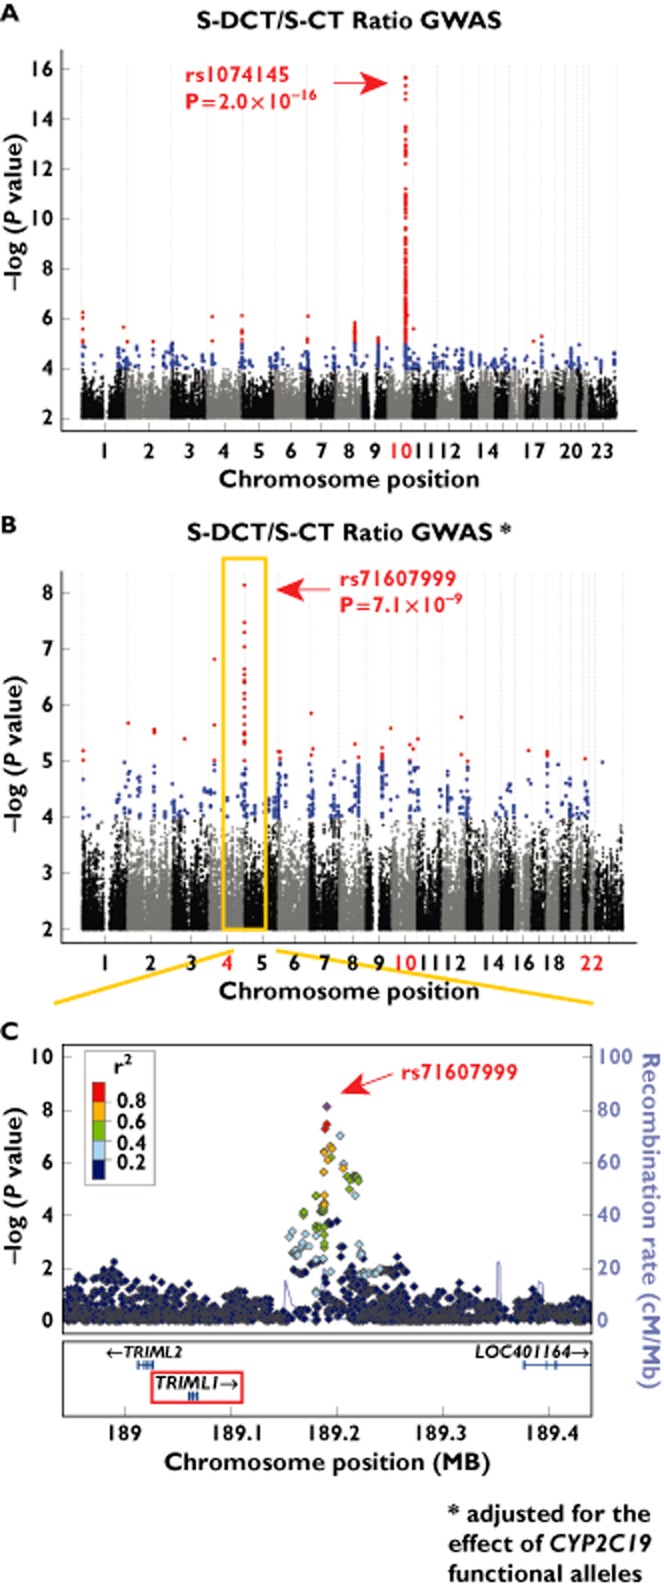
Genome-wide association study analysis results for the S-DCT/S-CT ratio. (A) Manhattan plot for S-DCT/S-CT plasma concentration ratio GWAS after 1000 Genomes imputation. (B) Manhattan plot for S-DCT/S-CT plasma concentration ratio GWAS after 1000 Genomes imputation, adjusted for the effect of CYP2C19 functional alleles. (C) Locus Zoom regional association plot for the SNP signal on chromosome 4 observed for the S-DCT/S-CT ratio GWAS, adjusted for the effect of CYP2C19 functional alleles. Associations with P values of 5 × 10⁻⁸ or less were considered genome-wide significant
Genome-wide association analyses for the S-DDCT/S-DCT ratio, representing the second biotransformation step shown in Figure 1, continued to show very strong associations in a region proximal to CYP2D6 (166 SNPs with P values <1.0 × 10⁻¹⁶). After adjusting for the effect of CYP2C19 functional alleles, no additional signals were observed for this phenotype (see Table 2 and Appendix S1, Figure S1A and B).
The top 10 SNPs in terms of P values for associations with S-CT concentration before or after adjustment for CYP2C19 functional alleles or for the S-DCT/S-CT ratio before or after adjusting for CYP2C19 functional alleles are listed in Table 2, while the top 10 SNPs for associations with S-DCT and S-DDCT concentrations and the S-DDCT/S-DCT ratio are listed in Appendix S1, Tables S1 and S2.
Discussion
Citalopram and escitalopram were developed to inhibit the serotonin transporter (SERT) with specificity, efficacy and tolerability superior to previous SSRIs, and they are currently included among the SSRIs that are most frequently prescribed for the treatment of MDD [1,2]. Although inheritance is thought to play a role in individual variation in response to antidepressant therapy, most pharmacogenetic studies of SSRIs have tended to focus on candidate genes or candidate pathways [16,17]. Those studies have usually included polymorphic genes encoding known components of the SSRI metabolic pathway, e.g. CYP enzymes, or the drug target, the serotonin transporter encoded by the SLC6A4 gene [16,17].
CYP2C19 has previously been reported to catalyse the biotransformation of CT to form its monodesmethyl metabolite (DCT), and CYP2D6 has been reported to play a major role in the conversation of DCT to the didesmethyl metabolite, DDCT [4–7]. Both S- and R-enantiomers of citalopram share similar biotransformation pathways [6,13]. Monodesmethylcitalopram, an active metabolite, displays pharmacological properties similar to those of CT in terms of its affinity for the serotonin transporter, while S-CT has a much higher affinity for SERT than does the racemic mixture [12]. Didesmethylcitalopram, in contrast, appears to play a minor role in SERT inhibition and is only present in vivo at very low concentrations [25]. Given that the number of subjects who were treated with CT in our study was relatively small (n = 130), we focused our GWAS analyses on the S-enantiomer and its metabolites (i.e. S-CT, S-DCT and S-DDCT) measured in plasma obtained from MDD patients at two different treatment time points (4 and 8 weeks). Not surprisingly, the top associations for S-CT and for S-DDCT were observed in genomic regions proximal to CYP2C19 and near the CYP2D6 gene locus on chromosomes 10 and 22, respectively. Those results provide strong evidence in support of previous citalopram biotransformation studies performed with human liver microsomes or recombinant CYP enzymes as well as in vivo candidate gene studies performed with smaller patient populations [4–9,14,25–27]. For example, the top SNP associated with S-CT concentration, rs1074145 (P = 4.1 × 10⁻⁹), was located in a region on chromosome 10 between the CYP2C19 and CYP2C9 genes and was in tight linkage equilibrium with the rs4244285 SNP (r2 = 0. 93) that defines the most common CYP2C19 loss-of-function allele, *2, resulting in the creation of an aberrant splice site by a synonymous alternation in exon 5 of the gene [28]. The CYP2C19 rs4244285 SNP also reached genome-wide significance in our GWAS, with a P value of 1.6 × 10⁻⁸. Included among the SNPs with lowest P values in the GWAS for S-DDCT concentrations (Figure 2B and Appendix S1, Table S2) were two nonsynonymous SNPs located within the CYP2D6 gene, rs1065852 and rs1058172, which altered the encoded amino acids at Pro34Ser and Arg345His, respectively. Both of these SNPs were predicted to have deleterious function based on Sift and Polyphen predictions [29]. The rs1065852 SNP occurs in CYP2D6*4, *10 and *14 variant allozymes, all of which are associated with reduced CYP2D6 activity and ‘poor metabolizer’ phenotypes (http://www.cypalleles.ki.se). The rs1058172 SNP has not been associated with any CYP2D6 haplotype.
Included among the preliminary findings from our study were associations in or near CBX4 on chromosome 17 and in the PDZD2 gene on chromosome 5, both of which were associated with plasma S-DCT concentrations. As mentioned previously, S-DCT has efficacy similar to that of S-CT, at least in terms of its ability to block the SERT. Therefore, these novel genes could be of functional importance. For example, there is evidence that a PDZ scaffold network might facilitate the organization of transporters on epithelial cell membranes [30]. As neither of these signals was genome-wide significant, they obviously have to be regarded as preliminary, requiring future replication and functional genomic validation.
We also performed GWAS analyses using the ratio of each metabolite to its precursor as phenotypes and observed even more highly significant associations with SNPs located in the chromosome 10 region near the CYP2C19 gene for the S-DCT/S-CT ratio (rs1074145, P = 2.0 × 10⁻¹⁶). In addition, after adjustment for CYP2C19 metabolizer status, novel associations in genes beyond the CYP2C19 region on chromosome 10 were found to be associated significantly with S-DCT/S-CT ratio. One of the most intriguing of those observations was a genome-wide significant association for the rs71607999 SNP (P = 7.1 × 10⁻⁹) on chromosome 4, a SNP that maps to an intergenic region 3′ of TRIML1, an association that also requires replication.
In summary, assay of plasma citalopram and citalopram metabolites made it possible for us to perform the GWAS described here. We believe that this study is the first GWAS for plasma concentrations of S-CT and its metabolites. By analysing parent drug and metabolite concentrations as well as ratios of each metabolite over its precursor in the sequential biotransformation pathway shown in Figure 1, we were able to observe associations in loci that include the CYP2C19 and CYP2D6 genes, genes encoding enzymes previously shown in vitro to catalyse citalopram biotransformation. The results of our GWAS not only confirmed those reports but also demonstrated that SNPs in or near these genes are the major genetic factors that contribute to variation in plasma concentrations of both S-CT and S-DDCT. However, several novel genes and loci were also identified. Future functional and mechanistic studies of those novel loci may provide additional insight into the biotransformation and pharmacokinetics of these important SSRI drugs, just as the present studies have confirmed the importance of the results of previous in vitro studies, placed them within a larger genome-wide context and identified novel candidate loci for future study.
Competing Interests
All authors have completed the Unified Competing Interest form at http://www.icmje.org/coi_disclosure.pdf (available on request from the corresponding author) and declare: RMW had support from NIH grants R01 GM28157, U19 GM61388 (The Pharmacogenomics Research Network), a PhRMA Foundation Center of Excellence in Clinical Pharmacology Award and from the Mayo Center for Individualized Medicine; DAM had support from NIH grant P20 1P20AA017830-01; YJ had support from a KL2 Mentored Career Development Award (NCAT UL1 TR000135) and Gerstner Family Mayo Career Development Award in Individualized Medicine and by NCATS UL1 TR00235 for the submitted work; DAM developed intellectual property that was been licensed by and subsequently incorporated into physician decision support software with AssureRx Health in the previous 3 years; no other relationships or activities that could appear to have influenced the submitted work.
Supporting Information
Additional Supporting Information may be found in the online version of this article at the publisher's web-site:
Appendix S1
Additional methods, tables and figures are included as Supporting Information
References
- 1.Lindsley CW. The top prescription drugs of 2011 in the United States: antipsychotics and antidepressants once again lead CNS therapeutics. ACS Chem Neurosci. 2012;3:630–631. doi: 10.1021/cn3000923. [DOI] [PMC free article] [PubMed] [Google Scholar]
- 2.Lindsley CW. The top prescription drugs of 2010 in the United States: antipsychotics show strong growth. ACS Chem Neurosci. 2011;2:276–277. doi: 10.1021/cn200050c. [DOI] [PMC free article] [PubMed] [Google Scholar]
- 3.Preskorn S, Staga C, Feighner J, Ross R, editors. Antidepressants: Past, Present and Future. Berlin-Heidelberg: Springer; 2004. [Google Scholar]
- 4.Kobayashi K, Chiba K, Yagi T, Shimada N, Taniguchi T, Horie T, Tani M, Yamamoto T, Ishizaki T, Kuroiwa Y. Identification of cytochrome P450 isoforms involved in citalopram N-demethylation by human liver microsomes. J Pharmacol Exp Ther. 1997;280:927–933. [PubMed] [Google Scholar]
- 5.Rochat B, Amey M, Gillet M, Meyer UA, Baumann P. Identification of three cytochrome P450 isozymes involved in N-demethylation of citalopram enantiomers in human liver microsomes. Pharmacogenetics. 1997;7:1–10. doi: 10.1097/00008571-199702000-00001. [DOI] [PubMed] [Google Scholar]
- 6.von Moltke LL, Greenblatt DJ, Giancarlo GM, Granda BW, Harmatz JS, Shader RI. Escitalopram (S-citalopram) and its metabolites in vitro: cytochromes mediating biotransformation, inhibitory effects, and comparison to R-citalopram. Drug Metab Dispos. 2001;29:1102–1109. [PubMed] [Google Scholar]
- 7.von Moltke LL, Greenblatt DJ, Grassi JM, Granda BW, Venkatakrishnan K, Duan SX, Fogelman SM, Harmatz JS, Shader RI. Citalopram and desmethylcitalopram in vitro: human cytochromes mediating transformation, and cytochrome inhibitory effects. Biol Psychiatry. 1999;46:839–849. doi: 10.1016/s0006-3223(98)00353-9. [DOI] [PubMed] [Google Scholar]
- 8.Bondolfi G, Chautems C, Rochat B, Bertschy G, Baumann P. Non-response to citalopram in depressive patients: pharmacokinetic and clinical consequences of a fluvoxamine augmentation. Psychopharmacology (Berl) 1996;128:421–425. doi: 10.1007/s002130050152. [DOI] [PubMed] [Google Scholar]
- 9.Yu BN, Chen GL, He N, Ouyang DS, Chen XP, Liu ZQ, Zhou HH. Pharmacokinetics of citalopram in relation to genetic polymorphism of CYP2C19. Drug Metab Dispos. 2003;31:1255–1259. doi: 10.1124/dmd.31.10.1255. [DOI] [PubMed] [Google Scholar]
- 10.Gutierrez M, Abramowitz W. Lack of effect of a single dose of ketoconazole on the pharmacokinetics of citalopram. Pharmacotherapy. 2001;21:163–168. doi: 10.1592/phco.21.2.163.34101. [DOI] [PubMed] [Google Scholar]
- 11.Gutierrez MM, Rosenberg J, Abramowitz W. An evaluation of the potential for pharmacokinetic interaction between escitalopram and the cytochrome P450 3A4 inhibitor ritonavir. Clin Ther. 2003;25:1200–1210. doi: 10.1016/s0149-2918(03)80076-0. [DOI] [PubMed] [Google Scholar]
- 12.Hyttel J, Bogeso KP, Perregaard J, Sanchez C. The pharmacological effect of citalopram residues in the (S)-(+)-enantiomer. J Neural Transm Gen Sect. 1992;88:157–160. doi: 10.1007/BF01244820. [DOI] [PubMed] [Google Scholar]
- 13.Olesen OV, Linnet K. Studies on the stereoselective metabolism of citalopram by human liver microsomes and cDNA-expressed cytochrome P450 enzymes. Pharmacology. 1999;59:298–309. doi: 10.1159/000028333. [DOI] [PubMed] [Google Scholar]
- 14.Foglia JP, Pollock BG, Kirshner MA, Rosen J, Sweet R, Mulsant B. Plasma levels of citalopram enantiomers and metabolites in elderly patients. Psychopharmacol Bull. 1997;33:109–112. [PubMed] [Google Scholar]
- 15.Voirol P, Rubin C, Bryois C, Kosel M, Buclin T, Baumann P. Pharmacokinetic consequences of a citalopram treatment discontinuation. Ther Drug Monit. 1999;21:263–266. doi: 10.1097/00007691-199906000-00001. [DOI] [PubMed] [Google Scholar]
- 16.Kato M, Serretti A. Review and meta-analysis of antidepressant pharmacogenetic findings in major depressive disorder. Mol Psychiatry. 2010;15:473–500. doi: 10.1038/mp.2008.116. [DOI] [PubMed] [Google Scholar]
- 17.Serretti A, Artioli P. The pharmacogenomics of selective serotonin reuptake inhibitors. Pharmacogenomics J. 2004;4:233–244. doi: 10.1038/sj.tpj.6500250. [DOI] [PubMed] [Google Scholar]
- 18.Ji Y, Biernacka JM, Hebbring S, Chai Y, Jenkins GD, Batzler A, Snyder KA, Drews MS, Desta Z, Flockhart D, Mushiroda T, Kubo M, Nakamura Y, Kamatani N, Schaid D, Weinshilboum RM, Mrazek DA. Pharmacogenomics of selective serotonin reuptake inhibitor treatment for major depressive disorder: genome-wide associations and functional genomics. Pharmacogenomics J. 2012;13:456–463. doi: 10.1038/tpj.2012.32. [DOI] [PMC free article] [PubMed] [Google Scholar]
- 19.Ji Y, Hebbring S, Zhu H, Jenkins GD, Biernacka J, Snyder K, Drews M, Fiehn O, Zeng Z, Schaid D, Mrazek DA, Kaddurah-Daouk R, Weinshilboum RM. Glycine and a glycine dehydrogenase (GLDC) SNP as citalopram/escitalopram response biomarkers in depression: pharmacometabolomics-Informed pharmacogenomics. Clin Pharmacol Ther. 2011;89:97–104. doi: 10.1038/clpt.2010.250. [DOI] [PMC free article] [PubMed] [Google Scholar]
- 20.Pritchard JK, Stephens M, Donnelly P. Inference of population structure using multilocus genotype data. Genetics. 2000;155:945–959. doi: 10.1093/genetics/155.2.945. [DOI] [PMC free article] [PubMed] [Google Scholar]
- 21.Diggle P, Heagerty P, Liang K-Y, Zeger S, editors. Analysis of Longitudinal Data. 2nd edn. Oxford: Oxford University Press; 2002. [Google Scholar]
- 22.Sheiner LB, Rosenberg B, Marathe VV. Estimation of population characteristics of pharmacokinetic parameters from routine clinical data. J Pharmacokinet Biopharm. 1977;5:445–479. doi: 10.1007/BF01061728. [DOI] [PubMed] [Google Scholar]
- 23.Leinonen E, Lepola U, Koponen H, Kinnunen I. The effect of age and concomitant treatment with other psychoactive drugs on serum concentrations of citalopram measured with a nonenantioselective method. Ther Drug Monit. 1996;18:111–117. doi: 10.1097/00007691-199604000-00001. [DOI] [PubMed] [Google Scholar]
- 24.Su WL, Sieberts SK, Kleinhanz RR, Lux K, Millstein J, Molony C, Schadt EE. Assessing the prospects of genome-wide association studies performed in inbred mice. Mamm Genome. 2010;21:143–152. doi: 10.1007/s00335-010-9249-7. [DOI] [PubMed] [Google Scholar]
- 25.Baumann P, Larsen F. The pharmacokinetics of citalopram. Rev Contemp Pharmocother. 1996;7:287–295. [Google Scholar]
- 26.Herrlin K, Yasui-Furukori N, Tybring G, Widen J, Gustafsson LL, Bertilsson L. Metabolism of citalopram enantiomers in CYP2C19/CYP2D6 phenotyped panels of healthy Swedes. Br J Clin Pharmacol. 2003;56:415–421. doi: 10.1046/j.1365-2125.2003.01874.x. [DOI] [PMC free article] [PubMed] [Google Scholar]
- 27.Sindrup SH, Brosen K, Hansen MG, Aaes-Jorgensen T, Overo KF, Gram LF. Pharmacokinetics of citalopram in relation to the sparteine and the mephenytoin oxidation polymorphisms. Ther Drug Monit. 1993;15:11–17. doi: 10.1097/00007691-199302000-00002. [DOI] [PubMed] [Google Scholar]
- 28.de Morais SM, Wilkinson GR, Blaisdell J, Nakamura K, Meyer UA, Goldstein JA. The major genetic defect responsible for the polymorphism of S-mephenytoin metabolism in humans. J Biol Chem. 1994;269:15419–15422. [PubMed] [Google Scholar]
- 29.Dayem Ullah AZ, Lemoine NR, Chelala C. SNPnexus: a web server for functional annotation of novel and publicly known genetic variants (2012 update) Nucleic Acids Res. 2012;40:W65–70. doi: 10.1093/nar/gks364. [DOI] [PMC free article] [PubMed] [Google Scholar]
- 30.Moe OW. Scaffolds: orchestrating proteins to achieve concerted function. Kidney Int. 2003;64:1916–1917. doi: 10.1046/j.1523-1755.2003.00346.x. [DOI] [PubMed] [Google Scholar]
- 31.Pruim RJ, Welch RP, Sanna S, Teslovich TM, Chines PS, Gliedt TP, Boehnke M, Abecasis GR, Willer CJ. LocusZoom: regional visualization of genome-wide association scan results. Bioinformatics. 2010;26:2336–2337. doi: 10.1093/bioinformatics/btq419. [DOI] [PMC free article] [PubMed] [Google Scholar]
Associated Data
This section collects any data citations, data availability statements, or supplementary materials included in this article.
Supplementary Materials
Appendix S1
Additional methods, tables and figures are included as Supporting Information