

Abstract
We hypothesized that the aberrant expression of microRNAs (miRNAs) in rheumatoid arthritis (RA) T cells was involved in the pathogenesis of RA. The expression profile of 270 human miRNAs in T cells from the first five RA patients and five controls were analysed by real-time polymerase chain reaction. Twelve miRNAs exhibited potentially aberrant expression in RA T cells compared to normal T cells. After validation with another 22 RA patients and 19 controls, miR-223 and miR-34b were over-expressed in RA T cells. The expression levels of miR-223 were correlated positively with the titre of rheumatoid factor (RF) in RA patients. Transfection of Jurkat cells with miR-223 mimic suppressed insulin-like growth factor-1 receptor (IGF-1R) and transfection with miR-34b mimic suppressed cAMP response element binding protein (CREB) protein expression by Western blotting. The protein expression of IGF-1R but not CREB was decreased in RA T cells. The addition of recombinant IGF-1-stimulated interleukin (IL)-10 production by activated normal T cells, but not RA T cells. The transfection of miR-223 mimic impaired IGF-1-mediated IL-10 production in activated normal T cells. The expression levels of SCD5, targeted by miR-34b, were decreased in RA T cells after microarray analysis. In conclusion, both miR-223 and miR-34b were over-expressed in RA T cells, but only the miR-223 expression levels were correlated positively with RF titre in RA patients. Functionally, the increased miR-223 expression could impair the IGF-1-mediated IL-10 production in activated RA T cells in vivo, which might contribute to the imbalance between proinflammatory and anti-inflammatory cytokines.
Keywords: insulin-like growth factor-1 receptor, interleukin 10, miR-223, rheumatoid arthritis, T cells
Introduction
Rheumatoid arthritis (RA) is a common and disabling chronic inflammatory disease. The pathogenesis of RA is extremely complex and involves both innate and adaptive immune responses [1]. Diverse T cell dysfunctions, including defects in immune homeostatic control, the accumulation of different proinflammatory effector T cell subpopulations and potent reactivity to the formation of neo-autoantigens, such as aggregated immunoglobulins (Ig)Gs or citrullinated peptides, have been characterized in RA patients [2,3]. Even in the very early stages of RA, an abnormal CD4+ T cell genetic signature can already exist in RA patients [4]. Furthermore, inhibition of T cell co-stimulation by soluble cytotoxic T lymphocyte antigen 4 recombinant proteins effectively suppresses joint inflammation in RA patients clinically [5]. These results support the fact that T cells play a crucial role in the pathogenesis of RA.
MicroRNAs (miRNAs) are small, non-coding RNA molecules of 21–24 base pairs that control the expression of multiple gene targets at the post-transcriptional level. Hence, miRNAs are thought to play a crucial role in regulating both innate and adaptive immune responses [6]. Recently, several studies have demonstrated that the expression of miRNAs, including miR-146a, miR-155, miR-16, miR-23b, miR-203, miR-124a, miR-346 and miR-223, was altered in synovial fibroblasts, peripheral blood mononuclear cells and T cells from RA patients [7–15]. This abnormal miRNA expression is associated with abnormal innate immunity [8–11], inflammation [7,12] and cell proliferation [9]. However, the immunopathogenic roles of these aberrantly expressed miRNAs in rheumatoid pathogenesis have not been fully characterized in RA patients. Moreover, due to the complex pathogenesis of RA, we expected that additional miRNAs would be involved in the inflammatory response in RA patients. In the present study, we hypothesized that aberrantly expressed miRNAs in T cells from RA patients affect downstream expressions and functions of target molecules and thereby contribute to the inflammatory response in RA patients.
Material and methods
Patients and controls
Twenty-seven consecutive patients fulfilling the 1987 American College of Rheumatology revised criteria for the classification of RA [16] were recruited for this study. Twenty-four age- and sex-matched healthy volunteers served as controls. The study was approved by the institutional review board and ethics committee of Buddhist Dalin Tzu Chi Hospital, Chiayi, Taiwan (no. B1000301) and all participants provided written informed consent. Blood samples were collected at least 12 h after the last dosage of immunosuppressants to minimize the effects of the drugs.
Both the five first enrolled RA patients and healthy controls were used for analysing the expression profile of 270 human miRNAs in T cells by real-time polymerase chain reaction (PCR) (the screening group). Secondly, we validated the expression levels of these potentially aberrant miRNAs expression in T cells from another 22 RA patients and 19 healthy controls (the validation group). Finally, we analysed the correlation among different clinical parameters and expression levels of miRNA using all the RA patients from both groups, except one patient in the screening group who was excluded due to incomplete medical record. The study design is shown in Fig. 1.
Figure 1.
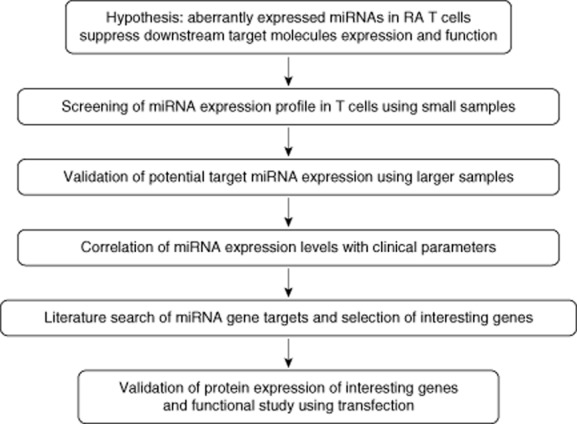
The study design.
Isolation of total RNA from T cells
Heparinized venous blood was obtained from all of the RA patients and healthy volunteers. It was mixed with one-fourth volume of 2% dextran solution (MW 464 000 daltons; Sigma-Aldrich, St Louis, MO, USA), and incubated at room temperature for 30 min. Leucocyte-enriched supernatants were collected and layered over a Ficoll-Hypaque density gradient solution (specific gravity 1·077; Pharmacia Biotech, Uppsala, Sweden). After centrifugation at 250 g for 25 min, mononuclear cells were aspirated from the interface. T cells were purified further with anti-human CD3-coated magnetic beads using the IMag Cell Separation System (BD Bioscience, Franklin Lakes, NJ, USA). The cell concentration of T cells was adjusted to 1 × 10⁶ /ml with RPMI-1640 medium containing 10% heat-inactivated fetal bovine serum, 2 mmol/l L-glutamine, 100 U/ml penicillin and 100 μg/ml streptomycin (10% fetal bovine serum-RPMI) for further analysis. Total RNA, including miRNAs, was extracted from the T cells using the mirVana miRNA isolation kit (Ambion, Austin, TX, USA), according to the manufacturer's protocol. The concentration of RNA was quantified using a NanoDrop 1000 Spectrophotometer (Thermo Scientific, Waltham, MA, USA).
Measurement of miRNAs expression by real-time PCR
All the miRNAs were converted to the corresponding cDNAs in a one-step reverse transcription (RT) reaction according to the method developed by Chen et al. [17], as described previously [18]. A real-time PCR-based method was used to quantify the expression levels of miRNAs using an ABI Prism 7500 Fast Real-Time PCR system (Applied Biosystems, Foster City, CA, USA). The normalized miRNA levels were defined by the equation [39 – threshold cycle (Ct) after normalization by the expression of U6 small nuclear RNA (snRNA)], as described previously [19].
Transfection of miRNA mimics into Jurkat cells or human T cells
Freshly isolated human T cells or Jurkat cells (1 × 10⁶/ml) purchased from the American Type Culture Collection (Manassas, VA, USA) were electroporated with 1 μg of scrambled oligonucleotides (as control group) or specific miRNA mimics (Ambion) using the Gene Pulser MXcell electroporation system (Bio-Rad Laboratories, Hercules, CA, USA) under the conditions developed by Jordan et al. [20]. The expression levels of miRNAs in Jurkat cells transfected with miRNA mimics or scrambled oligonucleotides were analysed by real-time PCR after culture at 37°C in a humidified atmosphere containing 5% CO2 for 24 h.
Measurement of mRNA expression levels by real-time PCR
The mRNA expression levels of specific genes were quantified by real-time PCR using a one-step reverse transcription (RT)–PCR kit (TaKaRa, Shiga, Japan) with an ABI Prism 7500 Fast Real-Time PCR system (Applied Biosystems). The primers for insulin-like growth factor-1 receptor (IGF-1R) were as follows: forward 5′-GGACAGGTCAGAGGGTTTC-3′ and reverse 5′-CTCGTAACTCTTCTCTGTGCC-3′ [21]. The primers for cAMP response element binding protein (CREB1) were as follows: forward 5′-ATTGCTCCTCCCTGGGTAAT-3′ and reverse 5′-CGGTGCCAACTCCAATTTAC-3′ [22]. The primers for stearoylCoA desaturase 5 (SCD5) were as follows: forward 5′-GAGGAATGTCGTCCTGATGA-3′ and reverse 5′-CTGTGGCTCCACAAGCTGA-3′. The primers for MUTED were as follows: forward 5′-ATCACAGACCAGTTATTCAAGG-3′ and reverse 5′-CACTAGCTACTAAGTGGTCAC-3′. The primers for protein tyrosine phosphatase-like A domain containing 1 (PTPLAD1) were as follows: forward 5′-GTCTGTAACACCTGTCAATAC-3′ and reverse 5′-GGGTTTGTAACAATCACTAAG-3′. The primers for kelch repeat and BTB (POZ) domain containing 6 (KBTBD5) were as follows: forward 5′-CTAGCTGAGTGTGCTGGCA-3′ and reverse 5′-CTGCTTGCTCAGAAGGCACT-3′. The primers for chondroitin sulphate proteoglycan 5 (GSPG5) were as follows: forward 5′-CAAGCTGCGTAGGACCAACA-3′ and reverse 5′-AGGACTTGAGAACCTCCTGG-3′.
The following conditions were used for the quantitative PCR: 42°C for 5 min and 95°C for 10 s for RT, followed by 40 cycles of 95°C for 5 s and 60°C for 34 s. Expression of 18S ribosomal RNA was used as an endogenous control for data normalization. The normalized mRNA levels were defined by the equation (39 – Ct after normalization by the expression of 18S ribosomal RNA).
Western blotting of cell lysates
Purified human T cells or Jurkat cells were lysed in 1% NP-40 (Sigma-Aldrich) in the presence of a proteinase inhibitor cocktail (Sigma-Aldrich). Seventy μg of the cell lysates were electrophoresed in 10% sodium dodecyl sulphate polyacrylamide gel electrophoresis gel and transferred to a polyvinylidene difluoride sheet (Sigma-Aldrich). After blocking, the membranes were incubated with the primary antibodies followed by incubation with horseradish peroxidase-conjugated secondary antibodies. Mouse monoclonal anti-IGF-1R and anti-CREB antibodies (abcam, Cambridge, UK) were used as the primary antibodies, and anti-β-actin was used as an internal control (Sigma-Aldrich). Goat anti-mouse IgGs (Jackson ImmunoResearch Laboratories, West Grove, PA, USA) were used as secondary antibodies. The formed complexes were visualized via a chemiluminescence reaction (ECL; GE Healthcare, Little Chalfont, UK). The intensity of the respective band was semi-quantified using Image J software (version 1·42; http://rsb.info.nih.gov/ij).
Functional study of miRNAs in normal T cells after transfection
T cells isolated from a healthy volunteer or RA patients (2 × 10⁶/well) were cultured in an anti-human CD3 antibody (2 μg; BioLegend, San Diego, CA, USA) precoated microplate with anti-human CD28 antibody (2 μg; BioLegend) in the presence or absence of recombinant IGF-1 (50 ng/ml; Millipore, Billerica, MA, USA) for 48 h at 37°C in a humidified atmosphere containing 5% CO2. Then, miR-223 mimic- and scramble oligonucleotide-transfected normal T cells (3 × 10⁶/well) were cultured on the anti-human CD3 antibody (2 μg) precoated plate with 2 μg anti-human CD28 antibody and IGF-1 (50 ng/ml; Millipore) for 48 h at 37°C. The cells were pelleted by centrifugation at 300 g. The supernatants were collected and stored at −80°C for the measurement of interleukin (IL)-10 (BD Biosciences) and transforming growth factor (TGF)-β (R&D Systems, Minneapolis, MN, USA) using enzyme-linked immunosorbent assay (ELISA) kits, according to the manufacturer's protocol. Total RNA were extracted from these transfected normal T cells alone and then analysed the expression of IL-17, tumour necrosis factor-alpha (TNF-α), IL-1β and IL-10 using real-time PCR.
Micorarray analysis
Total RNA was extracted by TRIzol reagent (Invitrogen, Carlsbad, CA, USA), according to the manufacturer's instructions. Purified RNA was quantified at optical density (OD) 260 nm by a ND-1000 spectrophotometer (Thermo Scientific) and qualitated by a Bioanalyzer 2100 (Agilent Technology, Santa Clara, CA, USA) with RNA 6000 labchip kit (Agilent Technologies).
Total RNA (0·2 μg) was amplified with a Low Input Quick-Amp Labeling kit (Agilent Technologies) and labelled with cyanin 3 (Cy3; Agilent Technologies) dye during the in-vitro transcription process; 0·6 μg of Cy3-labelled cRNA was fragmented to an average size of about 50–100 nucleotides by incubation with fragmentation buffer at 60°C for 30 min. Correspondingly fragmented labelled cRNA was then pooled and hybridized to Agilent SurePrint G3 Human V2 GE 8 × 60 K Microarray (Agilent Technologies) at 65°C for 17 h. After washing and drying by nitrogen gun blowing, microarrays were scanned with an Agilent microarray scanner (Agilent Technologies) at 535 nm for Cy3. Scanned images were analysed using Feature extraction version 10·5·1·1 software (Agilent Technologies), an image analysis and normalization software was used to quantify signal and background intensity for each feature. Potential gene targets of the specific miRNA were obtained by using TargetScan version 6·2 (http://www.targetscan.org/index.html) search engine. Next, we compared the potential gene targets of the miRNAs with the microarray results and further validated their mRNA expression levels in T cells from RA patients and controls using real-time PCR.
Statistical analysis
All data are represented as mean ± standard deviation (s.d.). Univariate and multivariate linear regression analyses were applied to calculate correlation coefficients and significances among different parameters using Stata software (StataCorp, College Station, TX, USA). Statistical significance was assessed by either a paired or unpaired Mann–Whitney U-test, as appropriate. A P-value of less than 0·05 was considered statistically significant.
Results
Patients and controls
For RA patients and healthy controls, we recorded their demographic and clinical characteristics including age, sex, rheumatoid factor (RF) positivity, anti-citrullinated protein antibody (ACPA) positivity, C-reactive protein (CRP) and immunosuppressant therapy (Table 1). No statistically significant differences were found in age or sex between the two groups.
Table 1.
Comparison of demographics and clinical data between patients with rheumatoid arthritis and healthy volunteers
| Healthy volunteers (n = 19) | RA patients (n = 22) | P | |
|---|---|---|---|
| Age (mean years ± s.d.) | 50·3 ± 14·9 | 55·3 ± 14·3 | 0·239 |
| Sex (female : male) | 10:9 | 16:6 | 0·183 |
| RF positivity | – | 81·8% (18/22) | |
| ACPA positivity | – | 81·8% (18/22) | |
| CRP (mg/dl) | – | 0·87 ± 1·34 | |
| Immunosuppressants | |||
| Corticosteroids | – | 95·5% (21/22) | |
| Salazopyrine | – | 90·9% (20/22) | |
| MTX | – | 90·9% (20/22) | |
| Leflunomide | – | 27·3% (6/22) | |
| TNF antagonists | – | 27·3% (6/22) | |
ACPA = anti-citrullinated protein antibody; CRP = C-reactive protein; MTX = methotrexate; RA = rheumatoid arthritis; RF = rheumatoid factor; TNF = tumour necrosis factor; – = not available; s.d. = standard deviation.
Detection and verification of differential expression of miRNAs in T cells from RA patients and healthy controls
The expression profile of 270 miRNAs in T cells from RA patients and healthy controls is shown in Fig. 2a. Each scatter-spot represents the average of normalized miRNA levels of T cells from five RA patients and five normal controls. Expression levels of 11 microRNAs, including miR-370, miR-485-5p, miR-17*, miR-372, miR-199a-3p, miR-338-3p, miR-33b, miR-526b, miR-31, miR34b and miR-223, were significantly higher in RA T cells than normal T cells, while levels of miR-532-5p were significantly lower in RA T cells than normal T cells (fold change > 3·8, P < 0·05, Fig. 2b). We validated these aberrantly expressed miRNAs in T cells from another 22 RA patients and 19 healthy controls. The expression levels of miR-223 and miR-34b (fold change 2·78 for miR-223 and 1·39 for miR-34b; P < 0·05) remained significantly higher in RA T cells than normal T cells (Fig. 2c).
Figure 2.
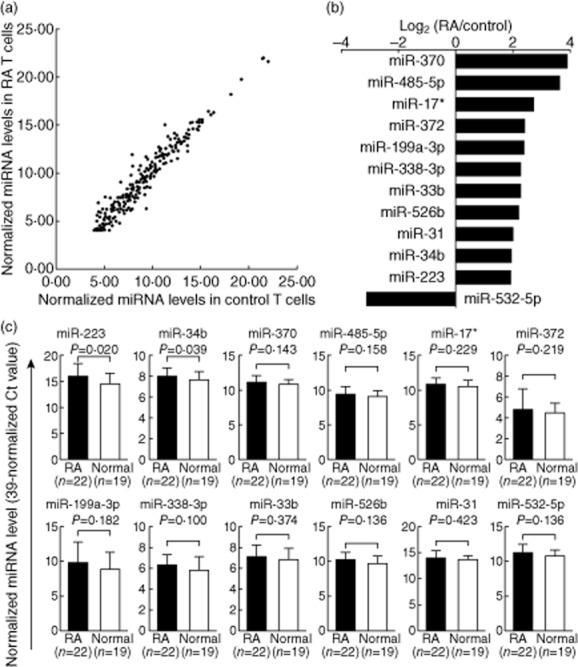
Altered expression of miRNAs in T cells from rheumatoid arthritis (RA) patients and healthy volunteers. (a) The expression profile of 270 miRNAs in T cells from RA and control groups as measured by real-time polymerase chain reaction (PCR). Each scatter-spot represents the average normalized expression level in T cells from the first five RA patients and five healthy controls for each miRNA. (b) Twelve miRNAs were exhibited potentially aberrant expression in RA T cells compared with normal T cells. (c) Only miR-223 and miR-34b were found to be over-expressed in RA T cells after validation using another 22 RA patients and 19 controls. P-values were obtained using the unpaired Mann–Whitney U-test.
Correlations of miR-223 and miR-34b expression levels with the clinical parameters in RA patients
Next, we examined the relationship between different clinical parameters and the expression levels of miR-223 and miR-34b in RA T cells by both univariate and multivariate linear regression analyses. In the univariate analysis, the expression levels of miR-223 were correlated positively with the dosage of steroid treatment and the titre of CRP, RF and ACPAs. In contrast, the expression levels of miR-34b were correlated positively with male sex and the titre of ACPAs (Table 1). After adjustment for age and sex, RF titre, but not CRP level, ACPA titre, or steroid dosage was correlated significantly with the expression levels of miR-223. No clinical parameters were correlated significantly with the expression levels of miR-34b (Table 2).
Table 2.
Univariate and multivariate linear regression models for assessing the correlations among different clinical parameters and expression levels of miR-223 or miR-34b in T cells from 26 patients with rheumatoid arthritis
| Univariate analysis | Multivariate analysis | |||
|---|---|---|---|---|
| Fold change (95% confidence interval) | Fold change (95% confidence interval) | |||
| miR-223 | miR-34b | miR-223† | miR-34b‡ | |
| Age (per 10 years) | 0·99 (0·95–1·03) | 1·07 (0·95–1·20) | 1·00 (0·72–1·41) | 1·08 (0·96–1·20) |
| Sex (male/female) | 3·76 (0·94–15·01) | 1·57* (1·09–2·27) | 0·90 (0·22–3·76) | 1·30 (0·81–2·07) |
| CRP (mg/dl) | 1·97* (1·25–3·11) | 1·11 (0·71–1·28) | 1·40 (0·83–2·35) | 1·06 (0·89–1·25) |
| ACPA (per 10 U/ml) | 1·05* (1·01–1·09) | 1·01* (1·00–1·02) | 1·00 (0·96–1·05) | 1·01 (0·99–1·02) |
| RF (per 10 IU/ml) | 1·08* (1·04–1·12) | 1·00 (0·99–1·02) | 1·06* (1·00–1·11) | – |
| Steroid dosage equivalent to prednisolone (mg/day) | 1·61* (1·23–2·12) | 1·07 (0·98–1·17) | 1·14 (0·78–1·65) | 1·01 (0·90–1·13) |
| MTX dosage (mg/week) | 1·10 (0·94–1·27) | 0·99 (0·95–1·03) | – | – |
| Anti-TNF (yes/no) | 0·35 (0·08–1·57) | 0·89 (0·58–1·37) | – | – |
P < 0·05.
After analysis with multivariate linear regression model by adjusting for age and sex, only RF titre was correlated significantly positively with the expression levels of miR-223.
After analysis with multivariate linear regression model by adjusting for age and sex, no clinical parameters were correlated significantly with the expression levels of miR-34b.
ACPAs = anti-citrullinated protein antibodies; CRP = C-reactive protein; MTX = methotrexate; RF = rheumatoid factor; TNF = tumour necrosis factor; – = not available.
Transfection of miR-223 mimic suppressed IGF-1R protein expression
After searching published articles of miR-223 or miR-34b target genes that could potentially link to the pathogenesis of rheumatoid arthritis, we found that Jia et al. [21] reported that miR-223 could target IGF-1R mRNAs transcript. To elucidate the roles of miR-223 on IGF-1R mRNA and protein expression, we transfected miR-223 mimic or scrambled oligonucleotides (control) into Jurkat cells by electroporation. The expression levels of miR-223 increased dramatically after miR-223 mimic transfection (Fig. 3a). However, the increased miR-223 expression failed to suppress the mRNA expression of IGF-1R (Fig. 3b), whereas miR-223 significantly suppressed the protein expression of IGF-1R in Jurkat cells (Fig. 3c). A representative sample is shown in Fig. 3d. These findings suggested that miR-223 could inhibit the translation of the target protein IGF-1R, but did not accelerate IGF-1R mRNA degradation.
Figure 3.
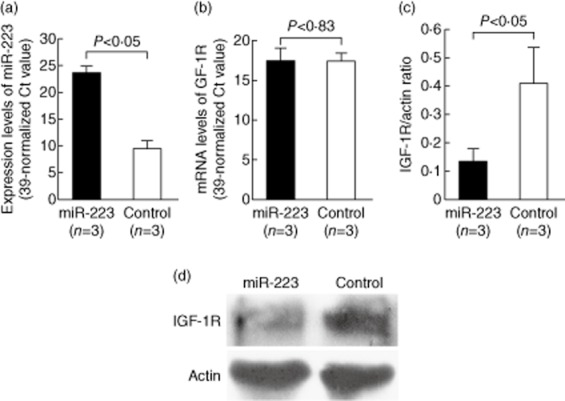
Effects of miR-223 mimic transfection on insulin-like growth factor-1 receptor (IGF-1R) gene expression in Jurkat cells. The mRNA and protein levels of IGF-1R were analysed 24 h after transfection. (a) The expression of miR-223 was remarkably elevated in Jurkat cells after transfection with miR-223 mimic compared with cells that were transfected with scramble oligonucleotides (control group). (b) Expression of IGF-1R mRNA was not affected by miR-223 mimic transfection. (c) IGF-1R protein expression was suppressed significantly in Jurkat cells 24 h after miR-223 mimic transfection. (d) A representative example of IGF-1R protein expression by Western blotting after miR-223 mimic transfection.
Transfection of miR-34b mimic suppressed CREB protein expression
Pigazzi et al. [22] demonstrated that miR-34b could target the CREB gene transcript. Accordingly, we transfected miR-34b mimic or scrambled oligonucleotides (control) into Jurkat cells by electroporation to evaluate the effects on mRNA and protein expression of CREB. Similar to the miR-223 mimic transfection, the mRNA expression levels of miR-34b increased dramatically after miR-34b mimic transfection (Fig. 4a). The increased miR-34b expression did not suppress CREB mRNA expression (Fig. 4b), but suppressed CREB protein expression significantly in Jurkat cells (Fig. 4c). A representative result is shown in Fig. 4d. These findings suggested that miR-34b could inhibit the translation of the target protein CREB but did not accelerate its mRNA degradation.
Figure 4.
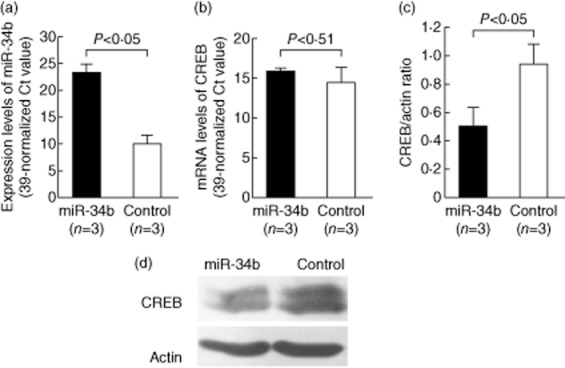
Effects of miR-34b mimic transfection on cAMP-response element binding protein (CREB) gene expression in Jurkat cells. The mRNA and protein expression of CREB was analysed 24 h after transfection. (a) The expression levels of miR-34b were remarkably elevated in Jurkat cells after transfection with miR-34b mimic compared with cells transfected with the scramble oligonucleotides (control group). (b) The CREB mRNA expression levels were not affected by miR-34b mimic transfection. (c) CREB protein expression was suppressed significantly in Jurkat cells 24 h after miR-34b mimic transfection. (d) A representative example of CREB protein expression by Western blotting after miR-34b mimic transfection.
Comparison of IGF-1R and CREB protein expression in T cells from RA patients and healthy controls
To verify the potential biological and pathological roles of increased miR-223 and miR-34b expression in RA T cells, we compared the protein expression of IGF-1R and CREB in T cell lysates from RA patients and healthy controls by Western blotting (Fig. 5). The protein levels of IGF-1R (Fig. 5a), but not CREB (Fig. 5b), were significantly lower in RA T cells compared with normal T cells. The results from three RA and two control T cell samples are shown in Fig. 5c as representative examples.
Figure 5.
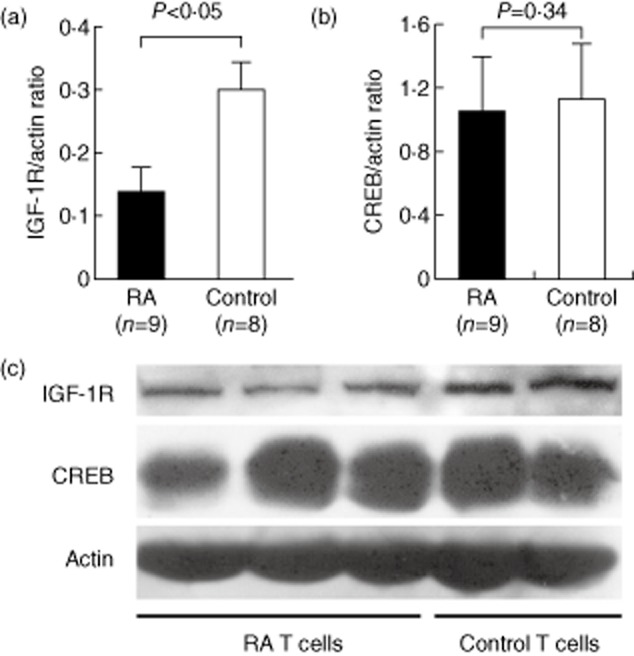
Comparison of insulin-like growth factor-1 receptor (IGF-1R) (targeted by miR-223) and CREB (targeted by miR-34b) protein expression in T cell lysates from rheumatoid arthritis (RA) and control groups as detected by Western blotting. (a) IGF-1R and (b) CREB levels from nine RA patients and eight healthy controls normalized to actin expression are shown. (c) A representative example of IGF-1R and CREB protein expression levels in T cell lysates from three RA patients and two healthy controls.
Transfection of miR-223 mimic inhibited IGF-1-mediated IL-10 secretion in anti-CD3 and anti-CD28 antibody-activated human T cells
We demonstrated that miR-223 transfection also suppresses the protein expression of IGR-1R in normal T cells (Fig. 6a,b). Kooijman et al. [23] reported that IGF-1 could stimulate IL-10, an important anti-inflammatory cytokine, production by activated normal human T cells. We hypothesized that the increased miR-223 levels could suppress IGF-1R expression, leading to impaired IL-10 production upon IGF-1 stimulation in RA T cells. First, we demonstrated that the addition of IGF-1 could stimulate IL-10 production in anti-CD3 and anti-CD28 antibody-activated normal T cells but not RA T cells (Fig. 6c). Upon stimulation of IGF-1, anti-CD3 and anti-CD28 antibody-activated normal T cells indeed produced more IL-10 than RA T cells (159·1 ± 113·7 pg/ml versus 41·4 ± 39·7, P = 0·045), as anticipated. The difference in IL-10 production in anti-CD3 and anti-CD28 antibody-activated normal and RA T cells without IGF-1 did not reach statistical significance (113·6 ± 93·1 pg/ml versus 57·8 ± 60·7, P = 0·27). In normal T cells, this IGF-1-enhanced IL-10 production was suppressed significantly by the transfection of miR-223 mimic, compared to levels following transfection of scrambled oligonucleotides (Fig. 6d). We also analysed the concentration of TGF-β, but we did not find any difference between activated RA and normal T cells with or without IGF-1. The transfection of miR-223 did not affect the production of TGF-β from T cells upon activation by anti-CD3 and anti-CD28 antibody in the presence of IGF-1 (Fig. 7a,b). We also investigated the direct effect of miR-223 on the expression of cytokines genes. We found that transfection of miR-223 alone to normal T cells did not affect the mRNA expression levels of IL-17, TNF-α, IL-1β and IL-10 (Fig. 7c).
Figure 6.
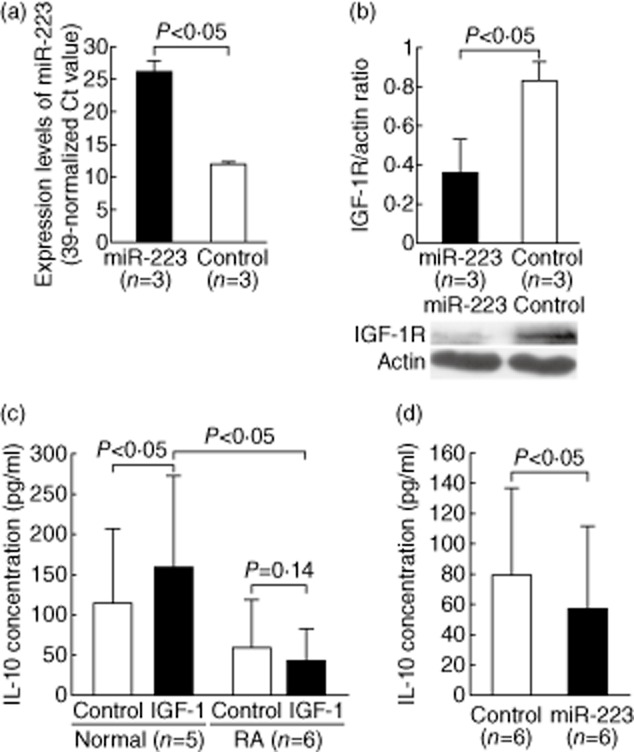
Functional study of miR-223 on interleukin (IL)-10 production in activated T cells. (a) The expression levels of miR-223 were increased in normal T cells after miR-223 mimic transfection. (b) The protein expression of IGF-1R was decreased in normal T cells 24 h after miR-223 mimic transfection. (c) After co-culture with IGF-1 (50 ng/ml) for 2 days, IL-10 production increased in anti-CD3 and anti-CD28 antibody-activated normal T cells but not rheumatoid arthritis (RA) T cells. (d) After transfection of miR-223 mimic, the IGF-1-mediated production of IL-10 decreased in anti-CD3 and anti-CD28 antibody-activated normal T cells compared with the control group.
Figure 7.
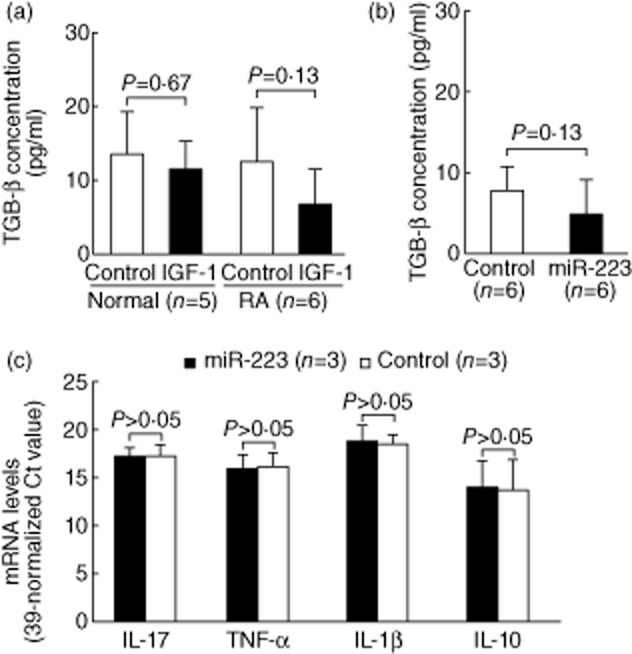
Effect of insulin-like growth factor-1 (IGF-1) and miR-223 on transforming growth factor (TGF)-β production in activated T cells and direct effect of miR-223 on cytokines gene expression. (a) After co-culture with IGF-1, there were no differences for TGF-β secretion in anti-CD3 and anti-CD28 antibody-activated between normal and rheumatoid arthritis (RA) T cells. (b) The transfection of miR-223 mimic did not affect TGF-β production in anti-CD3 and anti-CD28 antibody-activated normal T cells in the presence of IGF-1 (c) There were no differences in the interleukin (IL)-17, TNF-α, IL-1β, and IL-10 mRNA levels between normal T cells after miR-223 mimic or scrambled oligonucleotide transfection.
Microarray analysis of gene expression in T cells from RA patients and controls compared to the prediction targets of miR-223 and miR-34b
It has been shown that the effect of miRNA on gene expression was largely through the degradation of mRNA [24]. Therefore, we analysed the gene expression profile of T cells from three RA patients and three controls (Fig 8a), and compared the profile to the predicted targets of miR-223 and miR-34b. Among the predicted targets of miR-223, the mRNA expression of (CSPG5) was decreased significantly in RA T cells compared with normal T cells. Among the predicted targets of miR-34b, the mRNA expression of SCD5, MUTED, PTPLAD1 and KBTBD6 was decreased significantly in RA T cells in the microarray study (Fig. 8b). After validation, only the expression levels of SCD5 were significantly lower in RA T cells compared with the controls (fold change 0·47; P < 0·05; Fig. 8c). A diagram summarizing the results is shown in Fig. 8d.
Figure 8.
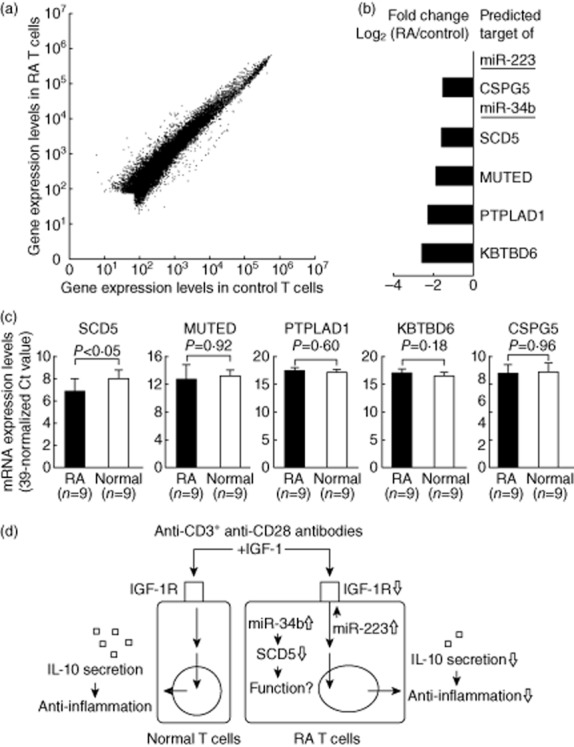
Identified new target genes in rheumatoid arthritis (RA) T cells regulated by miR-223 or miR-34b using microarray analysis: (a) The gene expression profiles in T cells from three RA and three controls using microarray analysis. Each scatter-spot represents the average log10-transformed raw signal intensities of the cyanin 3 (Cy3)-labelled media for each probe in T cells from three RA patients and three healthy controls. (b) Five of predicted genes targeted by miR-223 or miR-34b were found potentially under-expressed in RA T cells compared to normal T cells. (c) Only the expression levels of stearoylCoA desaturase 5 (SCD5) were decreased in RA T cells after validation. P-values were obtained using the unpaired Mann–Whitney U-test. (d) Overview of over-expressed miR-223 and miR-34b in RA T cells. Insulin-like growth factor-1 (IGF-1) could stimulate interleukin (IL)-10 production by activated normal T cells. Increased expression of miR-223 suppressed IGF-1R expression and decreased IGF-1-mediated IL-10 production in activated RA T cells. The functional roles of SCD5, targeted by miR-34b, in RA T cells will require further investigation.
Discussion
Li et al. [25] and Niimoto et al. [26] reported that several miRNAs, including miR-146a/b, let-7a, miR-26, miR-150, miR-155, miR-363 and miR-498, were expressed differentially in RA T cells. These miRNAs were all included in the 270 miRNAs screened in the present study. However, only miR-223 and miR-34b expression levels were increased significantly in RA T cells. Notably, some false-positive and false-negative results might have occurred in the screening phase with our small sample size. In addition, differences in many parameters, such as detection methodology, cell subpopulations (IL-17-producing T cells, CD4+ T cells or total T cells) and a patient population with different genetic backgrounds, disease activity or medication use in RA patients might have potentially affected the expression profiles of the miRNAs.
The increased expression of miR-223 in RA T cells was consistent with several previous studies. Fulci et al. [15] found that the expression levels of miR-223 were increased in RA T cells. Increased expression of miR-223 was detected in both T cells [27] and sera [28] from patients with the early RA. The increased expression of miR-223 was also found in RA synovial tissues [29]. Pandis et al. [30] also showed that the expression of miR-223 was increased in synovial fluid in a human tumour necrosis factor transgenic mouse model. However, there were some debates on the role of miR-223 in the pathogenesis of RA. Shibuya et al. [31] demonstrated the over-expression of miR-223 suppressed osteoclastogenesis in vitro. Sugatani et al. [32] showed that miR-223 could block osteoclast differentiation, perhaps providing a benefit for RA patients. Conversely, Li et al. [33] demonstrated that silence of miR-233 expression eventually reduced the disease severity in collagen-induced arthritis. Our study provided an explanation that the increased expression of miR-223 could impair IL-10 production in activated RA T cells through targeting IGF-1R.
Originally, IGF-1 acts as a growth factor but it could also antagonize the effect of several inflammatory cytokines such as TNF-α and IL-1β [34]. Low plasma levels of IGF-1 were found in RA patients [35,36] and elevated IGF binding-proteins further decreased the bioavailability of IGF-1 in RA patients [37]. Dhaunsi et al. also showed an association between IGF-1 gene polymorphism and the development of RA [38]. With regard to the expression of its receptor IGF-1R, we noted that Laurberg et al. [39] showed that the median fluorescence intensity but not the fraction of IGF-1R+CD4+ cells was increased among CD4+ T lymphocytes in RA patients. In contrast, using RT–PCR, Böstrom et al. [40] demonstrated that the gene expression of IGR-1R was decreased in synovium from RA patients compared with those from OA patients. In our study, IGF-1R protein expression was decreased in CD3+ T cells from RA patients by Western blotting. Different cell origin and detection methodology could explain this discrepancy, reflecting the complex immunopathogenesis of RA. In this study, we demonstrated that IGF-1 could promote the production of IL-10 in human activated T cells, which is in agreement with the results reported by Kooijman [23]. Regarding the IGF-1 used in this study, we tried to mimic the in-vitro condition as much as we could. Initially, we tested with an IGF-1 level in the range of 98–141 ng/ml based on Friedrich et al. study in 55–59-year-old healthy women [41]. However, we had to change the level to 50 ng/ml in consideration of the lack of IGF-1 binding protein in our culture condition. Due to the low expression levels of IGF-1R in RA T cells, IGF-1 did not stimulate IL-10 production in activated RA T cells in our study as anticipated (Fig. 6). IL-10 is a potent anti-inflammatory cytokine involved in the control of proinflammatory cytokine production in RA synovial tissue [42]. The imbalance of proinflammatory cytokines and anti-inflammatory cytokines, including IL-10, are well characterized in the pathogenesis of RA [43]. The administration of IL-10 suppressed joint inflammation in collage-induced arthritis [44] and IL-10 also suppressed the expression of IL-17 in RA patients [45].
IL-17, TNF-α and IL-1β are also important cytokines in the pathogenesis of RA and regulate the cellular immune responses in many dimensions, such as controlling the development and function of the regulatory T cells, generating T cell memory and modulating the secretion of cytokines [46–48]. However, we found that transfection of miR-223 alone to normal T cells did not affect the mRNA expression levels of IL-17, TNF-α and IL-1β.
Although the expression of miR-34b was elevated significantly in RA T cells, the protein expression of CREB target by miR-34b did not change in RA T cells. CREB is a transcription factor, and its expression and activity have been reported to associate with the synovial cells dysfunction in RA patients [49]. Furthermore, CREB could enhance IL-17 production in a mouse model of atherosclerosis [50]. It is possible that other molecules and/or signalling pathways might compensate effectively for suppressed CREB expression by over-expressing miR-34b. In addition, miR-34b and its family members could play important roles in carcinogenesis via regulation of the cell cycle, apoptosis and senescence [51]. Among the miR-34b potential target genes, expression of the SCD5 gene was decreased significantly in RA T cells. SCD5 is a member of stearoylCoA desaturase, which is known to control the rate of lipogenesis, cell proliferation and carcinogenesis [52]. The biological function of SCD5 on T cell function is unknown, and further studies will be needed to clarify its roles in the pathogenesis of RA.
In conclusion, we found that increased expression of miR-223 suppresses IGF-1R expression and decreased IGF-1 mediated IL-10 production in RA T cells. However, the immunopathogenetic roles of SCD5, targeted by miR-34b, in RA T cells will require further investigation.
Acknowledgments
This work was supported by a grant from the National Science Council (NCS 101–2314-B-303-028-MY3) and Dalin Tzu Chi Hospital, Buddhist Tzu Chi Medical Foundation (DTCRD101-I-07), Taiwan.
Disclosures
The authors declare no conflicts of interest.
References
- 1.Cooles FA, Isaacs JD. Pathophysiology of rheumatoid arthritis. Curr Opin Rheumatol. 2011;23:233–240. doi: 10.1097/BOR.0b013e32834518a3. [DOI] [PubMed] [Google Scholar]
- 2.Isaacs JD. Therapeutic T-cell manipulation in rheumatoid arthritis: past, present and future. Rheumatology (Oxf) 2008;47:1461–1468. doi: 10.1093/rheumatology/ken163. [DOI] [PubMed] [Google Scholar]
- 3.Goronzy JJ, Weyand CM. Developments in the scientific understanding of rheumatoid arthritis. Arthritis Res Ther. 2009;11:249. doi: 10.1186/ar2758. [DOI] [PMC free article] [PubMed] [Google Scholar]
- 4.Pratt AG, Swan DC, Richardson S, et al. A CD4 T cell gene signature for early rheumatoid arthritis implicates interleukin 6-mediated STAT3 signalling, particularly in anti-citrullinated peptide antibody-negative disease. Ann Rheum Dis. 2012;71:1374–1381. doi: 10.1136/annrheumdis-2011-200968. [DOI] [PMC free article] [PubMed] [Google Scholar]
- 5.Kremer JM, Westhovens R, Leon M, et al. Treatment of rheumatoid arthritis by selective inhibition of T-cell activation with fusion protein CTLA4Ig. N Engl J Med. 2003;349:1907–1915. doi: 10.1056/NEJMoa035075. [DOI] [PubMed] [Google Scholar]
- 6.Pauley KM, Cha S, Chan EK. MicroRNA in autoimmunity and autoimmune diseases. J Autoimmun. 2009;32:189–194. doi: 10.1016/j.jaut.2009.02.012. [DOI] [PMC free article] [PubMed] [Google Scholar]
- 7.Kurowska-Stolarska M, Alivernini S, Ballantine LE, et al. MicroRNA-155 as a proinflammatory regulator in clinical and experimental arthritis. Proc Natl Acad Sci USA. 2011;108:11193–11198. doi: 10.1073/pnas.1019536108. [DOI] [PMC free article] [PubMed] [Google Scholar]
- 8.Semaan N, Frenzel L, Alsaleh G, et al. miR-346 controls release of TNF-alpha protein and stability of its mRNA in rheumatoid arthritis via tristetraprolin stabilization. PLOS ONE. 2011;6:e19827. doi: 10.1371/journal.pone.0019827. [DOI] [PMC free article] [PubMed] [Google Scholar]
- 9.Nakamachi Y, Kawano S, Takenokuchi M, et al. MicroRNA-124a is a key regulator of proliferation and monocyte chemoattractant protein 1 secretion in fibroblast-like synoviocytes from patients with rheumatoid arthritis. Arthritis Rheum. 2009;60:1294–1304. doi: 10.1002/art.24475. [DOI] [PubMed] [Google Scholar]
- 10.Pauley KM, Satoh M, Chan AL, Bubb MR, Reeves WH, Chan EK. Upregulated miR-146a expression in peripheral blood mononuclear cells from rheumatoid arthritis patients. Arthritis Res Ther. 2008;10:R101. doi: 10.1186/ar2493. [DOI] [PMC free article] [PubMed] [Google Scholar]
- 11.Zhu S, Pan W, Song X, et al. The microRNA miR-23b suppresses IL-17-associated autoimmune inflammation by targeting TAB2, TAB3 and IKK-alpha. Nat Med. 2012;18:1077–1086. doi: 10.1038/nm.2815. [DOI] [PubMed] [Google Scholar]
- 12.Stanczyk J, Ospelt C, Karouzakis E, et al. Altered expression of microRNA-203 in rheumatoid arthritis synovial fibroblasts and its role in fibroblast activation. Arthritis Rheum. 2011;63:373–381. doi: 10.1002/art.30115. [DOI] [PMC free article] [PubMed] [Google Scholar]
- 13.Nakasa T, Miyaki S, Okubo A, et al. Expression of microRNA-146 in rheumatoid arthritis synovial tissue. Arthritis Rheum. 2008;58:1284–1292. doi: 10.1002/art.23429. [DOI] [PMC free article] [PubMed] [Google Scholar]
- 14.Stanczyk J, Pedrioli DM, Brentano F, et al. Altered expression of MicroRNA in synovial fibroblasts and synovial tissue in rheumatoid arthritis. Arthritis Rheum. 2008;58:1001–1009. doi: 10.1002/art.23386. [DOI] [PubMed] [Google Scholar]
- 15.Fulci V, Scappucci G, Sebastiani GD, et al. miR-223 is overexpressed in T-lymphocytes of patients affected by rheumatoid arthritis. Hum Immunol. 2010;71:206–211. doi: 10.1016/j.humimm.2009.11.008. [DOI] [PubMed] [Google Scholar]
- 16.Arnett FC, Edworthy SM, Bloch DA, et al. The American Rheumatism Association 1987 revised criteria for the classification of rheumatoid arthritis. Arthritis Rheum. 1988;31:315–324. doi: 10.1002/art.1780310302. [DOI] [PubMed] [Google Scholar]
- 17.Chen C, Ridzon DA, Broomer AJ, et al. Real-time quantification of microRNAs by stem-loop RT–PCR. Nucleic Acids Res. 2005;33:e179. doi: 10.1093/nar/gni178. [DOI] [PMC free article] [PubMed] [Google Scholar]
- 18.Lai NS, Yu HC, Chen HC, Yu CL, Huang HB, Lu MC. Aberrant expression of microRNAs in T cells from patients with ankylosing spondylitis contributes to the immunopathogenesis. Clin Exp Immunol. 2013;173:47–57. doi: 10.1111/cei.12089. [DOI] [PMC free article] [PubMed] [Google Scholar]
- 19.Lu MC, Lai NS, Chen HC, et al. Decreased microRNA(miR)-145 and increased miR-224 expression in T cells from patients with systemic lupus erythematosus involved in lupus immunopathogenesis. Clin Exp Immunol. 2013;171:91–99. doi: 10.1111/j.1365-2249.2012.04676.x. [DOI] [PMC free article] [PubMed] [Google Scholar]
- 20.Jordan ET, Collins M, Terefe J, Ugozzoli L, Rubio T. Optimizing electroporation conditions in primary and other difficult-to-transfect cells. J Biomol Tech. 2008;19:328–334. [PMC free article] [PubMed] [Google Scholar]
- 21.Jia CY, Li HH, Zhu XC, et al. MiR-223 suppresses cell proliferation by targeting IGF-1R. PLOS ONE. 2011;6:e27008. doi: 10.1371/journal.pone.0027008. [DOI] [PMC free article] [PubMed] [Google Scholar]
- 22.Pigazzi M, Manara E, Baron E, Basso G. miR-34b targets cyclic AMP-responsive element binding protein in acute myeloid leukemia. Cancer Res. 2009;69:2471–2478. doi: 10.1158/0008-5472.CAN-08-3404. [DOI] [PubMed] [Google Scholar]
- 23.Kooijman R, Coppens A. Insulin-like growth factor-I stimulates IL-10 production in human T cells. J Leukoc Biol. 2004;76:862–867. doi: 10.1189/jlb.0404248. [DOI] [PubMed] [Google Scholar]
- 24.Guo H, Ingolia NT, Weissman JS, Bartel DP. Mammalian microRNAs predominantly act to decrease target mRNA levels. Nature. 2010;466:835–840. doi: 10.1038/nature09267. [DOI] [PMC free article] [PubMed] [Google Scholar]
- 25.Li J, Wan Y, Guo Q, et al. Altered microRNA expression profile with miR-146a upregulation in CD4+ T cells from patients with rheumatoid arthritis. Arthritis Res Ther. 2010;12:R81. doi: 10.1186/ar3006. [DOI] [PMC free article] [PubMed] [Google Scholar]
- 26.Niimoto T, Nakasa T, Ishikawa M, et al. MicroRNA-146a expresses in interleukin-17 producing T cells in rheumatoid arthritis patients. BMC Musculoskelet Disord. 2010;11:209. doi: 10.1186/1471-2474-11-209. [DOI] [PMC free article] [PubMed] [Google Scholar]
- 27.Sebastiani GD, Fulci V, Niccolini S, et al. Over-expression of miR-223 in T-lymphocytes of early rheumatoid arthritis patients. Clin Exp Rheumatol. 2011;29:1058–1059. [PubMed] [Google Scholar]
- 28.Filková M, Aradi B, Senolt L, et al. Association of circulating miR-223 and miR-16 with disease activity in patients with early rheumatoid arthritis. Ann Rheum Dis. 2013 doi: 10.1136/annrheumdis-2012-202815. doi: 10.1136/annrheumdis-2012-202815 [Epub ahead of print] [DOI] [PMC free article] [PubMed] [Google Scholar]
- 29.Murata K, Yoshitomi H, Tanida S, et al. Plasma and synovial fluid microRNAs as potential biomarkers of rheumatoid arthritis and osteoarthritis. Arthritis Res Ther. 2010;12:R86. doi: 10.1186/ar3013. [DOI] [PMC free article] [PubMed] [Google Scholar]
- 30.Pandis I, Ospelt C, Karagianni N, et al. Identification of microRNA-221/222 and microRNA-323-3p association with rheumatoid arthritis via predictions using the human tumour necrosis factor transgenic mouse model. Ann Rheum Dis. 2012;71:1716–1723. doi: 10.1136/annrheumdis-2011-200803. [DOI] [PubMed] [Google Scholar]
- 31.Shibuya H, Nakasa T, Adachi N, et al. Overexpression of microRNA-223 in rheumatoid arthritis synovium controls osteoclast differentiation. Mod Rheumatol. 2013;23:674–685. doi: 10.1007/s10165-012-0710-1. [DOI] [PubMed] [Google Scholar]
- 32.Sugatani T, Hruska KA. MicroRNA-223 is a key factor in osteoclast differentiation. J Cell Biochem. 2007;101:996–999. doi: 10.1002/jcb.21335. [DOI] [PubMed] [Google Scholar]
- 33.Li YT, Chen SY, Wang CR, et al. Brief report: amelioration of collagen-induced arthritis in mice by lentivirus-mediated silencing of microRNA-223. Arthritis Rheum. 2012;64:3240–3245. doi: 10.1002/art.34550. [DOI] [PubMed] [Google Scholar]
- 34.O'Connor JC, McCusker RH, Strle K, Johnson RW, Dantzer R, Kelley KW. Regulation of IGF-I function by proinflammatory cytokines: at the interface of immunology and endocrinology. Cell Immunol. 2008;252:91–110. doi: 10.1016/j.cellimm.2007.09.010. [DOI] [PMC free article] [PubMed] [Google Scholar]
- 35.Engvall IL, Elkan AC, Tengstrand B, Cederholm T, Brismar K, Hafstrom I. Cachexia in rheumatoid arthritis is associated with inflammatory activity, physical disability, and low bioavailable insulin-like growth factor. Scand J Rheumatol. 2008;37:321–328. doi: 10.1080/03009740802055984. [DOI] [PubMed] [Google Scholar]
- 36.Lemmey A, Maddison P, Breslin A, et al. Association between insulin-like growth factor status and physical activity levels in rheumatoid arthritis. J Rheumatol. 2001;28:29–34. [PubMed] [Google Scholar]
- 37.Neidel J. Changes in systemic levels of insulin-like growth factors and their binding proteins in patients with rheumatoid arthritis. Clin Exp Rheumatol. 2001;19:81–84. [PubMed] [Google Scholar]
- 38.Dhaunsi GS, Uppal SS, Haider MZ. Insulin-like growth factor-1 gene polymorphism in rheumatoid arthritis patients. Scand J Rheumatol. 2012;41:421–425. doi: 10.3109/03009742.2012.691177. [DOI] [PubMed] [Google Scholar]
- 39.Laurberg TB, Ellingsen T, Thorsen J, et al. Insulin-like growth factor I receptor density on CD4+T-lymphocytes from active early steroid- and DMARD-naive rheumatoid arthritis patients is up-regulated and not influenced by 1 year of clinically effective treatment. Rheumatol Int. 2012;32:501–504. doi: 10.1007/s00296-010-1683-z. [DOI] [PubMed] [Google Scholar]
- 40.Boström EA, Bostrom EA, Svensson M, et al. Resistin and insulin/insulin-like growth factor signaling in rheumatoid arthritis. Arthritis Rheum. 2011;63:2894–2904. doi: 10.1002/art.30527. [DOI] [PubMed] [Google Scholar]
- 41.Friedrich N, Alte D, Völzke H, et al. Reference ranges of serum IGF-1 and IGFBP-3 levels in a general adult population: results of the Study of Health in Pomerania (SHIP) Growth Horm IGF Res. 2008;18:228–237. doi: 10.1016/j.ghir.2007.09.005. [DOI] [PubMed] [Google Scholar]
- 42.Katsikis PD, Chu CQ, Brennan FM, Maini RN, Feldmann M. Immunoregulatory role of interleukin 10 in rheumatoid arthritis. J Exp Med. 1994;179:1517–1527. doi: 10.1084/jem.179.5.1517. [DOI] [PMC free article] [PubMed] [Google Scholar]
- 43.O'Shea JJ, Ma A, Lipsky P. Cytokines and autoimmunity. Nat Rev Immunol. 2002;2:37–45. doi: 10.1038/nri702. [DOI] [PubMed] [Google Scholar]
- 44.Joosten LA, Lubberts E, Durez P, et al. Role of interleukin-4 and interleukin-10 in murine collagen-induced arthritis. Protective effect of interleukin-4 and interleukin-10 treatment on cartilage destruction. Arthritis Rheum. 1997;40:249–260. doi: 10.1002/art.1780400209. [DOI] [PubMed] [Google Scholar]
- 45.Heo YJ, Joo YB, Oh HJ, et al. IL-10 suppresses Th17 cells and promotes regulatory T cells in the CD4+ T cell population of rheumatoid arthritis patients. Immunol Lett. 2010;127:150–156. doi: 10.1016/j.imlet.2009.10.006. [DOI] [PubMed] [Google Scholar]
- 46.Korn T, Bettelli E, Oukka M, Kuchroo VK. IL-17 and Th17 Cells. Annu Rev Immunol. 2009;27:485–517. doi: 10.1146/annurev.immunol.021908.132710. [DOI] [PubMed] [Google Scholar]
- 47.Schenten D, Nish SA, Yu S, et al. Signaling through the adaptor molecule MyD88 in CD4+ T cells is required to overcome suppression by regulatory T cells. Immunity. 2014;40:78–90. doi: 10.1016/j.immuni.2013.10.023. [DOI] [PMC free article] [PubMed] [Google Scholar]
- 48.Croft M. The TNF family in T cell differentiation and function – unanswered questions and future directions. Semin Immunol. 2014 doi: 10.1016/j.smim.2014.02.005. doi: 10.1016/j.smim.2014.02.005 [Epub ahead of print] [DOI] [PMC free article] [PubMed] [Google Scholar]
- 49.Wakisaka S, Suzuki N, Takeno M, et al. Involvement of simultaneous multiple transcription factor expression, including cAMP responsive element binding protein and OCT-1, for synovial cell outgrowth in patients with rheumatoid arthritis. Ann Rheum Dis. 1998;57:487–494. doi: 10.1136/ard.57.8.487. [DOI] [PMC free article] [PubMed] [Google Scholar]
- 50.Kotla S, Singh NK, Heckle MR, Tigyi GJ, Rao GN. The transcription factor CREB enhances interleukin-17A production and inflammation in a mouse model of atherosclerosis. Sci Signal. 2013;6:ra83. doi: 10.1126/scisignal.2004214. [DOI] [PMC free article] [PubMed] [Google Scholar]
- 51.Hermeking H. The miR-34 family in cancer and apoptosis. Cell Death Differ. 2010;17:193–199. doi: 10.1038/cdd.2009.56. [DOI] [PubMed] [Google Scholar]
- 52.Sinner DI, Kim GJ, Henderson GC, Igal RA. StearoylCoA desaturase-5: a novel regulator of neuronal cell proliferation and differentiation. PLOS ONE. 2012;7:e39787. doi: 10.1371/journal.pone.0039787. [DOI] [PMC free article] [PubMed] [Google Scholar]