

Abstract
Tolerogenic dendritic cells (DCs) play a critical role in the induction of regulatory T cells (Tregs), which in turn suppress effector T cell responses. We have previously shown the induction of DCs from human and mouse monocytic cell lines, mouse splenocytes and human peripheral blood monocytes by a novel apolipoprotein E (ApoE)-derived self-peptide termed Ep1.B. We also showed that this C-terminal region 239–252 peptide of ApoE has strong anti-atherogenic activity and reduces neointimal hyperplasia after vascular surgery in rats and wild-type as well as ApoE-deficient mice. In this study, we explored the phenotype of DC subset induced by Ep1.B from monocytic cell lines and from the bone marrow-derived cells. We found Ep1.B treatment induced cells that showed characteristics of plasmacytoid dendritic cells (pDC). We explored in-vitro and in-vivo effects of Ep1.B-induced DCs on antigen-specific T cell responses. Upon in-vivo injection of these cells with antigen, the subsequent ex-vivo antigen-specific proliferation of lymph node cells and splenocytes from recipient mice was greatly reduced. Our results suggest that Ep1.B-induced pDCs promote the generation of Treg cells, and these cells contribute to the induction of peripheral tolerance in adaptive immunity and potentially contribute its anti-atherogenic activity.
Keywords: apolipoprotein E, atherosclerosis, immunomodulation, peptides, plasmacytoid dendritic cells
Introduction
The immune system has been implicated in the pathogenesis of atherosclerosis [1,2]. Antigen-presenting cells (APC) and T cells are among the many components of the immune system that are involved in the induction, progression and modulation of atherosclerosis [1,2]. Dendritic cells (DCs) have been particularly implicated in atherosclerosis as professional APC that activate naive T cells [3–5]. These key bone marrow-derived cells can usually be identified by a unique morphology, which includes long dendritic-like processes. They can both up- and down-regulate immune responses and have considerable immunostimulatory capacity, both in innate and adaptive immunity. The typical function of DCs is to activate and regulate the adaptive immune system and induce immune tolerance [6]. These cells take up antigens by phagocytosis and process and present them to the adaptive immune system, priming naive T cells. Therefore, DCs have a significant role in determining the type of immune response that occurs in vivo [3].
It is difficult to track the distinct origin of DC subsets or closely follow their maturation process, partly because there is not one unique surface marker that every subset of DC expresses [6]. There is a wide variety of DC subpopulations, each of which expresses different markers, has different functions and is found in different tissues in the body. Although at least five major DC subsets have been characterized in mice, it is widely accepted that there are two main functional subsets of DCs: conventional dendritic cells (cDCs) and plasmacytoid dendritic cells (pDCs) [7]. cDCs reside in the peripheral tissues, where they can take up antigens and become licensed to travel to the peripheral lymphoid organs where they present the processed antigen on their surface to T cells, thereby eliciting a potent immune response [8]. In mice, these cells usually express surface markers such as CD11c, CD4 or CD8α and CD11b. pDCs are also capable of antigen presentation; however, they primarily produce vast amounts of type 1 interferon (IFN) in the event of a viral infection [9–11]. These cells can usually be distinguished by surface expression of CD11c, B220 and Ly6C [12,13]. A murine pDC antigen (mPDCA) is also found on the surface of pDCs [14]. Dendritic cells in general can be identified by surface markers common to most subtypes. CD80 and CD86 are co-stimulatory molecules necessary for activation of naive T cells [15]. Recent studies have shown that monocytes and DCs share a common precursor that originates in the bone marrow. Each cell type stems from the macrophage-DC progenitor, which can then differentiate into a strictly DC precursor – the common-DC progenitor (CDP) – that can then give rise to both cDCs and pDCs [6].
Apolipoprotein E (ApoE) is involved primarily in lipid and cholesterol transport and metabolism, and is expressed in many different tissues. We have suggested that ApoE is a possible therapeutic and drug target for atherosclerosis [16]. We have also shown that a C-terminal ApoE-derived peptide, Ep1.B (ApoE239–252), displays anti-atherogenic activity. It reduces neointimal hyperplasia after vascular surgery in rats and mice. When given during early plaque progression in ApoE-deficient mice, Ep1.B injections also prevented plaque growth [17]. The mechanism involved in this anti-atherogenic activity has not been elucidated. We found previously that when Ep1.B peptide is incubated with mouse monocytic cell line PU5-1·8 or splenic cells it induces DC-like morphology and surface marker expression that are hallmarks of a DC phenotype [18]. Therefore, Ep1.B may be involved in the immunomodulation of atherosclerosis through the induction of DCs. A conflicting role for pDCs has been shown previously in the development and regulation of atherosclerosis [19–21].
We hypothesized that Ep1.B induces differentiation of murine monocytes and bone marrow cells into a specific subset of DCs, and that these cells produce distinct effector cytokines needed for immune regulation and T cell activation. For these studies we used 4–7-week-old non-obese diabetic (NOD) mice. These mice usually develop type 1 diabetes (T1D) after 16 weeks of age. Upon immunization with PS3 peptide, a subset of CD4+ T cells from NOD mice proliferate extensively in response to PS3 mimotope of BDC2·5 T cells [22,23]. The use of NOD mice with the PS3 autoantigenic mimotope provides a model system to elucidate the functional role of Ep1.B -induced pDC in modulating antigen-specific T cell responses. In the present study, we explored the maturation of an immature dendritic cell line DC2·4 and of bone marrow-derived cells by Ep1.B and functionally characterize these cells. We also found intraperitoneal administration of Ep1.B rapidly increased the CD11c+ DCs. We conclude that Ep1.B induces a distinct subset of DCs that exhibit characteristics similar to pDCs and are functionally tolerogenic.
Materials and methods
Reagents
The Ep1.B (TQQIRLQAEIFQAR) and PS3 mimotope (SRLGLWVRME) peptide for BDC2·5 T cells were synthesized, purified and characterized in our laboratory, as described previously [18,22,23]. The identity of the peptides was confirmed by mass spectrometry [18]. Ep1.B was dissolved in 10% glucose and the PS3 mimotope was reconstituted in saline and was passed through a 0·45 μm filter for sterilization.
Fluorescein isothiocyanate (FITC)-labelled anti-mouse CD80, CD86, Ly6C, CD11c and IFN-α were used for flow cytometry (BD Pharmingen, San Diego, CA, USA; eBioscience, San Diego, CA, USA; PBL InterferonSource, Piscataway, NJ, USA). We also used allophycocyanin-conjugated mPDCA (Miltenyi Biotec, San Diego, CA, USA), CD11c and CD25 as well as R-phycoerythrin (PE)-conjugated B220, CD11b, CD80, CD86 and forkhead box protein 3 (FoxP3). Peridinin chlorophyll protein complex (PerCP)-labelled CD11b was also used. Various fluorochrome-conjugated isotype control antibodies were used for each marker.
Cell cultures
The immature dendritic cell line DC2·4, derived from C57BL/6 mice [24], was obtained from Dr Kenneth Rock (University of Massachusetts). DC2·4 cells were cultured in 10% RPMI medium containing 100 U/ml penicillin, 100 μg/ml streptomycin (Invitrogen, Carlsbad, CA, USA), 5 × 10⁻⁵ M 2-mercaptoethanol (ME) and 10% heat-inactivated fetal bovine serum (FBS) (HyClone, Fremont, CA, USA). Ep1.B (100 μg/ml) was added to the culture at time of plating. The primary bone marrow cells harvested from the tibias and femurs of NOD mice were also cultured in 10% RPMI with 10 ng/ml granulocyte–macrophage-colony stimulating factor (GM-CSF). Ep1.B (100 μg/ml) was added to the culture on day 3 and medium was changed every 3 days, replenishing GM-CSF and 10% RPMI only.
Mice and immunizations
Wild-type female NOD mice aged between 4 and 7 weeks were bred at the University of Western Ontario (London, ON, Canada). All mice were housed under the specific pathogen-free animal facility at the University of Western Ontario and were used in accordance with institutional guidelines.
For immunizations, Ep1.B and PS3 mimotope (SRLGLWVRME) peptide for BDC2·5 T cells in NOD mice [22] were emulsified with equal volumes of incomplete Freund's adjuvant (IFA). Each mouse received either 100 μg Ep1.B, 100 μg PS3 or 100 μg Ep1.B + 100 μg PS3 either as 100 μl emulsion intraperitoneally (i.p.) or 50 μl emulsion in the footpad under anaesthesia. Spleen and popliteal lymph nodes were collected 10 days later. Ep1.B peptide was dissolved in 10% glucose in water for all these studies.
Bone marrow, lymph node, spleen and peritoneal cell preparations
Mice were euthanized humanely and their tibias and femurs extracted aseptically. Bone marrow was harvested according to Matheu et al. [25]. Cells were pooled within each group to make a cell suspension and then passed through a 40-μm nylon cell strainer. Erythrocytes were lysed using 4 ml ammonium–chloride–potassium (ACK) buffer [0·15 M NH4Cl, 1·0 mM Na2ethylenediamine tetraacetic acid (EDTA), pH 7·3] for 2 min. Cells were counted and then cultured in 10% RPMI and 10 ng/ml GM-CSF for 7 days. Ep1.B was added on day 3 and cells were harvested on day 7. Spleens and popliteal lymph nodes (LN) were extracted and also passed through a 40-μm screen. Erythrocytes were lysed using 4 ml of ACK buffer for 2 min and cells were counted and resuspended in 10% RPMI. To analyse peritoneal cells, mice were injected i.p. with 100 μg of Ep1.B in 100 μl of 10% glucose in 4-week-old NOD mice. The control mice were injected with 100 μl of 10% glucose alone. Anaesthetized mice were injected i.p. with 3 ml of prewarmed 10% RPMI medium. Mice were killed and cells were harvested, washed and stained as for CD11c expression by fluorescence activated cell sorter (FACS) analysis, as descried below.
Flow cytometry
For intracellular staining, cells were treated with 5 μg/ml brefeldin A for 4 h to block the secretion of newly synthesized cytokines. After incubation, cells were washed with phosphate-buffered saline (PBS) and then resuspended in PBS + 2% bovine serum albumin (BSA) (Roche, Stanford, CA, USA). Cells were then incubated with Fc receptor blocking antibody (anti-CD16/CD32) to prevent non-specific binding. For surface staining, cells were incubated with fluorochrome-conjugated monoclonal antibodies (mAbs) at a 1:100 or 1:50 dilution and incubated for 30 min. Cells were washed, resuspended in PBS for immediate analysis or fixed in 2% paraformaldehyde (PFA) and then washed for intracellular staining. Antibodies to intracellular proteins were added at a 1:50 dilution in 0·5% saponin and incubated for 1 h; cells were then harvested and data were acquired using a FACSCalibur (BD Biosciences, San Jose, CA, USA) at the London Regional Flow Cytometry Facility at the Robarts Research Institute (London, ON, Canada) and analysed using BD CellQuest Pro software.
Proliferation assay
Four groups of 4–6-week-old female NOD mice were immunized as above and after 10 days mice were killed and their spleens and popliteal lymph nodes were pooled and 2 × 10⁵ cells were incubated with either medium alone (10% RPMI), 5 μg/ml concanavalin A (ConA; Sigma-Aldrich, St Louis, MO, USA), 50 μg/ml Ep1.B, 50 μg/ml PS3 or 50 μg/ml Ep1.B + 50 μg/ml PS3 in a 96-well plate. Cells were incubated at 37°C for 72 h, supernatants were collected and 1 μCi/well [3H]-thymidine was added for another 18 h. The cells were then harvested (Tomtec, Hamden, CT, USA) and radioactivity was measured using a 1450 MicroBeta liquid scintillation counter (Wallac, Waltham, MA, USA).
Cytokine analysis
Culture supernatants were stored at −20°C until analysis. Each supernatant was tested for interleukin (IL)-10 and interferon (IFN)-γ by enzyme-linked immunosorbent assay (ELISA) using paired antibodies and standards (BD Biosciences). Data were acquired and analysed using a Bio-Rad Benchmark Microplate Reader and Manager (Bio-Rad Laboratories, Mississauga, ON, Canada). The amount of each cytokine was determined using a cytokine-specific standard curve.
Adoptive transfer
Bone marrow cells were extracted from NOD mice as described above and cultured in 10% RPMI and 10 ng/ml GM-CSF. On day 3, 100 μg/ml Ep1.B was added. On day 8, cells were collected from both treated and control cultures, washed and incubated with 100 μg/ml PS3 for 4 h at 37°C. Cells were washed and injected intravenously at 3 × 10⁶ cells per NOD mouse through the tail vein. After 6 days, spleens were collected, pooled and single-cell suspensions were prepared as described above. Cells were plated in a 96-well plate with 50 μg/ml of PS3 mimotope. Cells were incubated at 37°C for 72 h, supernatants were collected and 1 μCi/well [3H]-thymidine was added for another 18 h. The cells were then harvested (Tomtec) and radioactivity was measured using a 1450 MicroBeta liquid scintillation counter (Wallac).
Statistical analysis
The data were analysed using the unpaired Student's t-test with Microsoft Excel Software or Tukey's post-hoc analysis and P-values of < 0·05 were considered significant.
Results
Ep1.B induces the generation of pDCs cells in vitro
The immature dendritic cell line DC2·4 from C57BL/6 mice was tested in vitro for maturation with Ep1.B. Ep1.B peptide was always dissolved in 10% glucose for all studies. Cells were cultured with 100 μg/ml Ep1.B or medium alone for 72 h and then stained for FACS analysis. A significant increase in CD80 and CD86 surface markers was found after treatment with Ep1.B; a modest increase in CD11c was also observed (Fig. 1a). However, no difference was seen in mPDCA and dendritic cell receptor for endocytosis 205 (DEC205) markers between Ep1.B and medium alone. In analysing double-stained cells, a large increase was seen in CD11c+B220+, Ly6C+B220+ and CD11b+CD11c+cells following treatment with Ep1.B (Fig. 1b).
Figure 1.

Ep1.B induces changes in the dendritic cell surface marker expression in the dendritic cell (DC)2·4 cell line. DC2·4 cells (1 × 10⁶) were incubated with 10% RPMI medium alone or with 100 μg/ml Ep1.B for 72 h in a six-well plate. Ep1.B peptide was always dissolved in 10% glucose for all studies before adding to the medium. Following incubation cells were harvested, stained for surface markers and analysed using a fluorescence activated cell sorter (FACS); 10 000 events were collected. (a) Histograms are shown for CD80, CD86, CD11c, murine plasmacytoid DC antigen (mPDCA) and DC receptor for endocytosis 205 (DEC205). (b) DC2·4 cells were double-stained after Ep1.B treatment and analysed for the surface expression of various markers, including CD11b, CD11c, B220 and Ly6C.
To test the effect of Ep1.B on primary undifferentiated cells, pooled bone marrow cells from NOD mice were incubated with GM-CSF in a 24-well plate. After 72 h, Ep1.B was added to half the wells and on day 7 cells were stained and analysed by FACS. In response to treatment with Ep1.B, a significant increase in CD11b+Ly6C+ cells was seen compared to cells treated with GM-CSF alone (Fig. 2a). However, this is due mainly to an increase in expression of Ly6C by CD11b cells (Fig. 2a). Also, the expression of CD11c increased significantly. Importantly, a distinct increase in CD11c+mPDCA+ cells was also observed. The data were then gated on CD11b+ cells to show an increase in CD11b+Ly6C+CD80+ cells and a smaller but noticeable increase in expression of CD80 and CD86 was also observed in these cells (Fig. 2b).
Figure 2.

Treatment of non-obese diabetic (NOD) bone marrow-derived cells with Ep1.B induces up-regulation of dendritic cell (DC) surface markers. (a) Bone marrow cells (1 × 10⁶ cells/ml) from the tibias and femurs of NOD mice were pooled and plated in a 24-well plate with 10 ng/ml granulocyte–macrophage colony-stimulating factor (GM-CSF). After 72 h 100 μg/ml Ep1.B was added to half the wells. Ep1.B peptide was always dissolved in 10% glucose for all studies. The untreated other half served as control. On day 7 cells were stained with various labelled surface marker antibodies and analysed by fluorescence activated cell sorter (FACS). (b) Bone marrow cells were gated on CD11b+ cells and examined for changes in surface expression of various markers. (c) After 6 days the bone marrow cells in (a) were cultured overnight with lipopolysaccharide (LPS) (1 μg/ml). Cells were harvested on day 7 and analysed for cell surface markers specific for plasmacytoid DCs, including CD11c+, murine plasmacytoid DC antigen (mPDCA)+, B220+, Gr-1+ (Ly-6C and Ly-6G) expression. Cells were gated furthermore for CD11c+ mPDCA+ markers to determine the level of B220 and Gr-1 expressed specifically by plasmacytoid DCs. (d) CD8α expression in the CD11c+ DCs in the above bone marrow cultures was determined. This CD11c+CD8α+ subpopulation is recognized as tolerogenic DC.
Additional studies were performed to induce the generation of pDCs from bone marrow cells with Ep1.B. Bone marrow cells from NOD mice were grown in the presence of GM-CSF and Ep1.B peptide followed by maturation of DCs by lipopolysaccharide (LPS) (1 μg/ml) overnight on day 6. Cells were harvested on day 7 and analysed for cell surface markers specific for pDCs. pDCs are characterized by CD11c+, mPDCA+, B220+, Gr-1+ (Ly-6C, Ly-6G) expression. Cells were gated further on CD11c+ and mPDCA+ population to determine the level of B220 and Gr-1 expressed by pDCs (Fig. 2c).
We also determined the induction of CD8α DCs by Ep1.B peptide. As shown in Fig. 2d, the expression of CD8α DCs increased following culture of bone marrow cells from NOD mice with Ep1.B. This increased surface expression of CD8α could be an indicator of the tolerogenic DC subpopulation induced by Ep1.B and characterized by CD11c+CD8α+ expression.
These results indicate collectively that Ep1.B induced the differentiation of monocytes into pDCs.
Intraperitoneal administration of Ep1.B peptide increases the expression of CD11c+ cells in vivo
In order to characterize DC expression in vivo in response to Ep1.B, we analysed CD11c expression in the peritoneal cavity of NOD mice. CD11c is a typical mouse DC marker used commonly to identify DCs in vitro and in vivo. Five min, 2 h and 6 h after i.p. injection of Ep1.B in 10% glucose, cells were harvested and analysed for CD11c expression by flow cytometry. We found that in contrast to control, cell surface expression of CD11c increased dramatically within 5 min of the injection of Ep1.B (Fig. 3) and was still present at 2 h. By 6 h, the expression of CD11c declined to the background level.
Figure 3.

Ep1.B increases CD11c+ cells in the peritoneal cavity of non-obese diabetic (NOD) mice. Mice were injected intraperitoneally (i.p.) with 100 μg of Ep1.B in 100 μl of 10% glucose in 4-week-old NOD mice. The control mice were injected i.p. with 100 μl of 10% glucose alone. Mice were killed and cells were harvested from the peritoneal cavity after 5 min, 2 h and 6 h and analysed for CD11c expression by fluorescence activated cell sorter (FACS) analysis.
Ep1.B induces the generation of pDCs and IFN-α production from splenic cells
It is not clear if heterogeneity in DC phenotype and function exists in splenic versus monocyte-derived DCs by Ep1.B. We evaluated the generation of pDCs from the splenic cells of NOD mice by Ep1.B. As shown in Fig. 4, Ep1.B efficiently induced the differentiation and IFN-α production from the NOD splenic cells. This was evident based upon increased expression of the CD11c+B220+ subset (Fig. 4a) and larger production of IFN-α, compared to the medium control (Fig. 4b). These pDCs express low to intermediate levels of CD11c, which is consistent with their expected phenotype and IFN-α production ability.
Figure 4.
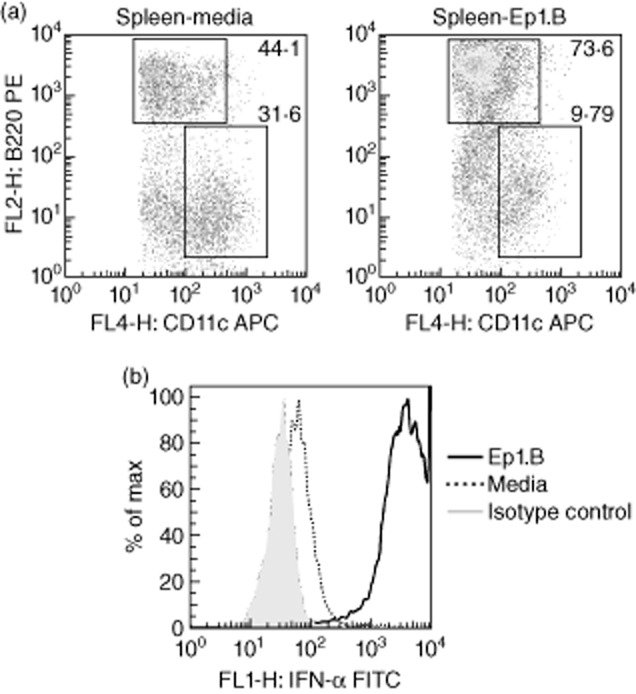
Induction of plasmacytoid dendritic cells (pDC) and interferon (IFN)-α production from splenic DCs in response to Ep1.B. (a) Splenocytes from 4-week-old non-obese diabetic (NOD) mice incubated with 100 μg/ml of Ep1.B or control medium for 72 h. Cells were sorted by flow cytometry based upon CD11c expression (horizontal axis) and relative size (vertical axis). Cells in the gated region were sorted based on CD11c (horizontal axis) and B220 (vertical axis) expression. Numbers represent the percentage of cells in the corresponding gates; (b) interferon (IFN)-α production by pDCs was measured in CD11clo B220+ cells by intracellular staining.
Adoptive transfer of bone marrow-derived Ep1.B-induced pDCs down-regulate T cell responses to PS3 mimotope in NOD mice
In order to determine the effect of Ep1.B-induced pDCs in vivo, we investigated its effect on the autoimmune T cell response to PS3 (SRLGLWVRME) mimotope of BDC2·5 T cells in NOD mice [22,23,26]. Bone marrow cells from NOD mice were collected and incubated with GM-CSF. After 72 h, half the wells were incubated with Ep1.B and the other half acted as control. On day 8, all wells were pulsed with 100 μg/ml PS3 mimotope for 4 h. Cells were washed and 3 × 10⁶ cells were injected intravenously (i.v.) into groups of 4-week-old NOD mice. After 6 days, spleens were collected, pooled within each group and plated with recall peptides in a proliferation assay. Splenocytes from mice that received medium alone showed significantly higher proliferation when recalled with PS3 mimotope than those from mice that received Ep1.B-treated cells (Fig. 5; Student's t-test, P = 0·0005). No differences were seen between spleen cells from mice receiving medium alone or Ep1.B-treated cells when recalled with Ep1.B. Thus, splenocytes of recipient mice injected with Ep1.B-treated cells demonstrate much lower proliferation in response to the challenge amtigen than control mice injected with untreated cells. As shown below, this is due probably to the induction of regulatory T cells (Treg) cells by Ep1.B-induced DCs.
Figure 5.
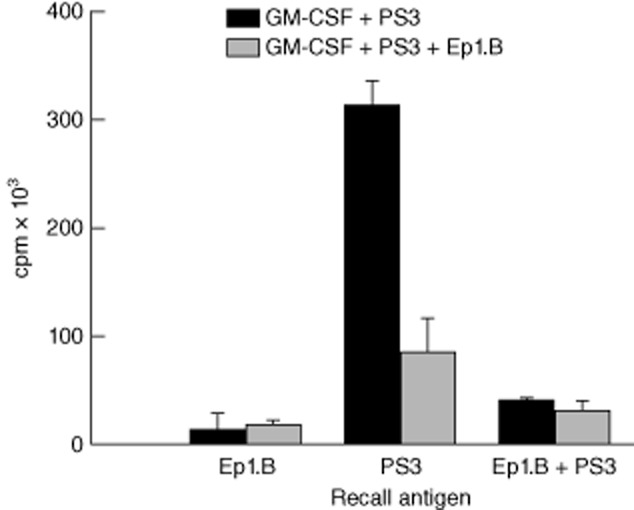
Adoptive transfer of Ep1.B treated bone marrow-derived dendritic cells (DCs) suppresses proliferation of non-obese diabetic (NOD) splenic T cells in response to the challenge antigen. Bone marrow cells from tibias and femurs from NOD mice were extracted and plated in a 24-well plate with 10 ng/ml granulocyte–macrophage colony-stimulating factor (GM-CSF). After 72 h the medium was changed and 50 μg/ml Ep1.B was added to half the wells. After another 72 h both treatment and control groups were pulsed with PS3 peptide and 3 × 10⁶ cells were injected intravenously into 4-week-old NOD mice. For these studies PS3 mimotope of BDC2·5 T cells from NOD mice was used as the antigen [18]. After another 6 days spleens were collected then pooled within each group and plated in a 96-well plate for 72 h with 50 μg/ml Ep1.B, 50 μg/ml PS3 or 50 μg/ml Ep1.B + 50 μg/ml PS3 challenging peptides. [3H]-Thymidine was added for 18 h and proliferation was measured using a MicroBeta counter. Results are shown as mean of triplicate wells ± standard deviation.
DCs induced in vivo by Ep1.B immunization down-regulate T cell response to PS3 mimotope by the induction of CD4+FoxP3+CD25+ Treg cells
We determined the effect of Ep1.B-induced pDCs on the proliferation of autoreactive lymphoid cells after immunization with the autoantigenic mimotope peptide PS3 in NOD mice [22,26]. Four groups of 6-week-old female NOD mice were injected in footpads with either IFA alone, 50 μg Ep1.B/IFA, 50 μg PS3/IFA or 50 μg Ep1.B + 50 μg PS3/IFA. Ep1.B peptide was always dissolved in 10% glucose for all studies. After 10 days, popliteal lymph nodes were extracted and pooled within each group. They were left untreated or challenged in vitro with 5 μg/ml ConA, 50 μg/ml Ep1.B, 50 μg/ml PS3 and 50 μg/ml Ep1.B + 50 μg/ml PS3 (Fig. 6a). After 72 h, supernatants were collected and cells from each treatment were stained for FACS. [3H]-Thymidine was then added for 18 h to the remaining cultures and cells were harvested and proliferation measured using a MicroBeta counter. Cells incubated with medium alone showed background levels of proliferation (negative control) and demonstrated a proliferative capacity in response to the polyspecific mitogen ConA (positive control) in lymph nodes (Fig. 6a). Ep1.B was non-immunogenic, as no proliferation resulted from restimulation [18]. Interestingly, lymph node cells from mice injected with PS3 + Ep1.B demonstrated significantly lowered proliferation in response to both PS3 and Ep1.B + PS3 as recall peptides compared to mice injected with PS3 alone (Fig. 6a; Tukey's post-hoc test, P < 0·0001, F = 142·8 and P = 0·0057, F = 9·199, respectively). This suggests that Ep1.B down-regulated proliferation of antigen-specific lymph node T cells.
Figure 6.
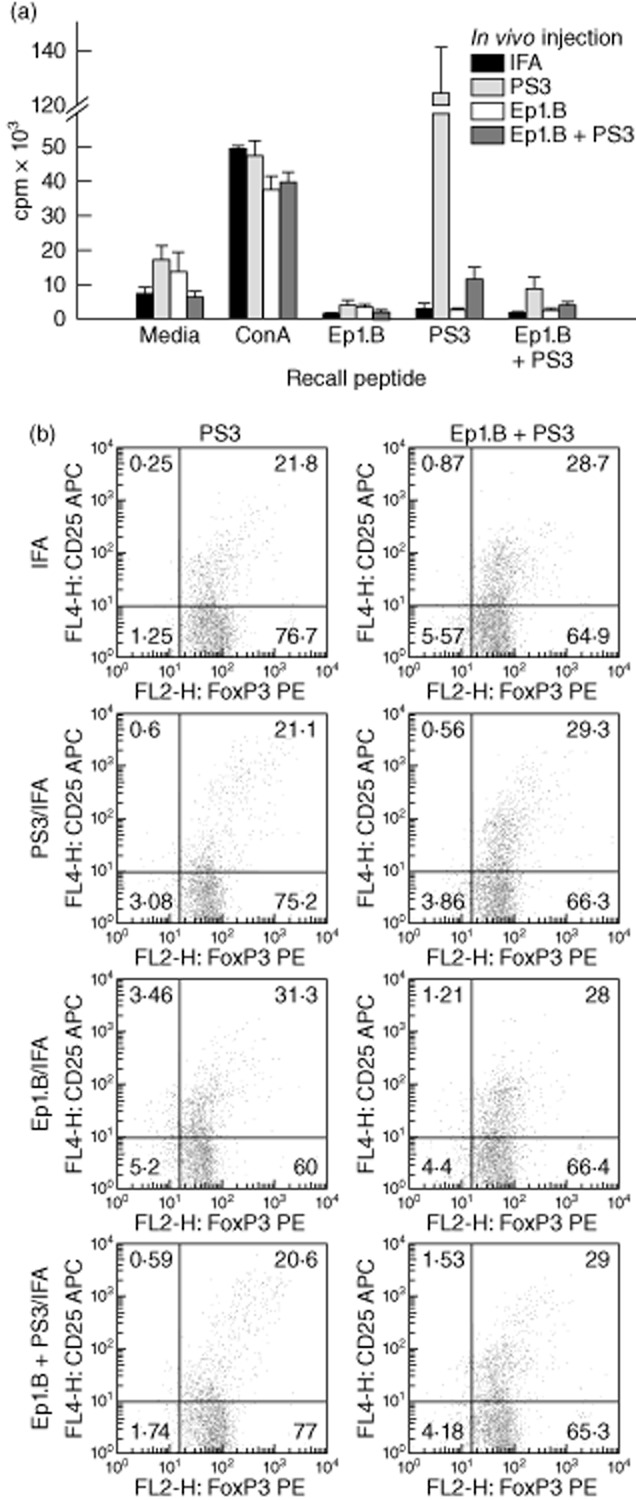
Injection with Ep1.B suppresses proliferation in response to the recall antigen in popliteal lymph nodes of non-obese diabetic (NOD) mice by induction of CD4+forkhead box protein 3 (FoxP3)+CD25+ regulatory T cells (Treg) cells. Six-week-old NOD mice were given a footpad injection of incomplete Freund's adjuvant (IFA) alone, 50 μg/ml PS3, 50 μg/ml Ep1.B or a mixture of 50 μg/ml Ep1.B with 50 μg/ml PS3 emulsified in IFA. Three mice in each group were injected and euthanized humanely after 10 days. Popliteal lymph nodes of each mouse were extracted and pooled within each group. (a) For proliferation assay, 2 × 10⁵ of pooled lymph node cells were incubated in vitro in a 96-well plate with medium alone, 5 μg/ml concanavalin A (Con A), 50 μg/ml Ep1.B, 50 μg/ml PS3 or 50 μg/ml Ep1.B + 50 μg/ml PS3 peptides for 72 h. [3H]-Thymidine was added for 18 h and proliferation was measured using a MicroBeta counter. Results shown are a mean of triplicate wells ± standard deviation. (b) Cells from immunized mice were analysed for the expression of surface and intracellular markers. The first column represents cells cultured with 50 μg/ml PS3 peptide and the second column shows cells cultured with 50 μg/ml Ep1B + 50 μg/ml PS3 peptides. The frequency of CD25+FoxP3+ cells was obtained by first gating on the CD4+ population.
To identify the cells involved in the inhibition of proliferative response we stained for T cells for the expression of surface markers and intracellular FoxP3 in cell cultures. The frequency of CD25+FoxP3+ cells was obtained by first gating on the CD4+ population. A clear increase in CD4+FoxP3+CD25+ Treg cells was seen after recall with Ep1.B + PS3 in all groups except Ep1.B/IFA (Fig. 6b). These Treg cells are probably responsible for the down-regulation of the T cell responses.
Supernatants from the above ex-vivo cultures were tested for the production of cytokines by the antigen-specific T cells using ELISA. Lymph node cell cultures from mice injected with PS3 and challenged with PS3 demonstrated a dramatic increase in IFN-γ production compared to cells from mice injected with PS3 + Ep1.B and challenged with PS3 (Fig. 7a; Student's t-test, P < 0·0001). Supernatants of cell cultures from mice injected with PS3 + Ep1.B but challenged with PS3 also showed IFN-γ production, whereas this cytokine was not detected in cell cultures from mice injected with PS3 + Ep1.B and recalled with PS3 + Ep1.B. This further indicates a decrease in T cell proliferation, as IFN-γ is produced mainly by T cells, and injection or even challenge with Ep1.B suppresses this T cell response. IL-10 was detected in lymph nodes from each group of immunized mice (Fig. 7b). These results suggest that injection or incubation with Ep1.B increases the total IL-10 concentration. We also found that lymph node cells from the Ep1.B-injected mice demonstrated an increase in IFN-α production upon in-vitro recall with Ep1.B (Fig. 7c).
Figure 7.
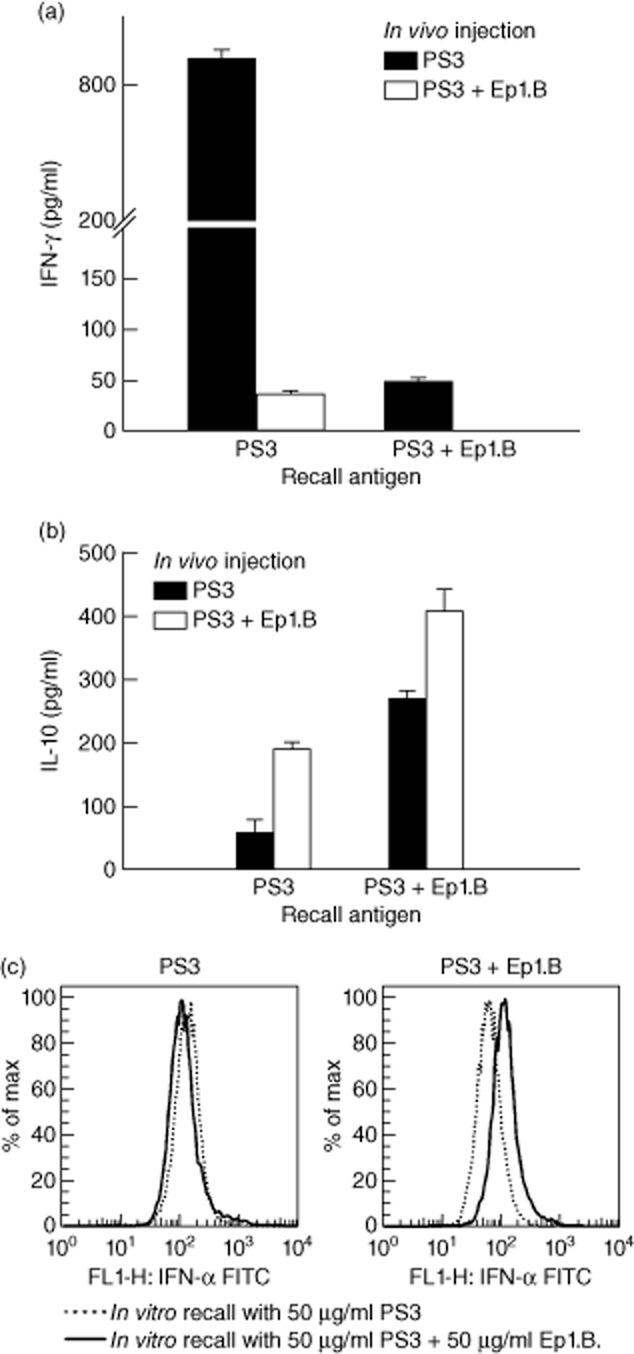
Injection with Ep1.B and PS3 antigen in incomplete Freund's adjuvant (IFA) induces changes in cytokine production in response to the recall antigen in popliteal lymph nodes of non-obese diabetic (NOD) mice. Supernatants after 72 h incubation with challenging antigens were analysed for (a) interferon (IFN)-γ and (b) interleukin (IL)-10 using enzyme-linked immunosorbent assay (ELISA). Results shown are the mean ± standard deviation of triplicate wells in a 96-well plate and concentration was measured in pg/ml. (c) Lymph node cells from the in-vitro proliferation cultures were also collected and stained for IFN-α by intracellular staining.
Discussion
The purpose of this study was to determine the cellular mechanism of the maturation of DCs by anti-atherogenic Apo E-derived self-peptide Ep1.B. We have shown previously that Ep1.B activates the PI3K and mitgogen-activated protein kinase (MAPK) pathways and induces the differentiation of monocytic PU5-1·8 cells in vitro [18]. We also showed that Ep1.B down-regulates T cell proliferation in response to the model antigen chicken ovalbumin [18].
In this study, we analysed changes in the DC population using surface markers and by measuring the functional effects these changes have on T cell proliferation in response to PS3, an autoantigenic mimotope of diabetogenic NOD derived BDC2·5 T cells. In-vitro incubation of the immature dendritic cell line DC2·4 with Ep1.B showed a marked increase in the expression of CD80 and CD86 co-stimulatory molecules and a moderate increase in CD11c DC cell surface markers. This confirmed the effect of Ep1.B on the maturation of monocytes obtained previously with PU5-1·8 monocytic cells [18]. In response to Ep1.B, the Ly6C+B220+ population was increased drastically among DC2·4 cells; this suggests an increase in pDCs, as Ly6C is a classic pDC surface marker and such double-positive cells are particularly characterized as pDCs [27]. No differences were seen in DEC205 in response to Ep1.B, although DC2·4 cells already express DEC205 at relatively high levels [24]. Similar results were obtained for mPDCA, which suggests that this cell line expresses these markers endogenously at high level.
We found that bone marrow cells, when incubated with GM-CSF and stimulated with Ep1.B for 72 h, showed an increase in pDC marker Ly6C among CD11b+ cells. In addition, a distinct increase was seen in CD11c expression, especially when co-expressed with mPDCA or DEC-205 in Ep1.B-treated cells. mPDCA is mainly specific to pDCs, while DEC-205 can be expressed by different types of leucocytes, but is expressed at high levels by some populations of DCs [28]. Cells when gated on CD11b+ showed that Ep1.B induces an increase in Ly6C+CD80+ and Ly6C+CD86+ cells. Fogg et al. [29] also found an increase in CD11bintCD11c+ DCs upon in-vitro stimulation of murine bone marrow cells with GM-CSF, and we suggest that Ep1.B allows these cells to mature rapidly into pDCs.
Ep1.B on its own did not stimulate T cells, but was able to down-regulate proliferation of T cells to challenge antigens in immunized mice [18]. It is therefore not surprising that Ep1.B administration alone is not enough to prevent the development or progression of T1D in NOD mice (our unpublished results). Our results indicate that a combination of antigenic peptide and Ep1.B in adjuvant might be a rational approach for induction of antigen-specific tolerance in immunotherapy protocol. In fact, addition of Ep1.B during immunization sensitizes lymphocytes to be hyporesponsive to a specific antigen. As a remarkable example, NOD mice immunized with PS3 mimotope demonstrated considerable proliferation upon recall with PS3 alone. However, mice that were injected with PS3 + Ep1.B had a much lower recall response to PS3, suggesting that Ep1.B down-regulated effector and/or pathogenic T cells in NOD mice. We analysed for cytokine production to exclude the possibility that the treatment conditions were toxic to the cells and also to determine any differences in expression profile of cytokines in the lymph nodes. We found that lymph node cells from mice immunized with antigen and Ep1.B in IFA and challenged in vitro with antigen showed increased production of IL-10 compared to the control [18]. This was not due to a non-specific toxic effect of Ep1.B on T cells, but to the modulation of DC function by Ep1.B [18]. Immunization and recall with PS3 showed a much larger production of IFN-γ than either injection with Ep1.B + PS3 and recalled with PS3 alone. This is further evidence that Ep1.B down-regulates T cell proliferation, as IFN-γ is secreted mainly from T cells. The possible role of pDCs in the down-regulation of atherosclerosis by reducing T cell proliferation has been reported recently [19]. Kang et al. [30] found that, upon adoptive transfer of isolated pDCs from tolerized mice, an increased suppressive capacity of CD4+CD25+ Tregs was observed in vivo, illustrating the ability of pDCs to provoke changes in Treg cell population. This is consistent with other studies, where transfer of pDCs from lymph nodes of tumour-bearing mice activated Tregs in vivo [31]. A recent study also found that vitamin D3-induced tolerogenic DCs expanded CD25+FoxP3+ Tregs from NOD mice [32].
We also stained draining lymph node cells for intracellular IFN-α and FoxP3 expression and examined for changes in surface markers to further test whether IFN-α-secreting pDCs were up-regulated and to determine any changes in Treg expression. We found a slight increase in IFN-α in lymph node cells upon injection with Ep1.B. IFN-α is mainly secreted from plasmacytoid dendritic cells, and therefore Ep1.B induces an up-regulation of these cells. We also observed an increase in Ly6C+CD11b+ cells and in each group after recall with Ep1.B + PS3 compared to PS3 alone. This again shows an increase in pDCs. Every group demonstrated an increase in CD4+FoxP3+CD25+ cells after in-vitro challenge with Ep1.B + PS3, except for the group injected with Ep1.B/IFA. This could be due to cellular changes already accounted for by injection of Ep1.B alone, such that little response is seen after challenge with Ep1.B. These surface markers characterize Tregs in mice and therefore in-vitro incubation with Ep1.B induces an increase in pDCs which will then up-regulate immunosuppressive Tregs. Bjorck et al. [27] show that a subpopulation of pDCs found in the bone marrow produces high amounts of IFN-α. However, when they leave and migrate to peripheral tissues they secrete far less, which may be consistent with our results where only a slight increase in IFN-α was observed. Bjorck et al. [27] also noted that a subpopulation of pDCs could induce Treg cells, which supports our findings.
In this study, we have demonstrated that incubation with Ep1.B elicits changes in bone marrow-derived cells and these cells express surface proteins similar to those found on pDCs, including CD11c, mPDCA, DEC-205, CD80 and CD86. This self-peptide also altered cytokine production such that more IL-10 and IFN-α were secreted in vitro [18]. Ep1.B can induce changes in immature dendritic cells, monocytes and primary bone marrow cells; however, it induces the greatest changes in the latter. Based on our observations in this study, we suggest that in-vivo Ep1.B rapidly induces pDCs that prevent the development of pathogenic cells that contribute to atherosclerosis [19,20]. This is particularly the case for the anti-atherogenic activity of Ep1.B during vascular surgery [17]. Our future studies will focus upon the potential application of in-vitro-generated pDCs by Ep1.B to confirm its mechanism of action in blocking atherosclerosis.
Acknowledgments
Work in our laboratories was supported by grants from the Canadian Institutes of Health Research (CIHR) and Natural Sciences and Engineering Research Council of Canada (NSERC).
Disclosure
The authors have no competing financial interests to declare.
References
- 1.Hansson GK, Hermansson A. The immune system in atherosclerosis. Nat Immunol. 2011;12:204–212. doi: 10.1038/ni.2001. [DOI] [PubMed] [Google Scholar]
- 2.Libby P, Ridker PM, Hansson GK. Progress and challenges in translating the biology of atherosclerosis. Nature. 2011;473:317–325. doi: 10.1038/nature10146. [DOI] [PubMed] [Google Scholar]
- 3.Banchereau J, Steinman RM. Dendritic cells and the control of immunity. Nature. 1998;392:245–252. doi: 10.1038/32588. [DOI] [PubMed] [Google Scholar]
- 4.Galkina E, Ley K. Immune and inflammatory mechanisms of atherosclerosis. Annu Rev Immunol. 2009;27:165–197. doi: 10.1146/annurev.immunol.021908.132620. [DOI] [PMC free article] [PubMed] [Google Scholar]
- 5.Niessner A, Weyand CM. Dendritic cells in atherosclerotic disease. Clin Immunol. 2010;134:25–32. doi: 10.1016/j.clim.2009.05.006. [DOI] [PMC free article] [PubMed] [Google Scholar]
- 6.Liu K, Nussenzweig MC. Origin and development of dendritic cells. Immunol Rev. 2010;234:45–54. doi: 10.1111/j.0105-2896.2009.00879.x. [DOI] [PubMed] [Google Scholar]
- 7.Guilliams M, Henri S, Tamoutounour S, et al. From skin dendritic cells to a simplified classification of human and mouse dendritic cell subsets. Eur J Immunol. 2010;40:2089–2094. doi: 10.1002/eji.201040498. [DOI] [PubMed] [Google Scholar]
- 8.Banchereau J, Briere F, Caux C, et al. Immunobiology of dendritic cells. Annu Rev Immunol. 2000;18:767–811. doi: 10.1146/annurev.immunol.18.1.767. [DOI] [PubMed] [Google Scholar]
- 9.Colonna M, Trinchieri G, Liu YJ. Plasmacytoid dendritic cells in immunity. Nat Immunol. 2004;5:1219–1226. doi: 10.1038/ni1141. [DOI] [PubMed] [Google Scholar]
- 10.Matta BM, Castellaneta A, Thomson AW. Tolerogenic plasmacytoid DC. Eur J Immunol. 2010;40:2667–2676. doi: 10.1002/eji.201040839. [DOI] [PMC free article] [PubMed] [Google Scholar]
- 11.Haeryfar SM. The importance of being a pDC in antiviral immunity: the IFN mission versus Ag presentation? Trends Immunol. 2005;26:311–317. doi: 10.1016/j.it.2005.04.002. [DOI] [PubMed] [Google Scholar]
- 12.Björck P. Isolation and characterization of plasmacytoid dendritic cells from Flt3 ligand and granulocyte–macrophage colony-stimulating factor-treated mice. Blood. 2001;98:3520–3526. doi: 10.1182/blood.v98.13.3520. [DOI] [PubMed] [Google Scholar]
- 13.Nakano H, Yanagita M, Gunn MD. CD11c, B220, Gr-1 cells in mouse lymph nodes and spleen display characteristics of plasmacytoid dendritic cells. J Exp Med. 2001;194:1171–1178. doi: 10.1084/jem.194.8.1171. [DOI] [PMC free article] [PubMed] [Google Scholar]
- 14.Blasius AL, Giurisato E, Cella M, Schreiber RD, Shaw AS, Colonna M. Bone marrow stromal cell antigen 2 is a specific marker of type I IFN-producing cells in the naive mouse, but a promiscuous cell surface antigen following IFN stimulation. J Immunol. 2006;177:3260–3265. doi: 10.4049/jimmunol.177.5.3260. [DOI] [PubMed] [Google Scholar]
- 15.Van Gool SW, Vandenberghe P, De Boer M, Ceuppens JL. CD80, CD86 and CD40 provide accessory signals in a multiple-step T-Cell activation model. Immunol Rev. 1996;153:47–83. doi: 10.1111/j.1600-065x.1996.tb00920.x. [DOI] [PubMed] [Google Scholar]
- 16.Bocksch L, Stephens T, Lucas A, Singh B. Apolipoprotein E: possible therapeutic target for atherosclerosis. Curr Drug Targets Cardiovasc Haematol Disord. 2001;1:93–106. doi: 10.2174/1568006013337944. [DOI] [PubMed] [Google Scholar]
- 17.Bocksch L, Rider BJ, Stephens T, et al. C-terminal apolipoprotein E-derived peptide, Ep1.B, displays anti-atherogenic activity. Atherosclerosis. 2007;194:116–124. doi: 10.1016/j.atherosclerosis.2006.10.014. [DOI] [PubMed] [Google Scholar]
- 18.Stephens TA, Nikoopour E, Rider BJ, et al. Dendritic cell differentiation induced by a self- peptide derived from apolipoprotein E. J Immunol. 2008;181:6859–6871. doi: 10.4049/jimmunol.181.10.6859. [DOI] [PubMed] [Google Scholar]
- 19.Daissormont IT, Christ A, Temmerman L, et al. Plasmacytoid dendritic cells protect against atherosclerosis by tuning T-cell proliferation and activity. Circ Res. 2011;109:1387–1395. doi: 10.1161/CIRCRESAHA.111.256529. [DOI] [PMC free article] [PubMed] [Google Scholar]
- 20.Döring Y, Zernecke A. Plasmacytoid dendritic cells in atherosclerosis. Front Physiol. 2012;3:230. doi: 10.3389/fphys.2012.00230. doi: 10.3389/fphys.2012.00230. eCollection 2012. [DOI] [PMC free article] [PubMed] [Google Scholar]
- 21.Subramanian M, Tabas I. Dendritic cells in atherosclerosis. Semin Immunopathol. 2014;36:93–102. doi: 10.1007/s00281-013-0400-x. [DOI] [PMC free article] [PubMed] [Google Scholar]
- 22.Nikoopour E, Sandrock C, Huszarik K, et al. Cutting edge: vasostatin-1-derived peptide ChgA29–42 is an antigenic epitope of diabetogenic BDC2·5 T cells in nonobese diabetic mice. J Immunol. 2011;186:3831–3835. doi: 10.4049/jimmunol.1003617. [DOI] [PubMed] [Google Scholar]
- 23.Nikoopour E, Cheung R, Bellemore S, et al. Vasostatin-1 antigenic epitope mapping for induction of cellular and humoral immune responses to chromogranin A autoantigen in NOD mice. Eur J Immunol. 2014;44:1170–1180. doi: 10.1002/eji.201343986. [DOI] [PubMed] [Google Scholar]
- 24.Shen Z, Reznikoff G, Dranoff G, Rock KL. Cloned dendritic cells can present exogenous antigens on both MHC class I and class II molecules. J Immunol. 1997;158:2723–2730. [PubMed] [Google Scholar]
- 25.Matheu MP, Sen D, Cahalan MD, Parker I. Generation of bone marrow derived murine dendritic cells for use in 2-photon imaging. J Vis Exp. 2008;17:773–776. doi: 10.3791/773. [DOI] [PMC free article] [PubMed] [Google Scholar]
- 26.Stadinski BD, Delong T, Reisdorph N, et al. Chromogranin A is an autoantigen in type 1 diabetes. Nat Immunol. 2010;11:225–231. doi: 10.1038/ni.1844. [DOI] [PMC free article] [PubMed] [Google Scholar]
- 27.Björck P, Leong HX, Engleman EG. Plasmacytoid dendritic cell dichotomy: identification of IFN-α producing cells as a phenotypically and functionally distinct subset. J Immunol. 2011;186:1477–1485. doi: 10.4049/jimmunol.1000454. [DOI] [PMC free article] [PubMed] [Google Scholar]
- 28.Steinman RM, Idoyaga J. Features of the dendritic cell lineage. Immunol Rev. 2010;234:5–17. doi: 10.1111/j.0105-2896.2009.00888.x. [DOI] [PubMed] [Google Scholar]
- 29.Fogg DK, Sibon C, Miled C, et al. A clonogenic bone marrow progenitor specific for macrophages and dendritic cells. Science. 2006;311:83–87. doi: 10.1126/science.1117729. [DOI] [PubMed] [Google Scholar]
- 30.Kang HK, Liu M, Datta SK. Low-dose peptide tolerance therapy of lupus generates plasmacytoid dendritic cells that cause expansion of autoantigen-specific regulatory T cells and contraction of inflammatory Th17 cells. J Immunol. 2007;178:7849–7858. doi: 10.4049/jimmunol.178.12.7849. [DOI] [PubMed] [Google Scholar]
- 31.Sharma MD, Baban B, Chandler P, et al. Plasmacytoid dendritic cells from mouse tumor-draining lymph nodes directly activate mature Tregs via indoleamine 2,3-dioxygenase. J Clin Invest. 2007;117:2570–2582. doi: 10.1172/JCI31911. [DOI] [PMC free article] [PubMed] [Google Scholar]
- 32.Ferreira GB, Gysemans CA, Demengeot J, et al. 1,25-dihydroxyvitamin D3 promotes tolerogenic dendritic cells with functional migratory properties in NOD mice. J Immunol. 2014;192:4210–4220. doi: 10.4049/jimmunol.1302350. [DOI] [PubMed] [Google Scholar]