Abstract
The spatial and temporal control of transgene expression is an important tool in C. elegans biology. We previously described a method for evoking gene expression in arbitrary cells by using a focused pulsed infrared laser to induce a heat shock response (Churgin et al 2013). Here we describe detailed methods for building and testing a system for performing single-cell heat shock. Steps include setting up the laser and associated components, coupling the laser beam to a microscope, and testing heat shock protocols. All steps can be carried out using readily available off-the-shelf components.
Keywords: C. elegans, transgenes, heat shock, lasers
1. Introduction
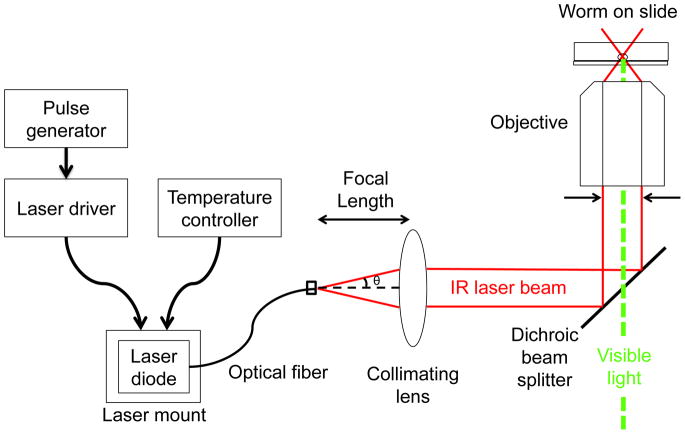
The goal of this protocol is to modify a microscope so that an external infrared laser is coupled through the microscope objective for the purpose of inducing heat shock in single cells of embryonic, larval, or adult C. elegans. The basic design of the system is shown in Fig. 1. A fiber-coupled infrared diode laser is operated in a pulsed laser mode using a laser driver and pulse generator. The laser beam exits the fiber, is collimated by a lens, and enters through the rear of the objective lens of a microscope after reflecting from a dichroic filter. The objective focuses the laser beam to a sub-micron-sized focused spot at the sample plane. Some of the laser light is absorbed by water or other molecules in the targeted cell, causing the local temperature to rise. The use of a pulsed laser allows targeting with higher spatial resolution than possible with continuous-wave illumination, as described previously [1].
Fig. 1.
Experimental Setup. An infrared laser controlled by a laser driver and pulse generator is directed into the back aperture of a microscope objective and induces local heating in C. elegans.
First, we discuss the laser, microscope, and components and procedures necessary to align the two with respect to one another. Next, we describe calibration of the laser beam and steps for optimizing the laser heating protocol for specific cell types. Optional modifications, such as objective or sample cooling, can also be made to optimize spatial resolution.
Before beginning work with any lasers, ensure that users have completed all appropriate laser safety training and that any relevant safety equipment including protective eyewear and/or laser curtains has been obtained. Invisible infrared laser radiation poses a particular hazard. Infrared viewing cards (e.g. Thorlabs VRC2) can be used to visualize laser beam position and size. Use of an optical power meter (e.g. Coherent LaserMate) is recommended to measure laser power propagating at different locations in the optical setup.
2. Construction of the apparatus
2.1 Selection and modification of the microscope
The primary considerations when selecting a microscope for single-cell heat shock are (1) compatibility with imaging methods for targeting the appropriate cell(s), and (2) access to the back aperture of the microscope objective. The laser beam will enter from outside the microscope itself and the collimated beam will be directed into the back aperture of the objective via a dichroic mirror. We used a Nikon TE2000 inverted microscope in which the sample stage and objective turret was raised by 60 mm using a Nikon T-BSUK stage height adjustment kit. The dichroic mirror was positioned at a 45° angle under the microscope objective using Thorlabs posts and positioners. Alternatively, the dichroic can be mounted within a fluorescence filter cube and placed within a filter cube turret (either a previously existing one or another mounted above or below the first).
To couple a laser into Leica microscopes including the DMI and DM series, custom filter cubes are available (W. Nuhsbaum Inc., McHenry IL) for coupling lasers into the objective from a direction 90 degrees from the fluorescence illumination pathway. For other types of microscopes, consult manufacturer representatives to discuss strategies for laser coupling. The considerations discussed here are nearly identical to those which appear when designing a system for laser surgery [2] or optical trapping [3]. Optical configurations for coupling to older finite tube length microscopes are also available [4].
Regardless of strategy for coupling the laser into the microscope, ensure that the dichroic is mounted in a stable manner and that the reflective side of the dichroic is facing the objective. The microscope should be safely secured to an optical table or breadboard before attempting to align the laser. This can be done by surrounding the feet of the microscope by optical bases (e.g. Thorlabs BA series) and mounting them to the breadboard.
It is important that the laser fiber mount, lens, dichroic mirror, and microscope are fixed in position with respect to one another. Shifting of the optical components, even by a very small amount, will require time-consuming realignment.
2.2 Laser selection and setup
Infrared light generates heat in biological tissue primarily through absorption by water in the tissue. Therefore, to maximize the temperature increase attainable for a given laser power the wavelength of the infrared laser should be chosen to be efficiently absorbed by water. We used a laser with 1465 nm wavelength, at which the absorption coefficient of water [5] is approximately α=31.6 cm−1. That is, radiation at this wavelength will be attenuated by factor of 1/e upon propagation through water over the absorption length 1/α = 316 μm. (By comparison, the absorption length of water is 0.44 m at λ=800 nm and 3.75 m at λ =600 nm.)
We used a Fitel FOL1425RUZ-317 fiber-coupled diode laser module with 1465 nm wavelength, maximum drive current 1750 mA, and maximum power 400 mW. This laser diode module, which was designed as a pump laser for fiber amplifiers, was purchased from Lightwavestore (Ottawa, Ontario, Canada) with an FC/PC fiber optic connector and a short length of SMF-28 optical fiber (Corning) attached via fusion splice to the fiber end. Great care must be taken to avoid contact of any object with the fiber end, which is easily fouled or damaged. The fiber end can be cleaned with ethanol and lens tissue. The laser module contains an integrated thermoelectric cooler (TEC) and thermometer for temperature control. We installed the laser module into a 14-pin butterfly laser diode mount (Thorlabs LM14S2) according to the manufacturer’s instructions (Fig. 2).
Fig. 2.
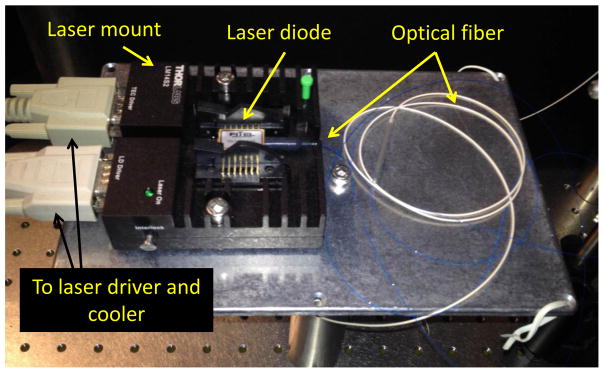
Laser setup. A fiber-coupled infrared diode laser with 1465 nm wavelength and integrated thermoelectric cooler.
The laser diode mount contains two connectors, one for a laser diode driver and one for a temperature controller. We connected the diode mount to a laser diode driver (Opto Power OPC-PS03-A) and connected the temperature controller mount to a temperature controller (Thorlabs TEC2000), both via cables with DB9 connectors on both ends. Nearly any other laser diode driver and/or thermoelectric controller capable of supplying sufficient currents would also suffice. The laser diode temperature should be set according to manufacturer recommendations. The laser power can be adjusted by controlling the output current. If an optical power meter is available, calibrate the power vs. current curve and compare with the specifications. To maximize lifespan of the laser diode, use only the minimum current necessary to achieve optical trapping and/or the desired level of heating.
To control the pulse repetition rate (frequency) and pulse duration of the laser, we used a pulse generator (Stanford Research Systems DG535). We set the trigger frequency to be the pulse frequency, “A delay” to be 0 ms, “B delay” to be the pulse duration, and then used the “AB” output configured to produce 5V high outputs to control the laser diode driver through the external input BNC connector. Pulse outputs can be monitored on an oscilloscope (optional). For applications where larger heated regions (>3μm) are acceptable the laser can be driven continuously (continuous wave, CW) in which case the pulse generator is not required. In addition, use the laser in CW mode during alignment procedures.
2.3 Coupling the laser beam to the microscope
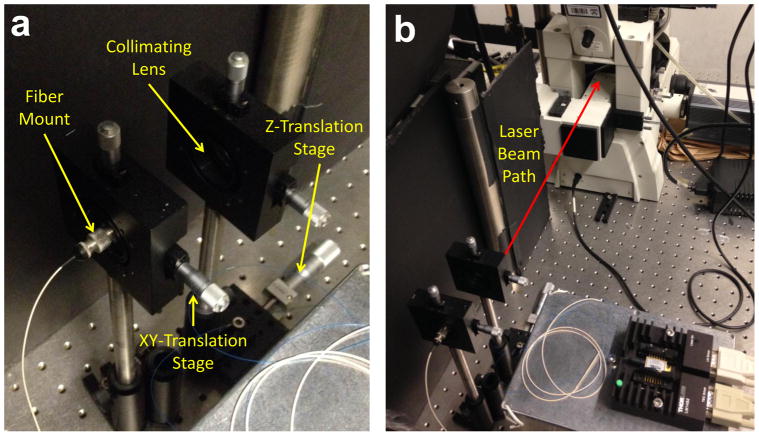
We attached the FC connector at the fiber end to a Thorlabs SM1FC adapter which was mounted on an X-Y translatable stage to aid beam alignment (Thorlabs ST1XY-S). All optical components should be mounted on optical posts, post holders, and bases (e.g. Thorlabs TR4, PH4, BA2) secured to an optical table or optical breadboard (e.g. Thorlabs).(Fig. 3).
Fig. 3.
a. Fiber-to-free space launch setup including translation stages for fine adjustments. b. Beam path showing back of microscope.
Turn the laser on with low power and use an infrared reader card to visualize the beam by placing the card near (but not touching) the fiber tip. You should see the beam profile on the card. As you move the IR card away from the fiber tip the beam profile should expand because the beam diverges upon exiting the fiber.
If the microscope is an infinity-corrected system, the laser beam needs to be nearly collimated (neither diverging nor converging) when it enters the microscope objective in order to produce a focus coincident with the image plane. Therefore, a collimating lens should be inserted between the output of the fiber-coupled laser and the dichroic mirror. The focal length of the required lens is given by , where r is the radius of the objective’s back aperture and θ is the beam divergence angle. The beam divergence angle is specified by the numerical aperture of the optical fiber NA = sin θ, equal to 0.13 for SMF-28 fiber; this corresponds to the angle from the optical axis at which the beam’s power is 5% of the maximum. We used a plano-convex lens with f = 75 mm (Thorlabs). The back aperture of the objective was 1 cm wide.
The collimating lens should be mounted on a linear translation stage (e.g. Thorlabs) oriented in the Z direction so that fine adjustments can be made to the beam collimation. Secure the linear translation stage to the table/breadboard so that the collimating lens is approximately one focal length away from the fiber tip. Align the lens and the fiber tip to be at the same height. Turn the laser on at low power and visualize the beam with the IR card at various distances. The beam should not diverge after passing through the collimating lens. Adjust the Z-translation stage so that the beam diameter remains constant as the IR card moves away or toward the lens. (Fig. 3).
Before entering the microscope, the laser beam can be routed to the appropriate position using one or more mirrors (e.g. Thorlabs BB1-E04) mounted on mirror mounts (e.g. Thorlabs KM100). The use of such mirrors provides easily manipulated degrees of freedom which can aid in alignment of the beam with respect to the microscope.
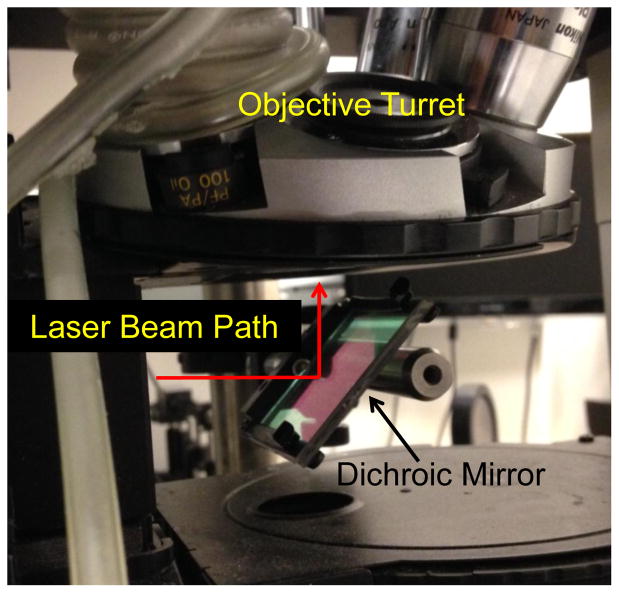
The dichroic mirror which couples the laser beam into the objective needs to efficiently reflect the infrared laser wavelength while passing visible wavelengths to allow for simultaneous laser heating and imaging of the sample by brightfield, DIC, or fluorescence microscopy. We used a shortpass dichroic mirror (Thorlabs DMSP1000R) positioned under the microscope objective and oriented at a 45 degree angle with respect to the incoming beam (Fig. 4).
Fig. 4.
Dichroic mirror positioned under raised objective lens reflects IR laser into objective and transmits visible light.
Optimal focus of the infrared beam requires a high numerical aperture objective (NA>1). We used an oil-immersion Nikon CFI 100X Plan Fluor (NA 1.3) objective.
For initial alignment of the laser into the microscope, remove the objective and use an IR viewing card to position the laser beam at the center of the objective mount. Adjust the beam position and direction using adjustment knobs on the optomechanical components between the laser and objective.
Next, switch to a low magnification objective (e.g. 5–10X). Attach the IR card to the front of the objective using tape. Adjust the X-Y translators on the fiber mount and collimating lens to maximize the amount of IR light transmitted through the objective. Periodically move the IR card away from the objective to ensure the light is not exiting the objective at an angle relative to the objective axis. If light is not exiting perpendicularly from the objective axis, ensure that (i) The dichroic mirror is oriented at 45° and (ii) The fiber mount and/or collimating lens are directed along the axis toward the dichroic mirror. If either requirement is not met it may be difficult to achieve optical trapping and thus visualize the laser beam focus. Repeat this alignment procedure with the higher magnification, high NA objective until the light transmitted is maximized through the desired objective.
2.4 Location of the laser focus
Precise location of the focused laser beam is critical for aligning the laser and for accurate targeting of single cells. Since infrared radiation at 1.45 μm is invisible both to the human eye and to nearly all imaging sensors, another method of visualizing the focused beam is needed. We used optical trapping to locate the position of the infrared laser focus and thus test how well the laser is coupled into the objective. Briefly, optical trapping is a method whereby a tightly focused laser beam generates forces that can trap small objects located at the focus of the laser [3]. A weakly focused laser beam cannot generate sufficient forces for optical trapping, so the ability to trap small objects, such as 1 μm diameter polystyrene beads, is a good metric to judge the quality of laser coupling.
To create a suspension of polystyrene beads for visualization of optical trapping, dilute a 2.5% solution of 1 μm beads (Polysciences 07310-15) by a factor of 10 in water. 1 mL of this stock solution should last for at least one month when kept at 4°C. Mount the bead suspension on the microscope on a slide outfitted with a coverslip using plastic shim stock (McMaster-Carr 9513K57) or glass coverslips as spacers. When the laser is off the beads will undergo rapid random Brownian motion due to thermal fluctuations. When the laser is turned on (in continuous-wave mode) and properly aligned, beads away from the focus should begin moving more rapidly due to heat-driven convection, while a single bead near the laser focus will become trapped and nearly stationary at the laser focus (Fig. 5).
Fig. 5.
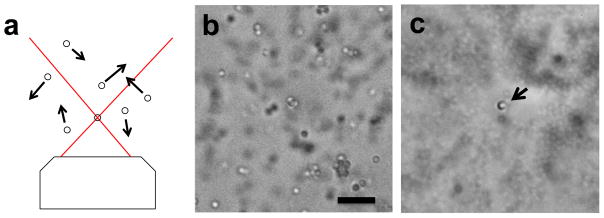
Visualizing the laser focus using optical trapping. a) Optical trapping of one bead. Untrapped beads undergo random Brownian movement. b) Bright field image of 1 μm diameter polystyrene beads. Scale Bar: 5 μm c) Long exposure image of the same beads with the infrared laser enabled. A single bead is trapped at the laser focus (arrow). Untrapped beads are blurred due to a long exposure time.
Starting with the laser at zero current, slowly increase the current until you can see the polystyrene beads moving faster due to the laser-induced temperature increase. Slowly move the sample stage. Most beads will move along with the stage. Look for a bead that remains fixed in the field of view as the sample stage moves. This bead is trapped at the laser focus. If you cannot find a trapped bead, adjust the collimating lens Z-translation stage by 5–10 microns and repeat. If the laser beam is not sufficiently collimated, either (i) the beam focused by the objective may not be tight enough to trap the beads or (ii) the beam may be focused at a plane away from the objective’s focal plane.
Monitor the laser current and/or power required to achieve optical trapping. This gives an indirect measure of laser transmission through the objective: if the beam is poorly aligned with the objective back aperture, some fraction will be lost and a greater total power will be required for trapping.
Adjust the laser beam lateral position to bring the focus near the center of the field of view. If the trapped bead does not appear to be in focus, the collimation of the laser beam can be adjusted to bring it into the focal plane. Note that adjusting the microscope focus knob cannot be used to focus on the trapped bead, since the optical trap location moves with the objective.
Once optical trapping is observed, capture an image on the camera attached to the microscope. Record the pixel location of the trapped bead to represent the location of the laser focus. This can be done by marking a position via the camera software, or by using a fine permanent marker to mark the bead’s position on the computer screen displaying the image. For the latter, do not move or resize the image window. The mark can be removed using ethanol.
2.5 Optional sample cooling
Cooling the sample by 5–10° C improves the spatial selectivity of the heat shock induction [1]. Commercial sample cooling devices are available from several vendors including Physitemp, Microptik, and Instec. We used a simple method in which cool water was circulated through flexible plastic laboratory tubing (Tygon, 1/4″ diameter) wrapped around the objective lens (Fig. 4), which is thermally coupled to the sample via the immersion oil. Cool water was provided by a digital temperature-controlled water circulator (Brookfield).
3. Calibration and testing of laser heat shock
3.1 Calibrating the laser-induced temperature increase
In order to choose the appropriate laser power for a given application it is important to determine the relationship between laser current and/or power and the induced temperature change. The decrease in GFP fluorescence with temperature can be used to measure the laser-induced temperature shift [6]. GFP-expressing E. coli (available from the Caenorhabditis Genetics Center) can be used to generate a uniform layer of GFP for quantification of fluorescence changes.
Smear a clump of GFP-expressing E. coli with a platinum wire pick onto an agarose pad. Let the pad air dry for 10–15 minutes. When the coverslip is placed on the pad, it should stick firmly and not slide around. Place the microscope slide containing the pad and E. coli on the microscope and locate a region of relatively uniform bacterial density using a GFP filter. Capture a fluorescence image with the laser off. Turn the laser on and record a second image, being sure not to move the field of view or change any image acquisition parameters. Using an image analysis program (we use MATLAB) quantify the fluorescence in a small region of interest (~1 μm × 1 μm) at the laser focus by summing up the intensity values in the ROI. Divide the measured quantity attained during the laser-on image by that attained during the laser-off image, and the resulting ratio will be a measure of the decrease in fluorescence intensity. The fluorescence relative to baseline should approximately obey the relationship f=−0.0079T + 1.18, where T is the temperature in degrees Celsius [1]. This equation can be used to convert relative fluorescence decrease into temperature shift. This calculation can be repeated for multiple laser powers to generate a curve for peak temperature vs. laser power and/or current.
It is also possible to measure temperature changes during pulsed laser illumination. This requires a blue LED (for GFP illumination) to be pulsed at different phases with respect to the pulsed infrared illumination. This can be done by configuring the pulse generator to generate two pulse trains, with the first pulse train governing the infrared illumination and the second pulse train governing the blue LED illumination via the LED drive electronics. Shifting the delay of blue LED illumination relative to pulsed infrared heating enables measurements of temperature while the laser is in the on or off state.
3.2 Performing laser heat shock in larval or adult C. elegans
To assess heat shock in single cells, we used the strain ST66 (hsp-16.2::GFP [6]). Immobilize up to 10 worms on a 1 mm-thick 10% agarose pad and 0.05–0.1μm diameter polystyrene beads [7]. Do not allow worms to remain immobilized on the pad for longer than necessary; about an hour should be the limit. During experiments, all slides should contain control (mock-treated) worms.
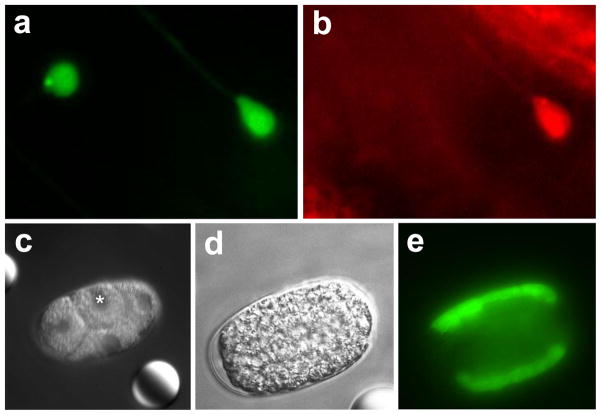
Mount the slide on the microscope. For each worm, center the target at the laser focus and turn the laser on for the duration required. During experiments, the pulsed laser was turned on or off by enabling and disabling the laser driver. We used laser heat shock times in the range of 1–5 minutes for larvae and adult worms. We recommend initially using a peak laser temperature of about 40° C. The laser power required to achieve this temperature will depend on the specific objective used as well as the strength of laser coupling into the objective. In our system the instantaneous laser power ranged between 220 and 260 mW, as measured while propagating in free space just before the dichroic beamsplitter. We recommend using a laser pulse rate of 100 Hz and pulse duration of 1 ms. After laser heat shock, recover the worms to seeded NGM plates. Check gene induction after 3 hours or as needed. We find GFP fluoresence is usually visible within 3 hours and is maximum between 8 and 12 hours after heat shock (Fig. 6a–b). Note any reduced viability in experiment and control animals.
Fig. 6.
Single-cell gene induction using pulsed laser heat shock. a) Mechanosensory neurons ALM and AVM expressing GFP. Scale bar: 10 μm b) Heat shock induction of RFP in ALM only (same field of view as panel a). c) f) DIC image of a 4-cell stage embryo before heat shock to ABp (asterisk). d) Same embryo 2–3 h later. e) GFP induced in the daughters of ABp.
3.3 Laser heat shock of C. elegans embryos
Mount embryos according to the protocol described by Bao and Murray [8]. Mount embryos slightly younger than the stage at which you would like to heat shock. All slides should contain control (mock-treated) embryos. For each embryo, center the target at the laser focus and turn the laser on for the duration required. We used a similar laser peak temperature and pulse condition in embryos as for larvae and adult heat shock, with the difference that heat shock times ranged from 10–20 seconds instead of 1–5 minutes. We noticed that heating for longer durations, even at very low laser power, resulted in a high probability of embryonic arrest. Onset of gene induction will depend on the stage at which embryos are heated. Check for gene induction after 1 hour, if possible (Fig. 6c–e). Note any embryonic arrests or reduced viability in experiment and control animals.
3.4 Optimization of laser heat shock protocols
Several parameters can be varied to optimize heat shock response in the targeted cells: (i) laser power, (ii) pulse duration, (iii) frequency of laser pulses, and (iii) total duration of pulsed laser illumination. Modulating these parameters provides some flexibility in the characteristics of heat shock experienced by the targeted cell.
Increasing laser power will increase the peak temperature at the laser focus. Decreasing the pulse duration will yield finer spatial resolution of heat shock as more time is introduced between pulses for thermal energy to dissipate. Increasing the laser frequency will raise the baseline temperature but enable the use of shorter pulse durations.
If laser heat shock yields no observable gene induction, we recommend first increasing the laser power in 10% increments. If gene expression is not confined to the desired region we recommend then taking steps to limit the spatial extent of heating, such as decreasing the pulse duration or employing sample cooling. Once these steps are taken it may be necessary to then increase the laser power and/or heat shock duration, as shorter pulses or sample cooling will reduce the peak temperature at the laser focus. Through iteration one can achieve a range of peak temperatures with a range of spatial resolutions. For larvae or adult worms we recommend starting with heat shock durations in the range of 3–5 minutes. For embryos we recommend starting with heat shock durations in the range of 10–20 seconds.
4. Summary
We have presented a protocol for adapting a microscope for pulsed laser heat shock, and for using it to induce transgene expression in single C. elegans cells. We have tested these methods for turning on GFP expression in several cell types including neurons, seam cells, and intestinal cells [1]. However, we expect that researchers will adapt the methods for expressing arbitrary constructs within arbitrary cell(s) of interest. We also anticipate that our method will be readily extensible to other model systems including Drosophila, zebrafish, and cultured cells.
Highlights.
We describe methods for construction of a system for single-cell transgene induction in C. elegans
We use a pulsed infrared diode laser to heat a single cell
The system is built from only off-the-shelf components
Acknowledgments
Some strains were provided by the Caenorhabditis Genetics Center, which is funded by NIH Office of Research Infrastructure Programs (P40 OD010440). C. F.-Y. was supported by NIH, Ellison Medical Foundation, and the Alfred P. Sloan Research Foundation. J.I.M. was supported by the NIH (GM083145), by the Penn Genome Frontiers Institute, and by a grant from the Pennsylvania Department of Health, which disclaims responsibility for any analyses, interpretations, or conclusions.
Footnotes
Publisher's Disclaimer: This is a PDF file of an unedited manuscript that has been accepted for publication. As a service to our customers we are providing this early version of the manuscript. The manuscript will undergo copyediting, typesetting, and review of the resulting proof before it is published in its final citable form. Please note that during the production process errors may be discovered which could affect the content, and all legal disclaimers that apply to the journal pertain.
References
- 1.Churgin MA, Hee L, Murray JI, Fang-Yen C. Efficient single-cell transgene induction in Caenorhabditis elegans using a pulsed infrared laser. G3 Bethesda Md. 2013;3:1827–1832. doi: 10.1534/g3.113.007682. [DOI] [PMC free article] [PubMed] [Google Scholar]
- 2.Fang-Yen C, Gabel CV, Samuel ADT, Bargmann CI, Avery L. Laser microsurgery in Caenorhabditis elegans. 2. Elsevier Inc; 2012. [DOI] [PMC free article] [PubMed] [Google Scholar]
- 3.Neuman KC, Block SM. Optical trapping. Rev Sci Instrum. 2004;75:2787–2809. doi: 10.1063/1.1785844. [DOI] [PMC free article] [PubMed] [Google Scholar]
- 4.Bargmann CI, Avery L. C elegans: Modern Biological Analysis of an Organism. Academic Press; 1995. Laser killing of cells in Caenorhabditis elegans; pp. 225–250. [DOI] [PMC free article] [PubMed] [Google Scholar]
- 5.Kou L, Labrie D, Chylek P. Refractive indices of water and ice in the 0.65- to 2.5-μm spectral range. Appl Opt. 1993;32:3531–3540. doi: 10.1364/AO.32.003531. [DOI] [PubMed] [Google Scholar]
- 6.Kamei Y, Suzuki M, Watanabe K, Fujimori K, Kawasaki T, et al. Infrared laser–mediated gene induction in targeted single cells in vivo Supplementary Material. Nat Methods. 2008;6:79–81. doi: 10.1038/nmeth.1278. [DOI] [PubMed] [Google Scholar]
- 7.Kim E, Sun L, Gabel CV, Fang-Yen C. Long-Term Imaging of Caenorhabditis elegans Using Nanoparticle-Mediated Immobilization. PLoS ONE. 2013;8:e53419. doi: 10.1371/journal.pone.0053419. [DOI] [PMC free article] [PubMed] [Google Scholar]
- 8.Bao Z, Murray JI. Mounting Caenorhabditis elegans embryos for live imaging of embryogenesis. Cold Spring Harb Protoc 2011. 2011 doi: 10.1101/pdb.prot065599. [DOI] [PubMed] [Google Scholar]


