

Abstract
Objective(s):
Organic anion transporter polypeptide 1B1 (OATP1B1) encoded by solute carrier organic transporter 1B1 (SLCO1B1) gene; a transporter involved in the uptake of drugs and endogenous compounds is present in hepatocyte sinusoidal membrane. Aim of this study was to investigate the frequencies of functionally significant SNPs (388A>G and 521T>C) and their haplotypes in 6 ethnic groups of Pakistani population through the development of rapid and efficient Tetra amplification refractory mutation system (T. ARMS) genotyping assay.
Materials and Methods:
Frequencies of alleles, genotype, and haplotypes of two functionally significant Single nucleotide polymorphism in 180 healthy Pakistani subjects and distributions in six ethnic groups by using a single step T. ARMS genotyping assay.
Results:
The allelic frequency for 388A>G SNP was 50% in total Pakistani population with Single nucleotide polymorphism distributions of 9.7%, 15.1%, 19.4%, 16.1%, 18.3%, and 21.5% in Punjabi, Sindhi, Balouchi, Pathan, Kashmiri and Hazara/Baltistan groups respectively; and for 521T>C SNP it was 23.9% in total Pakistani population with distributions of 11.1%, 8.9%, 15.6%, 11.1%, 31.1% and 22.2% in Punjabi, Sindhi, Balouchi, Pathan, Kashmiri, and Hazara/Baltistan groups. Both functionally significant SNPs occurred in four major haplotypes with a frequency of 35.5% for 388A/521T (*1A), 40.5% for 388G/521T (*1B), 14.4% for 388A/521C (*5), and 9.4% for 388G/521C (*15) with varying distributions among six ethnic groups.
Conclusion:
The 388A>G and 521T>C genotypes and corresponding haplotypes are present at varying frequencies in various ethnic groups of Pakistani population. Pharmacokinetic and pharmacodynamic profiling is needed to assess and characterize the effects of these haplotypes in our population.
Keywords: Haplotype, OATP1B1, Single nucleotide polymorphism, SLCO1B1
Introduction
The movement of drugs within a biological system is facilitated by its transport through the transmembrane passages which are not only dependent upon the physicochemical properties of the drug but also on a variety of efflux and uptake membrane transporters (1). Organic anion transporting polypeptide 1B1 (OATP1B1) is an important member of the solute carrier (SLC) super family (2). Their significant importance is as an uptake transporter expressed on the sinusoidal membrane of hepatocytes and their pivotal role in the hepatic uptake of endogenous compounds and several important drugs such as statins, rifampicin, methotrexate, benzyl penicillin, and fexofenadine etc. (3, 4). These act as sodium independent uptake transporters and function through electro-neutral exchange and coupling of neutralizing anions with organic compounds which result in their cellular uptake (3). Several sequence variations have been discovered in the Solute carrier organic transporter 1B1 (SLCO1B1) gene (5) out of which two Single nucleotide polymorphism (SNPs), namely; 388A>G and 521 T>C have been discussed in many studies as they had proved to be the most prevalent and functionally important for the proper transport function of OATP1B1 transporter (3, 6–13). The 521T>C and 388A>G SNPs cause an amino acid change at positions 174 (from valine to alanine) and position 130 (from asparginine to aspartic acid) respectively. Both SNPs 521T>C and 388A>G have been reported to exist in perfect linkage disequilibrium (LD) (14). Various studies have reported altered plasma concentration and inter-individual variability in therapeutic responses of statins such as simvastatin (10), pitavastatin (9, 11), atorvastatin (13, 15), and cerivastatin (16) and linked them to the two functionally important SNPs (388A>G and 521T>C) and their respective haplotypes.
Statins therapeutic actions and most importantly, adverse effects which include myopathy and rhabdomyolysis have shown great inter-individual and ethnic variations (17, 18). These inter-individual and ethnic variations in the therapeutic response and severity of adverse effects are largely attributed to the genetic variations therefore predisposing to altered drug disposition (16, 19, 20). Identification and characterization of underlying genetic variations will help us towards better dosing regimens and safer drug designs for personalized therapy.
The importance of SLCO1B1 SNPs on statins pharmacokinetics and pharmacodynamics points towards the necessity for a rapid and efficient genotyping assay. Moreover, there is currently no data available for the presence and subsequent characterization of SNPs and their haplotypes in the ethnic groups of Pakistani population which is crucial for evaluating the significance of SLCO1B1 SNPs as a determining factor for inter-individual and ethnic variability for statins’ pharmacokinetics and pharmacodynamics in our population. This study is therefore an attempt to develop a rapid, efficient, and single step Tetra amplification refractory mutation system (T. ARMS) genotyping assay thus aiding to investigate the frequencies of two functionally important SLCO1B1 SNPs (388A>G and 521T>C) and their respective haplotypes in six ethnic groups of the Pakistani population.
Materials and Methods
Subjects
This descriptive study was designed with a total population size (N) of 180 normal healthy subjects subdivided into a smaller sample size (n) of 30 into 6 ethnic groups (Punjabi, Sindhi, Balouchi, Pathan, Kashmiri, and Hazara/Baltistan). The study sought its approval from Ethics Committee of Centre for Research in Experimental & Applied Medicine (CREAM), Army Medical College, National University of Sciences and Technology (NUST), Pakistan. All subjects were enrolled after asserting their health condition from previous medical history and physical examination. Participation in the study was at their free will and only after explaining the study purpose, procedure, and protocol. Undertaking on consent proforma was followed by a 10 ml blood sample collection from each participant in ethylenediamin-etetraacetic acid (EDTA) tube and storage at -20°C.
DNA extraction
Genomic DNA was extracted using standard/conventional kit method (QIAamp DNA kit, Qiagen, Hilden, Germany) according to the protocol provided (21) and analyzed on 1% agarose gel followed by its storage at 4 °C.
T. ARMSgenotyping assay
Two SNP variations of OATP1B1 –encoding gene SLCO1B1 388A>G rs2306283 and 521T>C rs4149056 were investigated. The reference sequences were obtained from National Center for Biotechnology Information (NCBI; Bethesda, MD, USA) database (http://www.ncbi.nlm.nih.gov/). Genotyping of the DNA samples was performed by using one step T. ARMS polymerase chain reaction (PCR) assay with some modifications on Applied Biosystems, Inc., 96 well thermal cycler (ABI Veriti, Foster City, CA 94404, USA). Primer templates were obtained by using the online software tool specifically designed for T. ARMS primer and accessible on the Cedar Genetics website http://cedar.genetics.soton.ac.uk/public_html/prime r1.html (22) (Table 1). The cocktail for PCR amplification is presented in Table 2.
Table 1.
T. ARMS PCR primer templates
| Region | Primer sequence SLCO1B1 388A>G | Primer sequence SLCO1B1 521T>C | |
|---|---|---|---|
| Forward | Outer Inner |
5´-AATTGACAGAAAGTACTCTGGTAATTTG-3´ 5´-TTACAGGTATTCTAAAGAAACTAATAGCG-3´ |
5´-CACCATATTGTCAAAGTTTGCAAAGTGA-3´ 5´-ATCTGGGTCATACATGTGGATATAGGT-3´ |
| Reverse | Outer Inner |
5´-ATTTTGCTAATGAATATCACAACAATTT-3´ 5´-GTCGATGTTGAATTTTCTGATGACTT-3´ |
5´-TTCAAAAGTAGACAAAGGGAAAGTGATCA-3´ 5´-ATTCCACGAAGCATATTACCCATGACCG-3´ |
Table 2.
Cocktail for PCR amplification
| Constituents | SLCO1B1 388A>G | SLCO1B1 521T>C |
|---|---|---|
| Template | 50 ng | 50 ng |
| 10X PCR buffer | 1X | 1X |
| MgCl2 (25 mM) | 3 mM | 5 mM |
| dNTP’s | 0.2 mM | 0.2 mM |
| Outer F primer (10 pmol/μl) | 1 pmol | 1 pmol |
| Specific F Primer (10 pmol/μl) | 1 pmol | 1 pmol |
| Outer R primer (10 pmol/μl) | 1 pmol | 1 pmol |
| Specific R primer (10 pmol/μl) | 1 pmol | 1 pmol |
| Taq DNA Polymerase (2 U/μl) | 10 U | 10 U |
| dH2O (nuclease free) | Upto 50 μl | Upto 50 μl |
| Total reaction mixture (μl) | 50 | 50 |
PCR cycling conditions
PCR thermo cycler was preheated to 95°C (hot start) and incubated for 5 min at this temperature (long denaturation). This was followed by 40 cycles of 1 min at 95°C (template denaturation), 1 min at 60°C (primer annealing), and 1 min at 72°C (primer extension). PCR protocol was finalized by the last long extension at 72°C for 10 min. The protocol for both 388A>G and 521T>C SNPs were the same except for the annealing temperature of 55°C for 521T>C during the 40 cycles.
The amplified PCR product was analyzed by using agarose gel (2% w/v) electrophoresis. 5 μl ethidium bromide (10 mg/ml) and 0.25% bromophenol blue solutions were used and samples were loaded into the wells. Electrophoresis was performed at 100 volts for 30 min followed by amplified product’s detection on ENDUROTM GDS (Labnet International, Inc., NJ 08837, USA) Gel Documentation System.
Statistical analysis
Computational and Molecular Population Genetics Lab (CMPG) software, Arlequin version 3.5.1.2 http://cmpg.unibe.ch/software/arlequin3 (Swiss Institute of Bioinformatics, University of Geneva, Switzerland), was used for population genetic data analysis (23). The allelic and genotypic frequencies of both SNPs were checked for their consistency with the Hardy-Weinberg equilibrium. The distribution of these genotypic frequencies in relation to ethnic groups within the Hardy-Weinberg equilibrium was assessed using Pearson’s chi-squared test and graphically analyzed by using triangular ternary plot through “de Finetti” diagram for both the SNPs. Linkage Disequilibrium (LD) for the pair of SNPs was quantified by r2 and respective D’ values (24) using Arlequin.
Genetic diversity between ethnic groups was calculated by Analysis of Molecular Variance (AMOVA) followed by pairwise differentiation with FST. Mann-Whitney U test was applied for the non-parametric analysis and comparison of haplotypic frequencies (% age) within different ethnic groups using SPSS software version 20.0 (SPSS Inc., Chiacgo, IL, USA); graphical representation is by Microsoft Excel 2013 with add-on statistical package (Redmond, Washington, USA). All genotype and haplotype frequencies are presented with 95% confidence intervals.
Results
Genotyping
The events produced as a result of T-ARMS PCR for both the 388A>G and 521T>C lead to the complete genotype profiling of the enrolled subjects in a one-step PCR (Figure 1 and Figure 2 respectively).
Figure 1.

Results of Agarose gel electrophoresis for OATP1B1 N130D (388A>G)
Lanes 1 and 2 indicate AA genotype comprising 346 bp Tetra ARMS control and 188 bp AA fragment. Lane 3 indicates GG genotype comprising 346 bp Tetra ARMS control and 212 bp GG fragment. Lane 4 indicates AG genotype comprising 346 bp Tetra ARMS control, 188bp A fragment and 212 bp G fragment
Figure 2.

Results of agarose gel electrophoresis for OATP1B1 V174A (521T>C)
Lane 1 indicates TT genotype comprising 359bp Tetra ARMS control and 223 bp TT fragment. Lanes 2 and 3 indicate TC genotype comprising 359 bp Tetra ARMS control, 223 bp T fragment, and 190 bp C fragment. Lane 4 indicates CC genotype comprising 359 bp Tetra ARMS control and 190 bp CC fragment
Alleles and genotypes
The observed allelic frequencies of 388A>G and 521T>C in the total Pakistani population (N=180) were 50% and 23.9% respectively. All six genotypes of both SNPs exhibited a frequency of greater than 10%. The three genotypes of 388A>G SNP, AA, AG, and GG occurred at a frequency of 50%, 28.33%, and 21.66% respectively in the total Pakistani population. Moreover, the genotypes of 521T>C SNP, TT, TC, and CC occurred at a frequency of 76.11%, 10%, and 13.88% respectively in the total Pakistani population. The detected frequencies did not exhibit a significant deviation from the Hardy-Weinberg equilibrium. The allelic and genotypic frequencies were also analyzed among different ethnic groups of the Pakistani population and are summarized in Table 3. Alleles of both SNPs were present in linkage disequilibrium across the six ethnic groups with r2 values ranging from 0.019 to 0.934. Genetic diversity using analysis of molecular variance (AMOVA) followed by pairwise group comparisons using Fst and average differences Pxy are presented in Table 4. All p values returned by Fst pairwise testing were greater than 0.05 and therefore an insignificant difference among ethnic groups in the population was inferred.
Table 3.
388A>G and 521T>C allele and genotype frequencies in six ethnic groups of Pakistani population
| Ethnicity Genetic | Punjabi (n=30) | Sindhi (n=30) | Balouchi (n=30) | Pathan (n=30) | Kashmir (n=30) | Haz/Balt (n=30) | |
|---|---|---|---|---|---|---|---|
| Total population size (N) 180 | |||||||
| 388 | G Allele | 9.7 % | 15.1 % | 19.4 % | 16.1 % | 18.3 % | 21.5 % |
| 388 A>G Genotype | AA (Control) | 24.1 % | 18.4 % | 13.8 % | 17.2 % | 14.9 % | 11.5 % |
| AG (Heterozygous) | 11.1 % | 16.7 % | 20.4 % | 16.7 % | 16.7 % | 18.5 % | |
| GG (Homozygous) | 7.7 % | 12.8 % | 17.9 % | 15.4 % | 20.5 % | 25.6 % | |
| 521 | C Allele | 11.1 % | 8.9 % | 15.6 % | 11.1 % | 31.1 % | 22.2 % |
| 521 T>C Genotype | TT (Control) | 18.5 % | 19.3 % | 17 % | 18.5 % | 11.9 % | 14.8 % |
| TC (Heterozygous) | 15 % | 5 % | 20 % | 15 % | 30 % | 15 % | |
| CC (Homozygous) | 8 % | 12 % | 12 % | 8 % | 32 % | 28 % | |
Table 4.
Pairwise group comparison of genotype frequencies among the ethnic groups of Pakistani population
| AMOVA | Punjabi | Sindhi | Balouchi | Pathan | Kashmir | Hazara/Baltistan | |
|---|---|---|---|---|---|---|---|
| Punjabi | 0.854 | 0.509 | 0.709 | 0.181 | 0.109 | Pairwise group average differences (Pxy) P-values | |
| Sindhi | 0.846 | 0.981 | 1.000 | 0.427 | 0.381 | ||
| Balouchi | 0.504 | 0.972 | 1.000 | 0.545 | 0.609 | ||
| Pathan | 0.702 | 0.990 | 0.990 | 0.445 | 0.436 | ||
| Kashmir | 0.180 | 0.468 | 0.558 | 0.441 | 0.900 | ||
| Hazara/Baltistan | 0.108 | 0.378 | 0.630 | 0.432 | 0.891 | ||
| Pairwise group comparisons (FST) p values | |||||||
Haplotypes
Four haplotypes from the two SNPs were analyzed. The reference control haplotype having both normal alleles AT (*1A) exhibited a frequency of 35.5% while the highest frequency of 40.5% was presented by the GT (*1B) haplotype. However, the AC (*5) and GC (*15) haplotypes occurred at lower frequencies of 14.4% and 9.4% respectively. The haplotype frequencies were also analyzed among different ethnic groups of the Pakistani population and are summarized in Table 5. Pairwise variations in haplotypes within the ethnic groups were assessed using the Mann-Whitney U test and returned P-values for significant differences in frequencies as summarized in Table 6.
Table 5.
Haplotype frequencies in six ethnic groups of Pakistani population
| Genetic | Ethnicity Genetic | Punjabi (n=30) | Sindhi (n=30) | Balouchi (n=30) | Pathan (n=30) | Kashmir (n=30) | Haz/Balt (n=30) |
|---|---|---|---|---|---|---|---|
| Total population size (N) 180 | |||||||
| Haplotypes | AT [*1A] | 29.2 % | 20 % | 13.8 % | 20 % | 9.2 % | 7.7 % |
| GT [*1B] | 8.2 % | 17.8 % | 20.5 % | 16.4 % | 16.4 % | 20.5 % | |
| AC [*5] | 8 % | 12 % | 12 % | 12 % | 28 % | 28 % | |
| GC [*15] | 17.6 % | 5.9 % | 17.6 % | 11.8 % | 29.4 % | 17.6 % | |
Table 6.
Pairwise group comparison of haplotypes among ethnic groups of Pakistani population
| Mann Whitney U test | Punjabi | Sindhi | Balouchi | Pathan | Kashmir | Hazara/Baltistan | |
|---|---|---|---|---|---|---|---|
| Punjabi | 1.080 | 2.064 | 1.183 | 2.067 | 3.058 | Haplotype group variations (z values) | |
| Sindhi | 0.280 | 1.156 | 0.161 | 2.554 | 2.477 | ||
| Balouchi | 0.039* | 0.248 | 0.958 | 1.507 | 1.342 | ||
| Pathan | 0.237 | 0.872 | 0.338 | 2.301 | 2.210 | ||
| Kashmir | 0.002* | 0.011* | 0.132 | 0.021* | 0.345 | ||
| Hazara/Baltistan | 0.002* | 0.013* | 0.180 | 0.027* | 0.730 | ||
| Haplotype group comparisons (P-values) | |||||||
* P<0.05 (Confidence interval 95%)
Discussion
Two functionally important and widely studied polymorphic variants of SLCO1B1, 388A>G and 521T>C, were investigated in this study. The 521T>C variant has been reported to alter the function of transporter polypeptide (OATP) leading to impaired entry of drug into the hepatocytes followed by increased drug plasma levels and therefore rendering its therapeutic effects and enhancing its toxicity. It was demonstrated in a recent study (19) that the 388A>G variant was responsible for expression of OATP in the hepatocytes. These vitally important variations in the OAT polypeptide led us to selection of these two target SNPs for further investigation in our population. The allelic frequencies of both the SNPs and their genotypes/haplotypes were therefore observed in 6 ethnic groups, namely; Punjabi, Sindhi, Pathan, Balouchi, Kashmiri, and Hazara/Baltistan to find out the extent of genetic variations within these groups and the whole population.
The 388G allele when investigated within the groups showed its highest frequency of 60 % in the Balouchi and Hazara/Baltistan groups with a lowest of 30 % in the Punjabi group. The bi-allelic genotype GG demonstrated a high frequency of 33 % and lowest of 10 % in the Balouchi and Punjabi groups respectively. The frequency of the 521C allele in comparison with the 388G allele was less with highest of 40 % in the Kashmiri group and lowest of 13 % in the Sindhi group with its bi-allelic genotype CC at 27 % and 7 % in Punjabi and in Kashmiri groups respectively. This clearly indicates that the 388G allele responsible for altered expression of OATP is much widely distributed in our population with its elevated focus towards the Kashmir and Hazara/Baltistan regions. The 521C allele responsible for altered function of OATP is less encountered in our population, but, is also concentrated towards the Kashmir and Hazara/Baltistan regions. The Punjabi and Sindhi groups have shown to be least affected by these SNPs therefore exhibited lower frequencies.
Same results extrapolated themselves when computed on full scale population. The highest frequency of 388G allele and its bi-allelic genotype GG were 21.5 % and 25.5 % respectively in the Hazara/Baltistan groups with a lowest frequency trend towards the Punjabi group. A similar behavior was demonstrated by the Kashmiri group for the 521C allele and its bi-allelic genotype CC with highest frequencies of 31.1 % and 32 % respectively. The lowest frequency was exhibited by Sindhi, Punjabi, and Pathan groups. A greater allelic variation in frequency was observed within the groups than within the whole population. This was augmented by the pairwise group comparisons (FST) using AMOVA resulted none significant P-values (Table 4). The lowest P-Values (P = 0.180, 0.108) for comparisons and (P= 0.181, 0.109) for average comparisons were found for Kashmir and Hazara/Baltistan groups respectively, when compared with the Punjabi group. No significant genetic variations for SLCO1B1 within the 6 ethnic groups of Pakistan were inferred from these P-values. It seems that interethnic mobilization and cross linkages/marriages have played a significant role in this distributed frequency pattern. However, the high interethnic group variations may explain the inter-individual differences in statin therapy and the attenuated benefit to risk ratio of statins in these groups.
Among the four haplotypes, *1A is referred to as the reference/control haplotype while all the other diploid haplotypes contain at least one variant allele. The distribution trend in haplotype frequencies among our population was a bit different from what we observed in the allelic and genotypic frequency distribution. When comparing within the groups, the highest frequency was 50 % for *1B in the Balouchi and Hazara/Baltistan groups followed by 43 % for Sindhi, 40 % for Pathan and Kashmir, and lowest of 20 % for the Punjabi group. Except for the reference/control haplotype, all the other haplotypes (*5 and *15) occurred at a relatively lower frequency (< 25 %) within the ethnic groups. A somewhat similar trend was observed when the haplotypes were investigated among the groups in the whole population with the exception of the *5 and *15 haplotype which occurred at a relatively higher frequency in Kashmiri and Hazara/Baltistan groups. The inter-ethnic group variations were also reflected by their significant P-values (Table 6) when compared with lower frequency groups such as Punjabi, Sindhi, and Pathan.
Keeping in view these statistical inferences, Kashmiri, Hazara/Baltistan and to a lesser extent the Balouchi population, are at a higher risk of haplotype induced inter-individual variations to drug disposition and therefore prone to elevated toxicity levels than might be observed in other ethnic groups.
It is evident from these findings that there might exist a significant haplotype variation within the ethnic groups of our population with little to no variation at the allelic and genotype levels. This significant haplotype variation can be explained by the combined effect of both the SNPs and their presence in linkage disequilibrium at more than one loci in our population.
The interpretations of allelic, genotype and haplotype frequency distributions from this study are in agreement with similar population studies that have been carried out in Chinese (10), Tanzanian (25), Brazilian (26, 27), Caucasian, African, and East Asian (28, 29), Canadian (30), Finnish (31), German and Turkish (32), African American and Hispanic populations (20, 33). One large scale study on the global analysis of genetic variations in SLCO1B1 (5) compared several populations for their allele and genotype frequencies and found that there was no significant difference within the groups of a population; however, a large variability existed when populations were compared with each other or in such haplotypes where alleles occurred in a linkage disequilibrium with each other. That study is in accordance with our findings and supports the fact of haplotype frequency variations within the groups of our population. Some of these studies have shown the significant effect of these frequencies and related them to the altered drug disposition while others have demonstrated no marked effect on drug PK and PD. Figure 3 delivers an overview of the allelic and their haplotype frequencies distribution within the different ethnic groups of Pakistani population.
Figure 3.
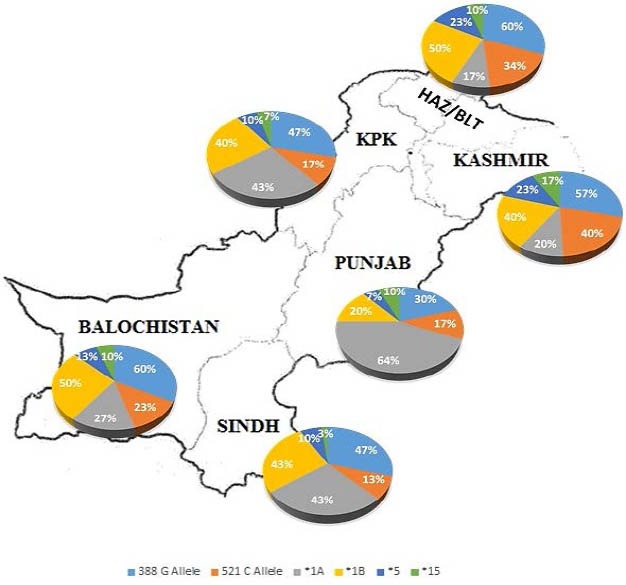
Frequency distribution of SLCO1B1 alleles and haplotypes within the ethnic groups of Pakistani population
Conclusion
Functionally significant sequence variations of OATP1B1 –encoding SLCO1B1 gene are widely distributed in our population at varying frequencies within the ethnic groups. The most detrimental homozygous variant 521CC genotype and its corresponding GC haplotype are relatively common in Kashmiri and Hazara/Baltistan ethnic groups; however, this diversity is only significant within the groups and not among the total Pakistani population. No significant genetic diversity exists for either SNP among the ethnic groups of our population. Moreover, a rapid and reliable T. ARMS genotyping assay was developed for the extensive analysis of SLCO1B1 genotype and haplotype variants in a large sample size. More studies can be performed for evaluating the effects of SLCO1B1 genetic variants on inter-individual variability in statins pharmacokinetics and pharmacodynamics.
Acknowledgment
We are thankful to Dr. Hassan Bin Hamza for the technical assistance and statistical interpretation. We are also thankful for the financial support of this project by Army Medical College, National University of Sciences and Technology (NUST), and Nimrall Laboratories (Pvt.) Ltd., Islamabad, Pakistan. The results described in this paper are part of a PhD research project and thesis authored by Tausif Ahmed Rajput.
References
- 1.Giacomini KM, Sugiyama Y. Brunton LL, Lazo JS, Parker KL. New York: McGraw-Hill; 2006. Goodman and Gillman's the pharmacological basis of therapeutics. [Google Scholar]
- 2.Zair ZM, Eloranta JJ, Stieger B, Kullak-Ublick GA. Pharmacogenetics of OATP (SLC21/SLCO), OAT and OCT (SLC22) and PEPT (SLC15) transporters in the intestine, liver and kidney. Pharmacogenomics. 2008;9:597–624. doi: 10.2217/14622416.9.5.597. [DOI] [PubMed] [Google Scholar]
- 3.Niemi M. Role of OATP transporters in the disposition of drugs. Pharmacogenomics. 2007;8:787–802. doi: 10.2217/14622416.8.7.787. [DOI] [PubMed] [Google Scholar]
- 4.Seithel A, Glaeser H, Fromm MF, Konig J. The functional consequences of genetic variations in transporter genes encoding human organic anion-transporting polypeptide family members. Expert Opin Drug Metab Toxicol. 2008;4:51–64. doi: 10.1517/17425255.4.1.51. [DOI] [PubMed] [Google Scholar]
- 5.Pasanen MK, Neuvonen PJ, Niemi M. Global analysis of genetic variation in SLCO1B1. Pharmacogenomics. 2008;9:19–33. doi: 10.2217/14622416.9.1.19. [DOI] [PubMed] [Google Scholar]
- 6.Morimoto K, Oishi T, Ueda S, Ueda M, Hosokawa M, Chiba K. A novel variant allele of OATP-C (SLCO1B1) found in a Japanese patient with pravastatin-induced myopathy. Drug Metab Pharmacokinet. 2004;19:453455. doi: 10.2133/dmpk.19.453. [DOI] [PubMed] [Google Scholar]
- 7.Zimmerman EI, Hu S, Roberts JL, Gibson AA, Orwick SJ, Li L, et al. Contribution of OATP1B1 and OATP1B3 to the disposition of sorafenib and sorafenib-glucuronide. Clin Cancer Res. 2013;19:1458–1466. doi: 10.1158/1078-0432.CCR-12-3306. [DOI] [PMC free article] [PubMed] [Google Scholar]
- 8.Anne TN, Mikko N, Oliver B, Stefan W, Ulrich MZ, Bruno S, et al. Genetics is a major determinant of expression of the human hepatic uptake transporter OATP1B1, but not of OATP1B3 and OATP2B1. Genome Med. 2013;5:1. doi: 10.1186/gm405. [DOI] [PMC free article] [PubMed] [Google Scholar]
- 9.Zhu J, Song M, Tan HY, Huang LH, Huang ZJ, Liu C, et al. Effect of pitavastatin in different SLCO1B1 backgrounds on repaglinide pharmacokinetics and pharmacodynamics in healthy Chinese males. Pak J Pharm Sci. 2013;26:577–584. [PubMed] [Google Scholar]
- 10.Zhou Q, Ruan ZR, Jiang B, Yuan H, Zeng S. Simvastatin pharmacokinetics in healthy Chinese subjects and its relations with CYP2C9, CYP3A5, ABCB1, ABCG2 and SLCO1B1 polymorphisms. Die Pharmazie. 2013;68:124–128. [PubMed] [Google Scholar]
- 11.Zhou Q, Chen QX, Ruan ZR, Yuan H, Xu HM, Zeng S. CYP2C9*3(1075A >C), ABCB1 and SLCO1B1 genetic polymorphisms and gender are determinants of inter-subject variability in pitavastatin pharmacokinetics. Die Pharmazie. 2013;68:187–194. [PubMed] [Google Scholar]
- 12.Shitara Y, Maeda K, Ikejiri K, Yoshida K, Horie T, Sugiyama Y. Clinical significance of organic anion transporting polypeptides (OATPs) in drug disposition: their roles in hepatic clearance and intestinal absorption. Biopharm Drug dispos. 2013;34:45–78. doi: 10.1002/bdd.1823. [DOI] [PubMed] [Google Scholar]
- 13.Ulvestad M, Skottheim IB, Jakobsen GS, Bremer S, Molden E, Asberg A, et al. Impact of OATP1B1, MDR1, and CYP3A4 expression in liver and intestine on interpatient pharmacokinetic variability of atorvastatin in obese subjects. Clin Pharmacol Ther. 2013;93:275–282. doi: 10.1038/clpt.2012.261. [DOI] [PubMed] [Google Scholar]
- 14.Niemi M, Schaeffeler E, Lang T, Fromm MF, Neuvonen M, Kyrklund C, et al. High plasma pravastatin concentrations are associated with single nucleotide polymorphisms and haplotypes of organic anion transporting polypeptide-C (OATP-C, SLCO1B1) Pharmacogenetics. 2004;14:429–440. doi: 10.1097/01.fpc.0000114750.08559.32. [DOI] [PubMed] [Google Scholar]
- 15.Shabana MF, Mishriki AA, Issac MS, Bakhoum SW. Do MDR1 and SLCO1B1 Polymorphisms influence the therapeutic response to atorvastatin?A study on a cohort of egyptian patients with hypercholesterolemia. Mol Diagn Ther. 2013;17:299–309. doi: 10.1007/s40291-013-0038-3. [DOI] [PubMed] [Google Scholar]
- 16.Tamraz B, Fukushima H, Wolfe AR, Kaspera R, Totah RA, Floyd JS, et al. OATP1B1-related drug-drug and drug-gene interactions as potential risk factors for cerivastatin-induced rhabdomyolysis. Pharmacogenet Genomics. 2013;23:355–364. doi: 10.1097/FPC.0b013e3283620c3b. [DOI] [PMC free article] [PubMed] [Google Scholar]
- 17.Scarpini F, Cappellone R, Auteri A, Puccetti L. Role of genetic factors in statins side-effects. Cardiovasc Hematol Dis Drug Targets. 2012;12:35–43. doi: 10.2174/187152912801823138. [DOI] [PubMed] [Google Scholar]
- 18.Wierzbicki AS, Viljoen A, Hardman TC, Mikhailidis DP. New therapies to reduce low-density lipoprotein cholesterol. Curr Opin Cardiol. 2013;28:452–457. doi: 10.1097/HCO.0b013e3283605fa2. [DOI] [PubMed] [Google Scholar]
- 19.Nies AT, Niemi M, Burk O, Winter S, Zanger UM, Stieger B, et al. Genetics is a major determinant of expression of the human hepatic uptake transporter OATP1B1, but not of OATP1B3 and OATP2B1. Genome Med. 2013;5:1. doi: 10.1186/gm405. [DOI] [PMC free article] [PubMed] [Google Scholar]
- 20.Ngaimisi E, Habtewold A, Minzi O, Makonnen E, Mugusi S, Amogne W, et al. Importance of ethnicity, CYP2B6 and ABCB1 genotype for efavirenz pharmacokinetics and treatment outcomes: A parallel-group prospective cohort study in two sub-Saharan Africa Populations. PloS One. 2013;8:e67946. doi: 10.1371/journal.pone.0067946. [DOI] [PMC free article] [PubMed] [Google Scholar]
- 21.Qaigen . 2nd ed. Qaigen, Helden, Germany: 2007. QIAamp DNA Mini and Blood Mini Handbook. [Google Scholar]
- 22.Ye S, Dhillon S, Ke X, Collins AR, Day IN. An efficient procedure for genotyping single nucleotide polymorphisms. Nucleic Acids Res. 2001;29:E88–98. doi: 10.1093/nar/29.17.e88. [DOI] [PMC free article] [PubMed] [Google Scholar]
- 23.Excoffier L, Lischer HE. Arlequin suite ver 3.5: a new series of programs to perform population genetics analyses under Linux and Windows. Mol Ecol Resour. 2010;10:564–567. doi: 10.1111/j.1755-0998.2010.02847.x. [DOI] [PubMed] [Google Scholar]
- 24.Slatkin M. Linkage disequilibrium in growing and stable populations. Genetics. 1994;137:331–336. doi: 10.1093/genetics/137.1.331. [DOI] [PMC free article] [PubMed] [Google Scholar]
- 25.Aklillu E, Mugusi S, Ngaimisi E, Hoffmann MM, Konig S, Ziesenitz V, et al. Frequency of the SLCO1B1 388A>G and the 521T>C polymorphism in Tanzania genotyped by a new LightCycler(R)-based method. Eur J Clin Pharm. 2011;67:1139–1145. doi: 10.1007/s00228-011-1065-9. [DOI] [PubMed] [Google Scholar]
- 26.Santos PC, Soares RA, Nascimento RM, Machado-Coelho GL, Mill JG, Krieger JE, et al. SLCO1B1 rs4149056 polymorphism associated with statin-induced myopathy is differently distributed according to ethnicity in the Brazilian general population: Amerindians as a high risk ethnic group. BMC Med Genet. 2011;12:136. doi: 10.1186/1471-2350-12-136. [DOI] [PMC free article] [PubMed] [Google Scholar]
- 27.Sortica Vde A, Ojopi EB, Genro JP, Callegari-Jacques S, Ribeiro-Dos-Santos A, de Moraes MO, et al. Influence of genomic ancestry on the distribution of SLCO1B1, SLCO1B3 and ABCB1 gene polymorphisms among Brazilians. Basic Clin Pharm Toxicol. 2012;110:460–468. doi: 10.1111/j.1742-7843.2011.00838.x. [DOI] [PubMed] [Google Scholar]
- 28.Jada SR, Xiaochen S, Yan LY, Xiaoqiang X, Lal S, Zhou SF, et al. Pharmacogenetics of SLCO1B1: haplotypes, htSNPs and hepatic expression in three distinct Asian populations. Eur J Clin Pharm. 2007;63:555–563. doi: 10.1007/s00228-007-0285-5. [DOI] [PubMed] [Google Scholar]
- 29.Man M, Farmen M, Dumaual C, Teng CH, Moser B, Irie S, et al. Genetic variation in metabolizing enzyme and transporter genes: comprehensive assessment in 3 major East Asian subpopulations with comparison to Caucasians and Africans. J Clin Pharm. 2010;50:929–940. doi: 10.1177/0091270009355161. [DOI] [PubMed] [Google Scholar]
- 30.Boivin AA, Cardinal H, Barama A, Pichette V, Hebert MJ, Roger M. Organic anion transporting polypeptide 1B1 (OATP1B1) and OATP1B3: genetic variability and haplotype analysis in white Canadians. Drug Metab Pharmacokinet. 2010;25:508–515. doi: 10.2133/dmpk.dmpk-10-sh-046. [DOI] [PubMed] [Google Scholar]
- 31.Pasanen MK, Backman JT, Neuvonen PJ, Niemi M. Frequencies of single nucleotide polymorphisms and haplotypes of organic anion transporting polypeptide 1B1 SLCO1B1 gene in a Finnish population. Eur J Clin Pharmacol. 2006;62:409–415. doi: 10.1007/s00228-006-0123-1. [DOI] [PubMed] [Google Scholar]
- 32.Mwinyi J, Kopke K, Schaefer M, Roots I, Gerloff T. Comparison of SLCO1B1 sequence variability among German, Turkish, and African populations. Eur J Clin Pharmacol. 2008;64:257–266. doi: 10.1007/s00228-007-0409-y. [DOI] [PubMed] [Google Scholar]
- 33.Endo S, Fukahori A, Tokuhiro S, Shinagawa A, Walker J, Yoshihara K, et al. Association study of genetic polymorphisms of drug transporters, SLCO1B1, SLCO1B3 and ABCC2, in African-Americans, Hispanics and Caucasians and olmesartan exposure. J Hum Genet. 2012;57:531–544. doi: 10.1038/jhg.2012.63. [DOI] [PubMed] [Google Scholar]