

Drug resistance is a major hurdle in oncology. Responses of Acute Myeloid Leukemia (AML) patients to cytarabine-based therapies are often short-lived with a median overall survival of months1–4. Therapies are under development to improve outcomes including targeting the eukaryotic translation initiation factor (eIF4E) with its inhibitor ribavirin5–7. In a phase II clinical trial in poor prognosis AML,5 ribavirin monotherapy yielded promising responses including remissions; however all patients relapsed (Figure 1A and Extended Data Figure 1). Here we identify a novel form of drug resistance to ribavirin and cytarabine (Ara-C). We observe that the sonic hedgehog transcription factor Glioma associated protein 1 (Gli1) and the UDP-glucuronsyl transferase (UGT1A) family of enzymes are elevated in resistant cells. UGT1As add glucuronic acid to many drugs, modifying their activity in diverse tissues8. Gli1 alone is sufficient to drive UGT1A dependent glucuronidation of ribavirin and Ara-C, and thus drug resistance. Resistance is overcome by genetic or pharmacological inhibition of Gli1 revealing a potential strategy to overcome drug resistance in some patients.
Figure 1. Ribavirin resistance in patients and cell lines.

A. Bone marrow biopsies for patient 11 (Wright-Giemsa staining, 50X magnification). EOT, end-of-treatment. B. Cell growth in untreated (UN) or 20 uM ribavirin (Rib), which is clinically achievable5. C. Westerns of eIF4E targets Mcl-1 and c-Myc. D. 3H ribavirin uptake.. E. eIF4E co-immunoprecipitation with 3H-ribavirin relative to IgG. Loading is in Extended Data Figure 6. F. Westerns of Gli1 and UGT1A. Panels B, D and E: Means +/− SD (error bars). *** p-value<0.001 (Student’s t-test). All panels: Experiments were completed in triplicate, at least three independent times. HSP90 and tubulin provide loading controls.
Figure 1.
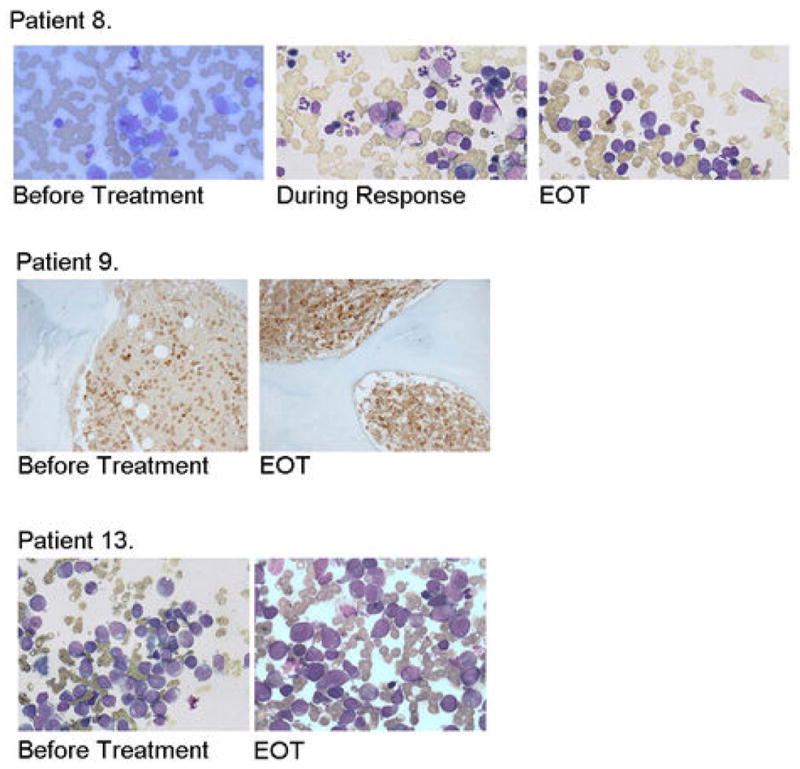
Ribavirin resistance in some ribavirin monotherapy clinical trial patients. BM biopsies for responding (patient 8 achieved a PR; patient 11 a CR is shown in Figure 1A) and non-responding patients (patient 9 was a PD and patient 13, SD). Note abundance of blasts before treatment and at the end of treatment (EOT) and reduction in blasts and restoration of hematopoiesis during response. For Wright-Giemsa stained samples magnification was 50× with oil (patients 8 and 13), and for Lysozyme staining 20X (Patient 9).
To better understand the molecular basis for relapse in our clinical trial, we generated resistant cells using head and neck carcinoma FaDu and M5 AML THP-1 cells, both of which have highly elevated eIF4E and concomitant ribavirin sensitivity6,7. Two forms of drug resistance emerged, characterized by unimpaired growth in clinically achievable ribavirin concentrations and a loss of eIF4E targeting (Figure 1B&C; Extended Data Figure 2A–C). Type I resistant cells (FRI, THPA, THPB) had severely impaired drug uptake, whereas Type II resistant cells (FRII) did not (Figures 1D; Extended Data 2D). Type I resistance was characterized by substantial reduction of adenosine kinase (ADK) (Extended Data Figure 7A–C). ADK acts in cellular retention of ribavirin since unphosphorylated ribavirin is readily exported by the nucleoside transporter ENT19,10. Indeed, ADK reduction alone imparts ribavirin resistance (Extended Data Figure 3C–D). Analysis of our patient pool indicated that only two patients had features consistent with type I resistance (Extended Data Figure 3E–F).
Figure 2.

Characterization of FaDu and THP-1 derived resistant cell lines. A. Detailed growth curves for FRI and FRII resistant cells. All cell lines have indistinguishable doubling times in the absence of ribavirin (far right panel). B. THP-1 resistant (TR) cell lines are not sensitive to treatment with ribavirin at the doses and times used. Ribavirin no longer targets eIF4E activity (i.e. Mcl-1) in resistant cells (far right panel). There were no changes in eIF4E levels between resistant and parental cell lines (and Figure 1C). Actin provides a loading control. C. Resistance is retained after 6 months growth in the absence of ribavirin. D. Incubation of live cells with 3H-ribavirin indicates that THP-1 resistant cells have impaired uptake of ribavirin similar to FRI cells. E. eIF4E cap binding and eIF4G binding activity are retained in FRII cells. F. FRII cells are sensitive to eIF4E knockdown measured by cell growth. G. Effects of RNAi mediated knockdown of Gli1 or eIF4E on UGT1A levels. Western blots were probed as indicated. RNAi mediated knockdown of Gli1 led to reduced levels of UGT1A whereas knockdown of eIF4E did not. For UGT1A, a pan-UGT1A antibody was used. Antibody controls for UGT1A and Gli1 are shown in Extended Data Figure 8. Results are representative of at least three independent experiments. Average values are reported and error bars indicate standard deviations. Experiments were carried out in triplicate, three independent times. Western blots are representative of at least three independent experiments.
Figure 7.

Mass Spectrometry Analysis of Ribavirin and Ara-C glucuronidation. A. MS/MS collision induced fragmentation analysis indicate that a breakdown product of the ribavirin glucuronide missing the ribose ring (exact mass 288.07) was further fragmented into a fragment of this glucuronide (exact mass 244.08, red asterisk) and to the triazole ring, the key moiety of ribavirin (exact mass 112.04). No ribose-glucuronide or ribose fragment was detected in our experiments suggesting this is not a major glucuronidation site in these cells. However, we cannot rule out that this exists and could not be detected. B. Microsomes expressing UGT1A1, UGT1A4, UGT1A6 and UGT1A9 were treated with RTP, underwent HILIC chromatography and the resulting EIC is shown. The Rib-Glu peak is clearly present and fragmentation analysis as in part A confirms that this is glucuronidated ribavirin. We note that microsomes only expressing UGT1A1 do not glucuronidate RTP; and that RTP, but not ribavirin, is glucuronidated in microsomes. These studies suggest that UGT1A4, UGT1A6 and/or UGT1A9 are required for glucuronidation as is some phosphorylation event prior to glucuronidation. C. Using HILIC chromatography, we isolated the fraction containing the Rib-Glu peak in part B. A portion of this was re-assessed by MS/MS to be sure that the correct peak was isolated. This material was used in the 3H ribavirin competition assay in Figure 4M. Material was quantified using a standard curve of ribavirin (see Materials and Methods). D. Western blot demonstrating equal loading of eIF4E-GST in the 3H ribavirin pulldown assay shown in Figure 4M. All results are representative of at least three independent experiments. E. AraC is glucuronidated (AraC-Glu) in FRII cells but not parental FaDu cells where AraC-TP (triphosphate) is observed. AraC-TP is also observed in FRII cells, but at much lower levels than AraC-Glu. Treatment of FRII cells with GDC-0449 results in the loss of the AraC-Glu peak and causes no alteration to the parental FaDu cells. Fragmentation strongly suggests that the cytosine is the major site of glucuronidation (data not shown). We did not observe masses consistent with an arabinose breakdown product or an arabinose-glucuronide but cannot rule out that they are present at low levels or that our isolation procedure precluded their detection. F. Structures of AraC and AraC-TP are shown. The red arrow indicating the most likely glucuronidation site, as per our mass spectrometry data. Note that no glucuronides were observed when reactions were incubated in the absence of UDP-glucuronic acid (data not shown).
Figure 3.

Pro-drug metabolism is impaired in Type I resistance. A–B. Western analysis reveals that ADK levels were reduced in FRI cells (panel A) and THP1 resistant cells (panel B). Treatments were 48 hours at 20μM ribavirin. C–D. Knockdown of ADK leads to ribavirin resistance as shown by cell growth. Western blot confirms knockdown of ADK. Hsp90 provides a loading control. E–F. ENT1 and ADK mRNA levels for patients’ specimens. Patient 11 (CR) was responding clinically at (and prior to) 84 and 112 days and relapsed around day 252, when both ADK and ENT1 mRNA levels decreased. Analysis of RNA samples isolated before and at the end of the first 28 day cycle for patient 9 (who did not respond to ribavirin) compared to a healthy volunteer. Averaged values for ADK and ENT1 RNAs were normalized to glucose 6-phosphate dehydrogenase (G6PDH). Error bars indicate SD and centre values are averages. All experiments were performed in triplicate at least three independent times. ** indicates p-value<0.01 and *** p-value<0.001 as determined by two-tailed Student’s t-test. Results are representative of at least three independent experiments.
Therefore, we investigated type II resistance. Given that eIF4E was not mutated and was functional in FRII cells (Extended Data Figure 2E–G), we examined whether the ribavirin-eIF4E interaction was disrupted, by assessing the ability of eIF4E to immunoprecipitate 3H-ribavirin (Figure 1E). While 3H-ribavirin is enriched ~6 fold in the eIF4E immunoprecipitated fraction in parental cells, this interaction is lost in FRII cells, despite normal uptake and functional eIF4E.
RNASeq analysis revealed that 30 transcripts were differentially expressed in FRII cells, including Gli1 mRNA, by 21 fold (Extended Data Table 1). Consistently, Gli1 protein levels were highly elevated, as was Gli1’s target SNAIL (Figure 1F). We investigated the clinical relevance of this elevation in our patients treated with ribavirin monotherapy. At relapse, leukemic blasts had elevated Gli1 mRNA levels for 9/9 patients examined (up to 10 fold baseline) (Figure 2A). For example, Gli1 mRNA and protein levels were elevated at relapse (e.g. patients 8 (complete remission (CR)), 11 (partial remission (PR)) and 17 (blast response (BR); Figure 2A; Extended Data Figure 4; confocal microscopy was used due to limited material at response). Interestingly, Gli1 levels in patient 17 decreased during response and re-emerged at relapse. Patients 9, 13 and 19, who did not respond clinically or molecularly, had highly elevated Gli1 levels before treatment, relative to healthy individuals or responding patients. Moreover in our ribavirin and low-dose Ara-C phase I combination trial, patients A (CR, relapsed at 2 years) and B (CR, relapsed at 9 months) had increased Gli1 levels at relapse (Figure 2A). For patient C (PR, off treatment due to a dose limiting toxicity), Gli1 mRNA levels were unchanged at EOT, consistent with continued remission at that time. Thus, elevated Gli1 is associated with primary and acquired resistance in both ribavirin clinical trials. We observed that Types I and II resistance co-existed in two patients (Figures 2 and Extended Data Figure 3). Whether this occurs in the same cells or if multiple resistant populations emerge is unknown.
Extended Data Table 1.
RNASeq results of genes with different expressions in FRII versus parental and FRI cells. The cut off was set at Padj value of <0.005.
| ID | F old Change | log2FoldChange | padj | |
|---|---|---|---|---|
| NM_005269 | GLI1 | 21.05351195 | 4.395989005 | 4.53763E-19 |
| NM_019076 | UGT1A8 | 0.071885361 | −3.798158182 | 5.14486E-10 |
| NM_021027 | UGT1A9 | 0.071885361 | −3.798158182 | 5.14486E-10 |
| NM_019075 | UGT1A10 | 0.071885361 | −3.798158182 | 5.14486E-10 |
| NM_019077 | UGT1A7 | 0.071885361 | −3.798158182 | 5.14486E-10 |
| NM_019093 | UGT1A3 | 0.075269208 | −3.731796399 | 1.09556E-09 |
| NM_205862 | UGT1A6 | 0.071407143 | −3.80778779 | 1.09556E-09 |
| NM_019078 | UGT1A5 | 0.076934805 | −3.700219774 | 1.09556E-09 |
| NM_000463 | UGT1A1 | 0.081523375 | −3.616642411 | 1.75756E-09 |
| NM_001072 | UGT1A6 | 0.079970619 | −3.644386132 | 1.98554E-09 |
| NM_007120 | UGT1A4 | 0.082083144 | −3.606770194 | 1.98554E-09 |
| NM_031479 | INHBE | 5.823391175 | 2.541859532 | 1.36431E-07 |
| NM_003256 | TIMP4 | 12.35630007 | 3.627174907 | 2.27095E-07 |
| NM_000728 | CALCB | 10.86606199 | 3.441757277 | 9.14258E-07 |
| NM_006096 | NDRG1 | 4.095561837 | 2.034061377 | 1.21428E-05 |
| NM_144717 | IL20RB | 5.043343881 | 2.334380599 | 1.5497E-05 |
| NR_026572 | PDE2A | 12.80113496 | 3.678199821 | 1.79464E-05 |
| NM_005980 | S100P | 4.549241234 | 2.185625939 | 1.94272E-05 |
| NM_002462 | MX1 | 4.548672811 | 2.185445664 | 1.99955E-05 |
| NM_016818 | ABCG1 | 7.006493344 | 2.808692575 | 2.18839E-05 |
| NM_001144925 | MX1 | 4.464277528 | 2.158426717 | 2.78929E-05 |
| NM_001005340 | GPNMB | 4.317327762 | 2.110138623 | 2.78929E-05 |
| NM_138420 | AHNAK2 | 4.477547206 | 2.162708642 | 3.45273E-05 |
| NM_002272 | KRT4 | 0.141121624 | −2.824989024 | 3.48607E-05 |
| NM_001795 | CDH5 | 0.13455534 | −2.893728445 | 3.48607E-05 |
| NM_001901 | CTGF | 0.116697976 | −3.099148557 | 0.000227563 |
| NM_001561 | TNFRSF9 | 10.39142803 | 3.377322023 | 0.000410767 |
| NM_019850 | NGEF | 6.893341444 | 2.785203477 | 0.000500665 |
| NM_020318 | PAPPA2 | 6.0439344 | 2.595488002 | 0.000763335 |
| NM_018406 | MUC4 | 0.080064648 | −3.642690811 | 0.000783474 |
| NM_006408 | AGR2 | 0.030727143 | −5.024342563 | 0.004759868 |
Figure 2. Gli1 status underpins resistance.

A. Gli1 mRNA levels before treatment(BT), at best response(Resp) and EOT for ribavirin-treated patients/healthy volunteers. B. Gli1 mRNA (right) and UGT1A protein (left) for patients treated with Ara-C- therapies at relapse(R)/diagnosis(D). C–D. Effects of Gli1-overexpression on drug sensitivity: ribavirin(20 uM), Ara-C(200 nM, clinically achievable7). E. siRNA to Gli1 restores drug sensitivity. siLuc, non-specific control RNA. A–B. RNA results were normalized to ubiquitin. All panels: Means+/−SD (error bars). Experiments were completed in triplicate at least three independent times. ** p-value<0.01, *** p-value<0.001 (Student’s t-test). Figure 4A–C shows corresponding westerns. Actin, tubulin and GADPH provide loading controls.
Figure 4.

Confocal micrographs of leukemic blasts isolated from bone marrows of responding and non-responding patients at before treatment (BT), Response or End of Treatment (EOT). Immunostaining for Gli1 and UGT1A are shown. DAPI is in blue. Note nuclear accumulation of Gli1 in non-responding patients, indicating elevated Gli1 activity. High levels of Gli1 and UGT1A suggest primary resistance. All confocal settings were identical between specimens and thus lower signal is indicative of less protein. A 100X objective with no digital zoom was used for patients 9, 11, 13, 17 and 19. The same objective but a digital zoom of 2X was used for patients 8, A, B and C. Note Patient C was still in remission at EOT (see main text). For each patient, staining was carried out three independent experiments. Controls for specificity of Gli1 and UGT1A antibodies are provided in Extended Data Figure 8.
We extended these studies to investigate whether Gli1 levels were elevated in patients who failed more commonly used Ara-C therapies (Figure 2B). Gli1 mRNA levels were substantially elevated at relapse relative to diagnosis in 7/9 patients examined. Consistently, analysis of The Cancer Genome Atlas AML dataset11 showed that Gli1 elevation was associated with poor prognosis (Extended Data Figure 5). These data suggest that Gli1 overexpression contributed to drug resistance and clinical relapse in some AML patients.
Figure 5.

Higher Gli1 expression is found in poor cytogenetic risk group and predicts a trend of worse survival outcome in AML. To study the prognostic value of Gli1 gene expression in AML, we mined the publicly available AML data set published by The Cancer Genome Atlas Research Network11 (A) Gli1 gene expression in 176 de novo AML patients grouped by cytogenetic risks. The expression level is represented by RPKM value which stands for Reads Per Kilobase of transcript per Million mapped reads in RNA-seq. Each patient is represented by a symbol. Error bars represent median ± IQR (Inter-Quartile Range) of each group. Nonparametric Mann-Whitney test was used to analyze the differences between groups. A total of 176 de novo AML patients with complete mRNA-seq and cytogenetic risk classification data are included in this analysis. (B, C) Kaplan-Meier plots of events-free survival (EFS) and overall survival (OS) of 168 de novo AML patients segregated by median Gli1 expression (RPKM=0.8596) (B) or high Gli1 expression (RPKM greater than or equal to 2) (C). Each tick on the survival curve represents a censored event because the patient is still alive at the end of the TCGA study. A total of 168 de novo AML patients with complete mRNA-seq, and reliable EFS, and OS data are included in this analysis (Patient information details are described in the Supplemental Table 1 of the NEJM study11. Mantel-Cox test was performed to calculate log-rank p values. We also observed that abnormally low levels of Gli1 were also correlated with poor outcome (data not shown), suggesting that Gli1 levels must be in a “Goldilocks” zone.
Next, we investigated whether Gli1 alone imparted drug resistance by generating FaDu and THP1 cells stably overexpressing Gli1 (FaDu-Gli; THP1-Gli; Figure 2C&D). Growth of Gli1-overexpressing cells was not substantially affected by levels of ribavirin or Ara-C that impaired growth of controls. Further, Gli1 knockdown re-sensitized FRII cells to ribavirin and Ara-C without affecting growth in the absence of either drug (Figure 2E).
In order to identify strategies to restore drug sensitivity, we used a clinically approved inhibitor of sonic hedgehog signaling upstream of Gli1, GDC-044912 (Figures 2D and 3A). FRII cells were pretreated with 200nM GDC-0449 (which is clinically achievable13) and subsequently, 20μM ribavirin. Strikingly, GDC-0449 treatment followed by ribavirin led to ~ 60% reduction in growth relative to untreated FRII cells. GDC-0449 treatment alone did not substantially affect growth in either cell line. Importantly, GDC-0449 treatment also restored sensitivity to clinically relevant Ara-C levels (200nM). Furthermore, GDC-0449 treatment of FaDu-Gli and THP-Gli cells re-sensitized these to ribavirin and Ara-C (Figures 2D and 3A). Finally, a direct inhibitor of Gli1, GANT-6114 paralleled the effects of GDC-0449 (Extended Data Figure 6A). Thus, type II resistance is reversed by pharmacological inhibition of the sonic hedgehog pathway.
Figure 3. Targeting Gli1 activity.

A. FRII cell growth +/− GDC-0449 (GDC) and ribavirin or Ara-C. B. The ribavirin-eIF4E complex is measured as a function of Gli1 status using 3H-ribavirin and eIF4E immunoprecipitation relative to IgG controls: FaDu-Gli1 cells, siGli1, GDC-0449 treatment. See Extended Data Figure 6 for immunoprecipitation controls. C. Methyl-cellulose colony growth assays in specimens from M4/M5 AML patients or healthy volunteers (bone marrow). All panels: Mean +/− SD (error bars). Results are representative of at least three independent experiments in triplicate (A–D) or at least two (E) in replicates of 5. p-value <0.01 **, and p-value<0.001 *** (Student’s t-test).
Figure 6.

Effects of modulation of Gli1 levels on UGT1A A. Effects of the direct Gli1 inhibitor GANT-61 on restoring ribavirin sensitivity (20 uM) in FRII cells. Effects are dependent on GANT-61 dose. B–D. Controls for eIF4E-ribavirin immunoprecipitations (IP) shown in Figures 1E and 3B. Inputs, supernatants (Sn) and IP controls for 3H ribavirin anti-eIF4E IPs are shown for GDC-0449 treated cells (B), FRII and FRI cells (C), and RNAi mediated knockdown of Gli1 (D). E–G. qPCR analysis of Gli1 (E) and UGT1A (F) using a pan-UGT1A primer or primers for specific UGT1As (G). mRNA levels were normalized to RNA Polymerase IIa. These findings are consistent with Extended Data Table 1 which indicates lower levels of UGT1A mRNA levels. Further, UGT1A3 and UGT1A8 decreased similarly (data not shown). Experiments were carried out in triplicate, at least three independent times. Average values are reported and error bars indicate standard deviations. These findings, that Gli1 elevation leads to reduce mRNA levels but increased protein levels are counter-intuitive. We hypothesize that Gli1 elevation increases protein stability of UGT1As (see below) and this leads to some sort of feedback mechanism leading to reduced UGT1As. Other scenarios are possible but the main point that Gli1 elevation leads to increased UGT1A protein production is clear. G. Gli1 increases UGT1A protein stability as shown by studies with the proteasomal inhibitor MG132 and a pan-UGT1A antibody. Here, MG132 addition stabilizes levels of UGT1A in parental cells, but in FRII cells where levels are already increased, there is no further increase with MG132. This indicates that UGT1A proteins are already stabilized in the FRII cells. All results are representative of three independent experiments. H. Western blot analysis with a pan-UGT2B antibody indicates that UGT2B levels are unchanged in FRII relative to FaDu cells suggesting the glucuronidation effects are mediated mostly through the UGT1A family. Tubulin provides a loading control.
To better understand the molecular basis for resistance, we monitored the ability of eIF4E to immunoprecipitate 3H-ribavirin as a function of Gli1 status (Figures 3B–D; Extended Data 6B–D). While eIF4E-ribavirin complexes were readily detected in controls, they were absent in Gli1-overexpressing cells (Figure 3B). Conversely, GDC-0449 treatment or Gli1 knockdown in FRII cells restored ribavirin-eIF4E complexes to control levels (Figure 3B). Thus, there is a clear correlation between Gli1 elevation, reduction in eIF4E-ribavirin complexes, and resistance.
Given that resistant cells did not form ribavirin-eIF4E complexes but retained active eIF4E (Figures 1E, 3B–D, Extended Data 2E–G), we hypothesized that ribavirin, and possibly Ara-C, underwent some form of Gli1 dependent modification. The drug metabolizing UGT1A enzymes had elevated protein levels in FRII cells. thereby suggesting a resistance mechanism (Figures 1F & 4A–C). This was also the case for FaDu-Gli and THP-Gli cells, relative to vector controls (Figures 2D; 4B). Significantly, Gli1 knockdown or GDC-0449 treatment reduced UGT1A protein levels (Figure 4A–C), confirming the correlation between Gli1 and UGT1A protein expression. Note that Gli1 does not increase mRNA levels but rather the protein stability of UGT1As (Extended Data Figure 6E–H).
Figure 4. Link between Gli1, UGT1A and drug glucuronidation.

A–C. Westerns as a function of Gli1. HSP90 provides a loading control. D–I. MS/MS extracted ion chromatographs are shown. Rib-Glu Ribavirin Glucuronide; RDP* (ribavirin diphosphate minus H2O). Fragmentation of Rib-Glu peak confirms its identity (Extended Data Figure 7). J. Ribavirin, the best-supported glucuronidation site indicated by red arrow. K. Glucuronic acid L. RDP M. 3H ribavirin-eIF4E-GST complexes competed by equimolar amounts of compounds. 3H ribavirin did not bind beads alone. See Extended Data Figure 7D for loading. Averages +/− SD (error bars). Experiments were carried out in triplicate, at least three independent times.
To determine the clinical relevance of these observations, we examined UGT1A protein levels during response and relapse using confocal microscopy (Extended Data Figure 4). We observed UGT1A elevation upon relapse i.e. patients 11 (CR), 8 (PR) and 17 (BR) in the ribavirin monotherapy trial and in patients A (CR) and B (CR) in the combination trial. Patient C (PR) had no change in UGT1A levels at EOT, consistent with still being in remission. In patients treated with standard Ara-C therapies, UGT1A protein levels were elevated in 6/7 specimens at relapse relative to diagnosis. and this occurred in the patients with concomitant elevated Gli1. There was insufficient material for protein analysis of the remaining two specimens (Figure 2B).
Next, we used mass spectrometry (MS) to determine if ribavirin and Ara-C were glucuronidated in resistant cells (Figure 4D–I; Extended Data Figure 7). Metabolites were isolated, subjected to hydrophilic chromatography and detected by ESI-MS. In parental cells, ribavirin diphosphate (RDP) is the major peak (Figure 4E&L). In FRII cells, a new peak emerged with a mass consistent with the ribavirin-glucuronide (Figure 4D). Using collision induced ion fragmentation, we observed the triazole moiety of ribavirin as a major fragment supporting this as a site of glucuronidation (Figure 4L, red arrow; Extended Data 7A). Relative peak intensities suggest that there is more ribavirin-glucuronide than RDP (Figure 4D). Strikingly, GDC-0449 treatments eliminated ribavirin glucuronidation in FRII cells (Figure 4F). Gli1 overexpression in parental cells led to formation of ribavirin-glucuronides (Figure 4H). In vitro glucuronidation studies indicated that specific UGT1As are likely important to this process as is ribavirin phosphorylation (Extended Data Figure 7). Moreover, we observe AraC-glucuronides in FRII but not parental cells, and this modification was lost upon GDC-0449 treatment (Extended Data Figure 7). Thus, Ara-C and ribavirin glucuronidation were Gli1-dependent, and elimination of the glucuronides by Gli1 inhibition correlated with restored drug sensitivity.
We examined the capacity of ribavirin-glucuronides to bind eIF4E. Ribavirin-glucuronide was isolated by hydrophilic chromatography and confirmed by MS/MS (Extended Data Figure 7C). Using eIF4E-GST immobilized on glutathione agarose, we observed that non-radioactive ribavirin or RTP compete for 3H ribavirin-eIF4E complexes, whereas neither the negative control GTP nor the ribavirin-glucuronide did so (Figure 4M). Thus, ribavirin glucuronidation impairs its interaction with eIF4E, underpinning resistance.
To further explore the effects of Gli1 inhibition on drug sensitivity, we monitored colony growth of primary AML specimens as a function of GDC-0449 treatment (Figure 3C). Specimens were selected from patients that had previously failed induction chemotherapy. We observed that while GDC-0449 has little effect on colony growth alone, it strongly potentiated the effects of Ara-C and ribavirin, presumably by elimination of the respective glucuronides. By contrast, we observe little effect in specimens from healthy volunteers, consistent with our results in control cells.
Several factors likely contribute to Gli1 elevation in FRII cells, including reduced Patched1 levels but not altered promoter methylation or modified hedgehog ligand levels (Extended Data Figure 8). Glucuronidation is typically perceived as a detoxification pathway but does not always enhance drug excretion15. Similar to our findings with ribavirin and eIF4E, testosterone glucuronidation modifies its targets rather than its efflux.15 Our findings reveal a role for Gli1 in drug metabolism and resistance. Here, Gli1 inhibition could restore drug sensitivity and thereby provide therapeutic benefit.
Figure 8.
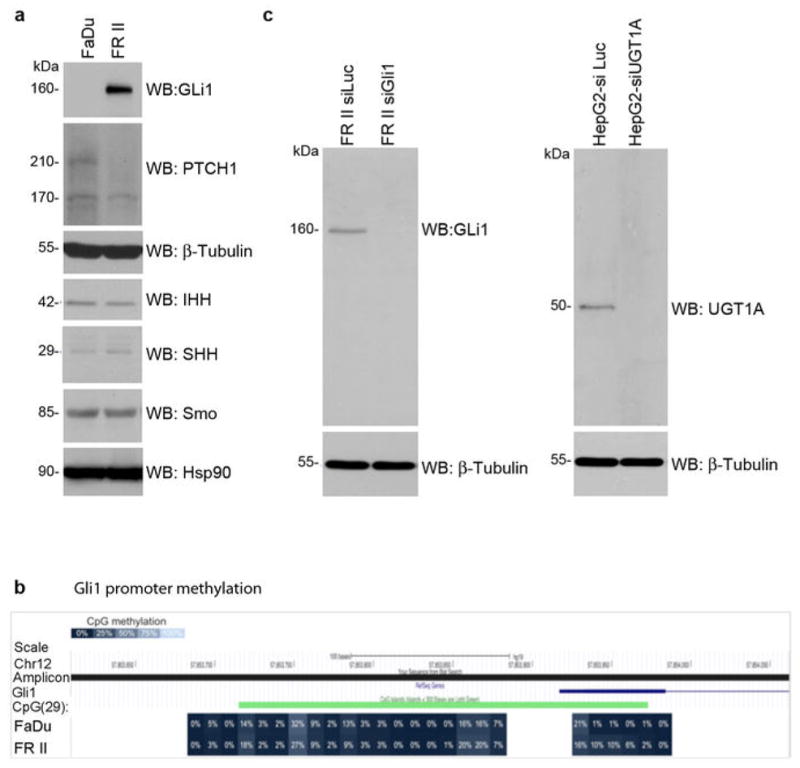
Investigations into why Gli1 levels are elevated in FRII cells. A. Analysis of expression of a subset of hedgehog signalling pathway proteins. Western blots are probed as indicated and are representative of three independent experiments. Tubulin and Hsp90 provided loading controls. Patched 1 (PTCH1) was the most significant change. PTCH1 is 210 kDa, with an often observed degradation product at 170 kDa. IHH indicates Indian Hedgehog; SHH sonic hedgehog, Smo smoothened. B. GLI1 DNA methylation. CpG methylation was interrogated on bisulfite converted DNA from GLI1 promoter region and first exon. The amplicon covered 29 CpG, 25 of them located within a CpG island. DNA CpG methylation is shown as percent methylation for FaDu (top) and FRII (bottom) cells. There was no difference observed between the cell lines. C–D. Antibody controls. Analysis of Gli1 (C) and pan-UGT1A (D) antibodies as a function of RNAi mediated knockdown of these proteins as indicated. Note that UGT1A family members have approximately the same molecular weight. Results are representative of at least three independent experiments.
Material and Methods
Reagents and constructs
Full length human Gli1 was obtained from Addgene (K12 Plasmid 16419), subcloned into 2-Flag-pcDNA3.1 or pMSCV-GFP (bicistronic vector) and the subsequent clones validated by sequencing. Ribavirin was obtained from Kemprotec (CAS 36791-04-5), Cytosine β-D-arabinofuranoside (C17680) and Gant61 (G9048) from Sigma Aldrich, Vismodegib (GDC-0449, S1082) from Selleckchem, Ribavirin-13C2 (13C on the triazole ring and carboxy amide, TLC-ID # R-041, CAS number 36791-04-5) from TLC PharmaChem, Ribavirin [triazole-5-3H] (MT540) from Moravek Biochemicals and Radiochemicals, Ribavirin 5′-Triphosphate Trisodium Salt (R414505) from Toronto Research Chemicals.
Antibodies for immunoblotting were as follows: mAb mouse anti-eIF4E (BD PharMingen, 610270), pAb rabbit anti-eIF4E (Sigma Aldrich, E5906), mAb mouse anti-β-Actin (Sigma Aldrich, A5441), mAb mouse anti-α-Tubulin (Sigma Aldrich, T5168), pAb goat anti-ADK (D-21) (Santa Cruz, sc-23360), pAb goat anti-ENT1 (N-12) (Santa Cruz, sc-45489), pAb rabbit anti-Mcl-I (S-19) (Santa Cruz, sc-819), mAb mouse anti-c-myc (9E10) (Santa Cruz, sc-40), mAb mouse anti-HSP 90α/β (F-8) (Santa Cruz, sc-13119), mAb mouse anti-eIF4G (A-10) (Santa Cruz, sc-133155), mAb rabbit anti-Gli1 (C68H3) (Cell Signaling, 3538), pAb rabbit anti-UGT1A (Cell Signaling, 4371S), mAb rabbit anti-Snail (C15D3) (Cell Signaling, 2522S), mAb rabbit anti-4E-BP1 (53H11) (Cell Signaling, 9644), mAb rabbit anti-IHH (Indian hedgehog; EP1192Y) (Abcam, ab52919), mAb rabbit anti-SHH (sonic hedgehog; C9C5) (Cell Signaling, 2207S), pAb anti-PTCH1 (H-267) (Santa Cruz, sc-9016), mAb mouse anti-Smo (Smoothened; E-5) (Santa Cruz, sc-166685), UGT2B pan antibody (Santa Cruz, sc-50386). Antibody specificity for UGT1A and Gli1 is shown in Extended Data Figure 8. Results with UGT1A pan antibody above were confirmed with another pan-UGT1A antibody from Santa Cruz sc-25847. The pan-UGT1A antibodies recognizes the common carboxy terminus of UGT1As; with UGT1As having approximately the same molecular weight)8 Importantly, the effects were specific to UGT1A as UGT2Bs levels were not changed (Extended Data Figure 6I).
Cell culture and Transfection
FaDu cells (ATCC® HTB-43™) were maintained in Minimal Essential medium (MEM) supplemented with 1% MEM Non-Essential Amino Acids, 10% heat-inactivated fetal bovine serum (FBS) and 1% penicillin-streptomycin (Invitrogen). 2Flag-Gli1 or 2Flag vector control FaDu cell lines were generated using TransITR-LT1 Transfection Reagent (Mirus), according to manufacturer guidelines and were selected using Geneticin® Selective Antibiotic (G418 Sulfate) (MultiCell). THP1 cells (ATCC® TIB202™) were maintained in RPMI 1640 (Invitrogen) supplemented with 10% heat-inactivated fetal bovine serum (FBS) and 1% penicillin-streptomycin. THP1-Gli1 cells were generated using pMSCV-GFP as described in17. HepG2 cells (ATCC® HB-8065™) were maintained in Dulbecco’s Modified Medium (DMEM) supplemented with 10% heat-inactivated fetal bovine serum (FBS) and 1% pencillin-streptomycin (Invitrogen). For RNAi experiments, FaDu and HepG2 cells were transfected with Lipofectamine 2000 (Invitrogen) and 40 nM siRNA duplexes, and were analyzed 96 hours post-transfection. The following siRNA duplexes were used: si_Gli1 (Designed by Integrated DNA technology, catalogue number: HSC.RNAI.N005269.12.3_10NM), si_eIF4Esense (CCCAAAUCUCGAUUGCUUGACGCAGUC), si_eIF4E anti-sense: (CUGCGUCAAGCAAUCGAGAUUUGGG); si_Adk (designed by Integrated DNA technologies, catalogue number HSC.RNAI.N001123.12.5); siUGT1A three sequences were used such that the total amount of the siRNA mix is equal to 40 nM (designed by Integrated DNA technologies, catalogue number HSC.RNAI.N001072.12.2_10NM; HSC.RNAI.N001072.12.10_NM; HSC.RNAI.N007120.12.9_NM), Control duplex: si_Luc sense: (CACGUACGCGGAAUACUUCGA), si_Luc anti-sense: (CAUUUCGAAGUAUUCCGCGUACGUGUU).
Generation of Ribavirin Resistant Cell lines
FaDu or THP-1 cells were exposed to either a single concentration of ribavirin for a prolonged period (e.g. 10μM for FRII cells) or increased concentrations starting at 1 μM and doubling the concentration every 2 weeks until cells became resistant to 100 μM ribavirin (FRI) or starting with 10 and 20μM ribavirin and doubling the concentration after 2 months (THP based cells: TR-A and TR-B). Cells were routinely tested for ribavirin resistance. All cell lines (resistant and parental) were routinely checked to ensure there was no mycoplasma contamination using MycoAlert Mycoplasma Detection kit (Lonza, LT07-418).
Drug treatments and cell viability assay
These assays were carried out as previously described16. Briefly, 25×104 cells/ml were seeded in triplicates/condition in 12-well cell culture plates (BD Biosciences 353043) (except for experiments involving pre-treatments with GDC-0449, where 15× 104 cells/ml were used). To measure the effect of ribavirin on cell growth, cells were treated on the next day with 0, 10, 20, 50, or 100 μM ribavirin. Treatments were repeated every 48 hours and cell viability was assessed by Trypan-blue dye exclusion test at each concentration every 24 or 48 hours up to five days. The percentage growth inhibition of treated cultures relative to untreated cultures was determined. Further, the ability of GDC-0449 or Gant-61 to restore sensitivity to ribavirin or AraC was determined by pre-treating cells with 200 nM GDC-0449 or 20–40 μM Gant-61 for 6 and 3 days, respectively, followed by treatments with 20 μM ribavirin or 200 nM AraC for 4 days. Cell viability was measured as mentioned above. Note that the IC50 for each of the above mentioned drugs was determined a priori and that all of our cell viability experiments were validated by colorimetric assays using the Cell Counting Kit-8 (from Dojindo Molecular Technologies, CK04-11) according to the manufacturer’s guidelines.
Drug Uptake
Cells were plated in triplicates at a density of 0.5×10⁶ cells/ml in 12 well plates. 24 hours later, cells were incubated with 0.66 μM 3H-Ribavirin for 2, 4, 6, 8, 12, and 16 hrs. After treatment cells were washed twice with ice-cold PBS and lysed with 2 volumes of NaOH (1N) and then neutralized with equal volume of HCl (1N). Samples were mixed with 5 ml Optiphase “Hisafe 2” Scintillation cocktail (Perkin Elmer, 1200-436) and radioactivity was measured using a liquid scintillation counter (Tri-Carb 2800 TR, PerkinElmer).
eIF4E - 3H-Ribavirin Immunoprecipitation
Cells were seeded at a density of 1.2×10⁶ cells/900μL of a 6-well plate (BD Biosciences, 353046) (3 wells were used per each cell line tested) and incubated with 0.66 μM 3H-Ribavirin for 8hrs at 37°C, 5% CO2. Following incubation, cells were washed three times with PBS and scraped in IP buffer (50 mM Tris pH 5.5, 5 mM EDTA, 150 mM NaCl, 0.5% NP40 and 1% Triton X-100). Cells were then homogenized using a glass Dounce homogenizer and left to rotate at 4°C for 30 minutes. After centrifugation at 10,000 rpm for 10 minutes at 4°C, supernatants were split into two tubes and pre-cleared with normal mouse-IgG beads (Santa Cruz, sc-2343) for 30 minutes at 4°C. After spinning at 500×g for 5 minutes, protein concentrations were quantified using Pierce BCA Protein assay (Thermo Scientific, 23223). 100–200 μg of protein lysates were used for immunoprecipitation with 8μg of normal mouse IgG (Millipore, 12-371) or mAb mouse anti-eIF4E (P-2) (Santa Cruz, sc-9976) antibodies coupled to Protein A/G PLUS-Agarose (Santa Cruz, sc-2003). Immunoprecipitations were carried out overnight at 4°C. Beads were washed 6 times with IP buffer and eluted with 80 μl 2× Laemmli sample buffer (BioRad) for 15 minutes at 99 °C. After spinning beads supernatants were used for scintillation counting and western analysis (probed with rabbit anti-eIF4E antibody).
Deep Sequencing
Total RNAs were isolated from different cell lines using Trizol (Invitrogen). Samples were prepared into 50 bp fragment libraries and sequenced on the ABI SOLiD v.3 to obtain an average of 3.2 giga base pair of transcript sequences. Data was mapped to the reference genome using the RNAseq pipeline found in the Bioscope software{https://products.appliedbiosystems.com/ab/en/US/adirect/ab?cmd=catNavigate2&catID=606802,#2}. Keeping only uniquely matching reads, we used fragment count per transcript as an estimate of gene expression. We then used the statistical method based on a negative binomial distribution and implemented in the DESeq package18 for R to compare samples and obtain a robust measure of differential expression between samples. The resulting p values were adjusted for multiple testing with the Benjamin-Hochberg procedure to yield Padj values.
Reverse transcription and Quantitative PCR
DNAse treated RNA samples (TurboDNase, Ambion) were reverse transcribed using MMLV reverse transcriptase (Invitrogen) or Supervilo kit (Invitrogen) for primary specimens. QPCR analyses were performed using EXPRESS SYBR® GreenER™ QPCR SuperMix (Invitrogen) in AB StepOne thermal cycler using the relative standard curve method (Applied Biosystems User Bulletin #2). All conditions were described previously5,19. Primers list includes:
Gli1Fw(GGCTGCAGTAAAGCCTTCAGCAAT),
Gli1Rv(TGCAGCCAGGGAGCTTACATACAT),
UGT1AFw (ACTGGAACCCGACCATCGAATCTT),
UGT1ARv (CACCAAACAAGGGCATCATCACCA),
UGT1A1Fw (AACAAGGAGCTCATGGCCTCC)
UGT1A4Fw (GAAGGAATTTGATCGCGTTAC)
UGT1A6Fw (TCCTGGCTGAGTATTTGGGCC)
UGT1A9Fw (GGAGGAACATTTATTATGCCACCG)
Common UGT1ARv2 (CCAATGAAGACCATGTTGGGC)
UbcFw (ATTTGGGTCGCGGTTCTTG),
UbcRv (TGCCTTGACATTCTCGATGGT),
RPIIaFw (TGACTGCCAACACAGCCATCTACT),
RPIIaRv (GGGCCACATCAAAGTCAGGCATTT),
G6PDHFw (TGGCAAAGTCGGTTTCTCTCTGGA),
G6PDHRv (TTGGGAACATGTCTCAGACTGGCA)
ADK Fw (AGAGGCAGCGAATCGTGATCTTCA)
ADK Rv (ACCTCCAACAAATGCATCTCCAGC)
ENT1Fw (CTCTCAGTGCCATCTTCAAC)
ENT1Rv (CAGAAACACCAGCAGGATGG)
Western Blot Analysis
Western analysis was performed as described previously with a modified lysis buffer (Phospholysis Buffer: 40 mM Hepes, pH 7.5, 120 mM NaCl, 1 mM EDTA, 10 mM β-glycerophosphate, 50 mM NaF, 0.5 μM NaVO3, and 1% [vol/vol] Triton X-100 supplemented with complete protease inhibitors [all from Sigma-Aldrich]). In addition, blots were blocked in BSA blocking solution (3% [wt/vol] BSA [Sigma-Aldrich] or 5% milk in TBS–Tween 20), and primary antibodies were diluted in BSA blocking solution or 5% milk.
Immunofluorescence and laser-scanning confocal microscopy
Immunostaining was carried out as described 5. Briefly, upon methanol fixation (10 minutes at −20°C), cells were blocked for 1h, and incubated with 1° antibodies (1:500 dilution) overnight at 4°C, followed by 3 washes in blocking solution. Cells were then incubated with 2° donkey anti-rabbit IgG-Texas Red antibody (Jackson Immunolaboratories, diluted 1:100 in blocking solution), washed 4 times with 1xPBS (pH 7.4) and mounted in Vectashield with DAPI (Vector laboratories). Analysis was carried out using a laser-scanning confocal microscope (LSM510 META; Carl Zeiss, Inc.), exciting 405 and 543nm or 488nm with a 100× objective, 2× digital zoom (where indicated), and numerical aperture of 1.4. Channels were detected separately, with no cross talk observed. Confocal micrographs represent single sections through the plane of the cell. Images were obtained from LSM510 software version 3.2 (Carl Zeiss, Inc) and displayed using Adobe Photoshop CS2 (Adobe).
Mass spectroscopy
FaDu, FRII, 2Flag, 2Flag Gli1 or GDC-0449 treated cells grown in culture were trypsinized and put in to suspension at a density of 10×106 cells/ml media20. Concentrations of 1 mM Ribavirin mix [12C-Ribavirin + 13C2-Ribavirin in a 50:50 ratio] were added in duplicate per condition and samples were incubated in a 37°C shaker. A 100 μl aliquot was taken at different time points (0, 10, 30, 60, 120, 180, 240, 300 and 360 minutes) mixed with equal volume of 100% methanol (Fisher Scientific, HPLC grade, A412P-4) and flash frozen in liquid nitrogen. Samples were stored overnight at −80 °C. At the time of analysis, samples were thawed, centrifuged at 10,000 rpm for 10 minutes and subjected to hydrophilic chromatography in line with mass spectrometer. The system used was an Agilent 1100 HPLC coupled to an Agilent MSD Trap SL, with an ESI source. The autosampler system was kept at 4°C. The HPLC column was an Inertsil HILIC, 150 × 4.6 mm, 5 μm and the chromatography was obtained using solvent A (2 mM ammonium formate in water, pH 3.2) and solvent B (100% acetonitrile). The injection volume was 50 μl and the flow rate 1 ml/min. The column compartment was heated at 30°C. The initial gradient was 95% B and 5% A which changed during a 30 min course to 5% B and 95% A followed by 6 min equilibration at 95 % B and 5 % A. The total run time of the gradient was 36 min. The ESI source of the coupled MS ion-trap was set in positive ion mode, the nitrogen drying gas flow at 12 ml/min, the nebulizer pressure at 55 PSI and the temperature of the capillary at 350°C with a voltage of 4500 V. The mass analyzer was set to scan from 50 to 1500 m/z. For cytarabine glucuronidation assay, the same protocol was applied however the initial gradient was ran over a 20 minute time course rather than 30 min.
Glucuronidation Assay
Glucuronidation of ribavirin by human liver microsomes expressing UGT1A1, UGT1A4, UGT1A6 and UGT1A9 was performed as described previously21. Briefly, 50μg of pooled human liver microsomes (BD Biosciences, 452116) were incubated with 25 μg Alamethicin (Sigma Aldrich, A4665) and 50 mM Tris-HCl pH 7.4 containing 10 mM MgCl2, for 15 minutes on ice to allow formation of channels in the microsome membrane thus enabling access to the UGTs’ active sites170. Following incubation, 8.5 mM Saccharic acid 1, 4-lactone (β-glucronidase inhibitor, Sigma Aldrich, S0375) and 1 mM Ribavirin 5′-triphosphate were added and the mixture was incubated at 37°C for 5 minutes. Finally to activate the reaction, 100 μM of Uridine 5′-diphosphoglucuronic acid (UDPGA, Sigma Aldrich, U6751) were combined and incubations were performed at 37°C for 6 hours. Note that no glucuronides were observed in the absence of UDPGA addition (data not shown). All reactions were made in 100 μl final volume and were terminated by the addition of 100 μl cold methanol (100%). The mixtures were kept at −80°C for at least 3 hours, then thawed and centrifuged for 10 minutes at 10,000 rpm and the resulting supernatants were analyzed by hydrophilic chromatography in line with the mass spectrometer, as described above. We note that RTP was clearly glucuronidated in these microsomes whereas ribavirin was not suggesting that ribavirin needs to be phosphorylated in order to be efficiently or stably glucuronidated. However, this step would be prior to glucuronidation as we never observed RTP-glucuronide or other phosphorylated form of the ribavirin-glucuronide. Furthermore, we did not observe glucuronidation of RTP in supersomes that express only UGT1A1 suggesting that other UGT1As must be present. Finally, although we observed glucuronidation of Ara-C efficiently in FRII and FaDu-Gli cells, we did not observe it in the microsomes, suggesting that some other UGT1A (than UGT1A1, UGT1A4, UGT1A6 and UGT1A9) need to be present for efficient glucuronidation. Clearly this family member is well expressed in the FRII and FaDu-Gli cells.
Purification of Ribavirin-glucuronides
Ribavirin-glucuronide was isolated from our microsomal preparation using the same liquid chromatography method described above with the time course for initial gradient being expanded to 40 minutes in order to obtain a better separation of the different metabolites. Briefly, given that the ribavirin glucuronide (Rib-Glu) peak elutes around 8.9 minutes, three 500μl fractions were collected bracketing this time and lyophilized by centrifugation using Sarvant SpeedVacc High Capacity Concentrator (Thermo Scientific, SC210A-115). The material obtained from lyophilisation were re-suspended in a small volume of water: methanol (50:50 v/v) and an aliquot was re-analyzed by HPLC-MS to verify the isolation and purity of the metabolite. To estimate the concentration of the purified Rib-Glu, a standard curve with the metabolite versus Ribavirin 13C2 (used as an internal standard) was generated. The concentration range for the standard curve was from 10 nM to 1 mM. The curves were constructed by plotting the concentration of the internal standard against the area of the analyte.
3H-Ribavirin Pulldown
To determine whether Rib-Glu binds eIF4E, we performed an in vitro binding assay. Briefly, 10 nM of purified recombinant eIF4E-GST protein was coupled to 40 μL of glutathione sepharose beads (GE Healthcare Life Sciences, 17-5132-01) for 30 minutes at room temperature in buffer containing 50 mM Tris-HCl pH=7.4, 300 mM NaCl, 2.5 mM MgCl2, 0.5 mM DTT, 0.015% NP40, 0.5% protease-free BSA, and protease inhibitors. Washed beads were then incubated with 250 nM 3H-Ribavirin and an equivalent concentration of either purified Rib-Glu, 1H-Ribavirin, RTP, GTP or blank for 30 minutes at room temperature in a buffer containing 100 mM sodium phosphate pH 7.5, 300 mM NaCl, 0.015% NP40, 10 μM BSA and protease inhibitors. Washed beads were then eluted in 1× Laemmeli sample buffer (containing β–mercaptoethanol) and radioactivity in supernatants was measured by scintillation counting (Note that for washing the beads, 100 μM of GTP was added).
m7G-Sepharose Affinity Chromatography
Cells were harvested from 10-cm plate/condition at 80% confluency and lysed in 2 volumes of Buffer B (50mM MOPS/KOH pH7.4, 100mM NaCl, 50 mM NaF 2mM EDTA, 2mM EGTA, 1% NP40, 1% Na-DOC, 7 mM β-mercaptoethanol, protease inhibitors and 1mM Na3VO4) on ice for 15 minutes with occasional vortexing. Lysates were spun at 16,000×g for 10 minutes at 4°C m7GDP-Agarose beads (GE Healthcare UK, 275025) were washed in Buffer C (50 mM MOPS/KOH 7.4, 100 mM NaCl, 50 mM NaF, 0.5mM EDTA, 0.5 mM EGTA, 7 mM BME, 2 mM benzamidine or 0.5 mM PMSF, 1mM Na3VO4 and 0.1mM GTP). Lysates (~500 μg) were diluted to 1ml with Buffer C and added washed beads (~50 μl of 50% slurry). After incubation of the reactions for 20 minutes at 4°C on the rotating wheel, beads were washed at least 3 times with Buffer C and eluted with 2× Laemmli buffer (BioRad). Note that all centrifugation steps are 500×g for 1 minute at 4°C.
Protein Stability
To determine whether Gli1 regulates UGT1A protein’s half-life, we investigated the effect of MG132 proteasome inhibitor (Sigma Aldrich) on UGT1A’s half-life. Both FRII and wild type cells were seeded at 70% confluency in 10 cm plates 24 hours prior to treatment. Then cells were treated with 10 μM MG132 or an equivalent volume of Methanol as a control. Ten hours post-treatment, cells were harvested and lysed in phospholysis buffer and UGT1A protein stability was assessed by western analysis using a pan-UGT1A antibody.
Primary AML specimens and healthy volunteers
A total of 19 patients were enrolled in the study in 3 participating centers; Jewish General Hospital, Hamilton Health Sciences, and Hopital Maisonneuve Rosemont. In total, 15 patients were eligible for evaluation. Written informed consent was obtained as per the Helsinki Protocol. This study received IRB (all sites) and Health Canada approval. ClinicalTrials.gov registry is NCT00559091. Clinical response was assessed using the Cheson criteria22. Patients had to receive a diagnosis of primary or secondary AML, French-American-British [FAB] subtypes M4 or M5 only, relapsed or refractory after at least 1 cycle of conventional chemotherapy; or newly diagnosed but not be candidates for induction chemotherapy. Patients must also have been at least 18 years of age; and must have had an Eastern Cooperative Oncology Group (ECOG) performance status lower than 3 and a life expectancy of at least 12 weeks. Other requirements were as outlined in Assouline et al5. The ribavirin Ara-C combination phase I trial (Clinicaltrials.gov NCT01056523) is recently completed, patients with remissions were analyzed for Gli1 and UGT1A levels. Criteria were the same as for the monotherapy trial described above. Written informed consent according to the Declaration of Helsinki was obtained from all patients as for the monotherapy trial. For analysis of primary specimens in colony growth assays, specimens were obtained from the Leukemia Cell Bank of Quebec (BCLQ), with no identifying information. Leukemic blasts were isolated by flow cytometry as described in 5. For tissue matched controls at diagnosis and relapse, patient specimens were collected with written informed consent from either University of Rochester Medical Center RSRB approval and ClinicalTrials.gov NCT01311258 or from the BCLQ. For controls, normal bone marrow, peripheral blood mononuclear cells or normal CD34+ cells, were used as indicated, were obtained from StemCell Technologies (Vancouver, BC, Canada). Protein and RNA were isolated as described (see below).
Bone Marrow Staining
Squash preparations of bone marrow aspirates and touch prints of bone marrow biopsies were air-dried and stained with Wright-Giemsa. To examine the specimens Leica DMLS microscope with the 50× objective oil immersion lens was used. The Infinity 1-2C-184976 camera was used to capture images and images were analyzed on the Infinity Analyze image acquisition software (release 5.0.2, 2002–2009 Infinity corporation). Lysozyme staining was as described previously23. Images for lysozyme staining were captured Leica DM LB2 microscope, and Leica DFC 350X camera and displayed with Adobe Photoshop 7.0 software.
Single locus DNA methylation assays
Total genomic DNA was extracted from 2 × 10⁶ FaDu and FRII cells using the Gentra Puregene cell kit (Qiagen) and eluted in RNAse-free water. EpiTYPER assays (Sequenom, CA) were performed on bisulfite-converted DNA. Bisulfite conversion was performed using EZ DNA Methylation kit from Zymo Research (Irvine, CA). EpiTYPER primers were designed to cover 29 GLI1 CpGs (25 of them in CpG island) using Sequenom EpiDesigner beta software (http://www.epidesigner.com/). Primer sequences are below:
EpiTYPER primers
GLI1-F1: GGGTTTTGGGGGTGTAATAAGT
GLI1-R1: CCCTAAAAAACTAAACATCCCCTC
GLI1-F2: TTTGGGATGAGTTTTTAAGAAGTTG
GLI1-R2: CCTAAAAATCCTAAAAATACAATAAACCC.
Acknowledgments
We are grateful for critical reading of the manuscript by Alex Kentsis, Michael Osborne, Filippa Pettersson, Sonia del Rincon and Claude Perreault. We are grateful for the use of Pharmascience facilities thanks to Morris Goodman, for specimens from the BCLQ, and for technical discussions with Marc Ouellet. We thank nursing and support staff at all the clinical sites, and Anup Ramteke and Abdellatif Amri for technical support. KLBB is supported by funds from the NIH (RO1 80728 and 98571), IRICoR and Translational Research Program grants from the Leukemia and Lymphoma Society USA. KLBB holds a Canada Research Chair and HAZ holds a Cole Foundation Fellowship and a CNRS Lebanon Fellowship.
Footnotes
Author contributions:
HAZ and BCK designed and performed experiments, analyzed data and wrote the manuscript, LC and GC performed experiments, PG, SP, CTJ analyzed data, AAR performed experiments and analyzed data, JJ and SM designed experiments, SA was medical monitor for the trial, treated patients and analyzed clinical data, EC, coordinated clinical trial and analyzed clinical data, BL and JB treated patients and analyzed clinical data, WHM designed experiments, analyzed data and edited the manuscript, KLBB designed experiments, analyzed data and wrote the manuscript.
Conflict of interest
KLBB, SA, WHM, HAZ, BCK, BL, JB, GC, PG, EC, LC, SP, CT, MBJ have no competing financial interests. SJM, JBJ and AAR are/were employees of Pharmascience.
References
- 1.Deschler B, de Witte T, Mertelsmann R, Lubbert M. Treatment decision-making for older patients with high-risk myelodysplastic syndrome or acute myeloid leukemia: problems and approaches. Haematologica. 2006;91:1513–1522. [PubMed] [Google Scholar]
- 2.Deschler B, Lubbert M. Acute myeloid leukemia: epidemiology and etiology. Cancer. 2006;107:2099–2107. doi: 10.1002/cncr.22233. [DOI] [PubMed] [Google Scholar]
- 3.Pulsoni A, et al. Survival of elderly patients with acute myeloid leukemia. Haematologica. 2004;89:296–302. [PubMed] [Google Scholar]
- 4.Hiddemann W, et al. Management of acute myeloid leukemia in elderly patients. Journal of clinical oncology : official journal of the American Society of Clinical Oncology. 1999;17:3569–3576. doi: 10.1200/JCO.1999.17.11.3569. [DOI] [PubMed] [Google Scholar]
- 5.Assouline S, et al. Molecular targeting of the oncogene eIF4E in acute myeloid leukemia (AML): a proof-of-principle clinical trial with ribavirin. Blood. 2009;114:257–260. doi: 10.1182/blood-2009-02-205153. blood-2009-02-205153 [pii] [DOI] [PubMed] [Google Scholar]
- 6.Kentsis A, Topisirovic I, Culjkovic B, Shao L, Borden KL. Ribavirin suppresses eIF4E-mediated oncogenic transformation by physical mimicry of the 7-methyl guanosine mRNA cap. Proc Natl Acad Sci U S A. 2004;101:18105–18110. doi: 10.1073/pnas.0406927102. [DOI] [PMC free article] [PubMed] [Google Scholar]
- 7.Kraljacic BC, Arguello M, Amri A, Cormack G, Borden K. Inhibition of eIF4E with ribavirin cooperates with common chemotherapies in primary acute myeloid leukemia specimens. Leukemia. 2011;25:1197–1200. doi: 10.1038/leu.2011.57. [DOI] [PubMed] [Google Scholar]
- 8.Tukey RH, Strassburg CP. Human UDP-glucuronosyltransferases: metabolism, expression, and disease. Annu Rev Pharmacol Toxicol. 2000;40:581–616. doi: 10.1146/annurev.pharmtox.40.1.581. [DOI] [PubMed] [Google Scholar]
- 9.Jarvis SM, Thorn JA, Glue P. Ribavirin uptake by human erythrocytes and the involvement of nitrobenzylthioinosine-sensitive (es)-nucleoside transporters. Br J Pharmacol. 1998;123:1587–1592. doi: 10.1038/sj.bjp.0701775. [DOI] [PMC free article] [PubMed] [Google Scholar]
- 10.Willis RC, Carson DA, Seegmiller JE. Adenosine kinase initiates the major route of ribavirin activation in a cultured human cell line. Proc Natl Acad Sci U S A. 1978;75:3042–3044. doi: 10.1073/pnas.75.7.3042. [DOI] [PMC free article] [PubMed] [Google Scholar]
- 11.Cancer Genome Atlas Research, N. Genomic and epigenomic landscapes of adult de novo acute myeloid leukemia. The New England journal of medicine. 2013;368:2059–2074. doi: 10.1056/NEJMoa1301689. [DOI] [PMC free article] [PubMed] [Google Scholar]
- 12.Mas C, Ruiz i Altaba A. Small molecule modulation of HH-GLI signaling: current leads, trials and tribulations. Biochem Pharmacol. 80:712–723. doi: 10.1016/j.bcp.2010.04.016. S0006-2952(10)00261-3 [pii] [DOI] [PubMed] [Google Scholar]
- 13.Lorusso PM, et al. Pharmacokinetic dose-scheduling study of hedgehog pathway inhibitor vismodegib (GDC-0449) in patients with locally advanced or metastatic solid tumors. Clin Cancer Res. 2011;17:5774–5782. doi: 10.1158/1078-0432.CCR-11-0972. [DOI] [PubMed] [Google Scholar]
- 14.Lauth M, Bergstrom A, Shimokawa T, Toftgard R. Inhibition of GLI-mediated transcription and tumor cell growth by small-molecule antagonists. Proc Natl Acad Sci U S A. 2007;104:8455–8460. doi: 10.1073/pnas.0609699104. [DOI] [PMC free article] [PubMed] [Google Scholar]
- 15.Dutton G. Glucuronidation of Drugs and Other Compounds. CRC Press; 1980. [Google Scholar]
- 16.Olah E, et al. Molecular mechanisms in the antiproliferative action of taxol and tiazofurin. Anticancer research. 1996;16:2469–2477. [PubMed] [Google Scholar]
- 17.Fisher MB, Campanale K, Ackermann BL, VandenBranden M, Wrighton SA. In vitro glucuronidation using human liver microsomes and the pore-forming peptide alamethicin. Drug metabolism and disposition: the biological fate of chemicals. 2000;28:560–566. [PubMed] [Google Scholar]
- 18.Anders S, Huber W. Differential expression analysis for sequence count data. Genome biology. 2010;11:R106. doi: 10.1186/gb-2010-11-10-r106. [DOI] [PMC free article] [PubMed] [Google Scholar]
- 19.Culjkovic-Kraljacic B, Baguet A, Volpon L, Amri A, Borden KLB. The oncogene eIF4E reprograms the nuclear pore complext to promote mRNA export and oncogenic transformation. Cell Reports. 2012;2:207–215. doi: 10.1016/j.celrep.2012.07.007. [DOI] [PMC free article] [PubMed] [Google Scholar]
- 20.Engtrakul JJ, Foti RS, Strelevitz TJ, Fisher MB. Altered AZT (3′-azido-3′-deoxythymidine) glucuronidation kinetics in liver microsomes as an explanation for underprediction of in vivo clearance: comparison to hepatocytes and effect of incubation environment. Drug metabolism and disposition: the biological fate of chemicals. 2005;33:1621–1627. doi: 10.1124/dmd.105.005058. [DOI] [PubMed] [Google Scholar]
- 21.Barbier O, et al. 3′-azido-3′-deoxythimidine (AZT) is glucuronidated by human UDP-glucuronosyltransferase 2B7 (UGT2B7) Drug metabolism and disposition: the biological fate of chemicals. 2000;28:497–502. [PubMed] [Google Scholar]
- 22.Cheson BD, et al. Revised recommendations of the International Working Group for Diagnosis, Standardization of Response Criteria, Treatment Outcomes, and Reporting Standards for Therapeutic Trials in Acute Myeloid Leukemia. Journal of clinical oncology : official journal of the American Society of Clinical Oncology. 2003;21:4642–4649. doi: 10.1200/JCO.2003.04.036. [DOI] [PubMed] [Google Scholar]
- 23.Horny HP, Wehrmann M, Steinke B, Kaiserling E. Assessment of the value of immunohistochemistry in the subtyping of acute leukemia on routinely processed bone marrow biopsy specimens with particular reference to macrophage-associated antibodies. Human pathology. 1994;25:810–814. doi: 10.1016/0046-8177(94)90251-8. [DOI] [PubMed] [Google Scholar]