The Cebpa +37-kb enhancer directs preferential expression to myeloid, as compared to megakaryocyte/erythroid or lymphoid progenitors, and to functional long-term hematopoietic stem cells.
Keywords: hematopoiesis, myelopoiesis, differentiation
Abstract
C/EBPα is expressed preferentially in myeloid compared with lymphoid or erythroid cells and directs myeloid lineage specification. C/EBPα is also expressed at lower levels in HSCs and in several nonhematopoietic tissues. The Cebpa gene has a conserved, 450-bp segment at +37 kb that harbors enhancer-specific epigenetic marks and is activate in a myeloid cell line. Herein, we characterize transgenic C57BL/6 mice, in which the Cebpa enhancer and 845-bp promoter regulate a hCD4 reporter. FACS analysis, in vitro colony assays, and in vivo competitive and secondary transplantation revealed that myeloid but not MEPs or lymphoid progenitors and also functional LT-HSCs are found almost exclusively in the Cebpa-hCD4+ compared with hCD4− marrow population. hCD4+ CMP yielded predominantly myeloid, whereas hCD4− CMP generated mainly Meg/E colonies. Providing insight into control of CMP maturation, Cebpa and Pu.1 RNAs were preferentially expressed in hCD4+ CMP, Scl, Gata2, Gata1, Klf1, Ets1, and Fli1 predominated in hCD4− CMP, and Runx1, Myb, HoxA9, and Erg levels were similar in both. Cebpa-hCD4 transgene expression was lacking in multiple nonhematopoietic tissues. In summary, the +37-kb Cebpa enhancer and promoter are sufficient for marrow myeloid progenitor and LT-HSC-specific expression.
Introduction
C/EBPα is a basic region-leucine zipper transcription factor expressed in granulocytic and monocytic myeloid but not in erythroid or lymphoid cells during marrow hematopoiesis [1]. C/EBPα is also present at a several-fold lower level in marrow-derived HSCs [2]. Mx1-Cre-mediated deletion of the Cebpa alleles in adult mice induces markedly reduced numbers of GMP, leading to impairment of both granulopoiesis and monopoiesis, without significant loss of preceding CMP; in addition, marrow LT-HSC quiescence is impaired [3–5]. Outside of hematopoiesis, C/EBPα is found in hepatocytes, adipocytes, pneumocytes, and additional lineages [6, 7]. The CEBPA gene is mutated in ∼10% of human AMLs, and either CEBPA transcription is repressed or its activity is reduced via serine phosphorylation in additional cases [8]. The identification of cis regulatory elements that direct Cebpa gene expression to hematopoietic stem and myeloid progenitors is thus relevant to normal and malignant myelopoiesis.
The Cebpa promoter contains a TATAA box and is positively regulated by C/EBPα via a binding site located at −182 bp [9]. Notch signaling represses Cebpa transcription in myeloid cells via Hes-1 interaction at −170 and −436 bp [10], and Runx1 weakly activates the promoter in the 32Dcl3 myeloid line via two near-consensus binding sites located at −285 bp [11]. In addition, the Cebpa gene contains a 450-bp regulatory element located at +37 kb that is 85% conserved in the human CEBPA gene, contains the H3K4me1 enhancer-specific histone modification, and binds the p300 coactivator; also, the +37-kb Cebpa segment activates the −725/+125-bp Cebpa promoter sixfold in 32Dcl3 cells, dependent on integrity of its four perfect Runx1 consensus sites [11].
To evaluate the hypothesis that the putative +37-kb Cebpa enhancer linked to its cognate promoter is sufficient to activate transcription in myeloid progenitors and potentially also in adult LT-HSCs, we have now characterized transgenic mice, in which these Cebpa regulatory elements direct expression of a hCD4 reporter. Cytoplasmic truncation of hCD4 prevents it from sending signals into the cell, and its expression at the plasma membrane allows detection by FACS antibodies that do not cross-react with murine CD4. A chicken β-globin insulator element was included to favor insertion site-independent expression—a single insulator functions as well as flanking insulators for this purpose [12]. Transgenesis was conducted in the C57BL/6 background to facilitate transplantation analysis of LT-HSC function.
Two founders were obtained, one with high copy number, sufficient for FACS detection of hCD4, and a second detectable only by qRT-PCR. FACS analysis and functional studies conducted on hCD4+ versus hCD4− cells, obtained from total marrow or from CMP, demonstrated that myeloid progenitors and LT-HSCs are found almost exclusively in the hCD4+ population, which also contains bipotent macrophage/B lymphoid progenitors, whereas MEPs or B lymphoid progenitors were found almost exclusively in the subset that lacks Cebpa-hCD4 transgene expression. A similar expression pattern was evident in FL hematopoietic subsets. RNA analysis of progenitors from both founder lines confirmed this expression pattern and also demonstrated only very low-level transgene expression in hepatocytes, adipocyte, pneumocytes, and additional nonhematopoietic tissues. RNA analysis of sorted CMP identified transcription factors specific to the hCD4+ or hCD4− subpopulations, providing insight into the further maturation of CMP to GMP versus MEP.
MATERIALS AND METHODS
Generation of transgenic mice
The 1.3-kb Cebpa enhancer/promoter elements were positioned upstream of the 1.4-kb hCD4 cDNA isolated from pVav-hCD4 [13], and the 2.4-kb avian β-globin insulator (kindly provided by Gary Felsenfeld, U.S. National Institutes of Health, Bethesda, MD, USA) was positioned downstream. Vector sequences were released by KpnI/SalI digestion, and sterile transgene DNA was injected into CD45.2+ C57BL/6 blastocysts by the Johns Hopkins Transgenic Core. Founders were identified by PCR using Phusion high-fidelity polymerase (New England Biolabs, Ipswich, MA, USA), with 3.0% DMSO, 54°C annealing temperature, and primers: CebpaEP forward: 5′-AACAGGAAAGATGGCACCAG, and CebpaEP reverse: 5′-CCACGGGCTCTTCAGAGTAG. E13.5 FL cells were obtained via timed matings.
FACS analysis and flow cytometry
Antibodies were from PharMingen (San Diego, CA, USA), unless otherwise specified. hCD4 was detected using FITC-anti-hCD4 (RPA-T4) or PE-anti-hCD4 (OKT4; BioLegend, San Diego, CA, USA), and blood elements were detected using PE-anti-CD3 (145-2C11), PE-anti-B220 (RA3-6B2), APC-anti-CD19 (1D3), PE-anti-Mac-1 (M1/70), PE-anti-Ter119 (Ter119), and APC-anti-Gr-1 (RB6-8C5; BioLegend). Stem and progenitor cells were enumerated using biotin-anti-lineage cocktail, PerCP-Cy5.5-streptavidin, APC-anti-c-Kit (2B8), and PE-Cy7-anti-Sca-1 (D7; eBioscience, San Diego, CA, USA), in addition to PE-anti-CD16/CD32 (FcγR, 2.4G2) and Brilliant Violet 421-anti-CD34 (RAM34) for CMP, GMP, and MEP; PE-Texas Red-anti-CD127 (IL-7R, SB199) for CLP; or Brilliant Violet 421-anti-CD34 and PE-anti-CD135 (FLT3, A2F10.1) for MPP, ST-HSC, and LT-HSC. Alternatively, LSK cells were stained using PE-anti-CD150 (Q38-480) and Brilliant Violet 421-anti-CD48 (HM48-1) for LSK/SLAM LT-HSC. Megakaryocytes were detected using PE-anti-CD41 (MWReg30). T cell subsets were identified using PE-anti-CD4 (GK1.5; BioLegend), APC-anti-CD8a (53-6.7; BioLegend), PerCP-Cy5.5-anti-CD25 (PC61.6; eBioscience), and PE-Cy7-anti-CD44 (IM7) antibodies. Pre-B and pro-B cells were identified using biotin-conjugated anti-Gr-1, anti-Mac-1, anti-CD3, anti-Ter119, and anti-IgM (11/41; eBioscience); anti-NK1.1 (PK136; eBioscience); Brilliant Violet 605-streptavidin (BioLegend); PerCP-Cy5.5-anti-B220 (RA3.6B2; eBioscience); and PE-anti-CD43 (S7). hCD4− versus hCD4+ subsets were obtained via a FACSAria II cell sorter (BD Biosciences, San Jose, CA, USA).
Progenitor assays
Myeloid CFUs were enumerated on Day 9 after culture in MethoCult M3231 (Stem Cell Technologies, Vancouver, BC, Canada) with methylcellulose, IMDM, HI-FBS 10 ng/mL murine IL-3, 10 ng/mL murine IL-6, and 20 ng/mL murine SCF. Meg/E-CFUs were enumerated on Day 10 after culture in MethoCult M3120 (1% final concentration) with IMDM, 2 mM glutamine, 55 nM β-ME, and 10% plasma-derived serum (Animal Technologies, Tyler, TX, USA); 20% BIT (Stem Cell Technologies); 5% protein-free hybridoma medium (PFHM)-II (Invitrogen, Carlsbad, CA, USA); and 10 U/mL (100 ng/mL) murine EPO and 10 ng/mL murine TPO. B lymphoid-CFUs were enumerated, 7 days after culture, in MethoCult 3630 with IMDM, HI-FBS, and human IL-7. CFU cells were subjected to morphologic analysis via cytospin and Wright-Giemsa staining.
Transplantation studies
hCD4− or hCD4+ transgenic CD45.2+ marrow cells were transplanted by tail vein injection, alone (1E6/recipient) or at a 1:1 ratio with 2E5 CD45.1+ competitor cells into syngeneic CD45.1+ recipient mice irradiated to 950 cGy. Mice were killed at 18–20 weeks, and marrow and peripheral blood cells were analyzed using FITC-anti-hCD4, PE-anti-CD45.1 (A20), and APC-anti-CD45.2 (104; BioLegend) or mature lineage markers. 1E6 Marrow cells from primary recipients were transplanted into irradiated secondary recipients, one secondary mouse/primary mouse, which were analyzed similarly 16–18 weeks later.
RNA preparation and analysis
RNA from hematopoietic cells was prepared using NucleoSpin RNA II, with use of RNase-free DNase (Machery-Nagel, Bethlehem, PA, USA). Tissues were homogenized in Trizol using Tissue Tearor (United Laboratory Plastics, St. Louis, MO, USA); RNA was extracted using chloroform, isopropanol-precipitated, and purified further using NucleoSpin RNA II. qPCR was carried out using 5–25 ng of each cDNA using iQ SYBR Green Supermix (Bio-Rad, Hercules, CA, USA). Primers are listed in Supplemental Table 1.
Statistical analysis
The Student's t-test was used for statistical comparisons.
RESULTS AND DISCUSSION
The +37-kb Cebpa enhancer/promoter directs transgene expression preferentially to phenotypic myeloid progenitors and LT-HSC
A diagram of the 450-bp +37-kb Cebpa enhancer linked to the −725/+125-bp Cebpa promoter, the cytoplasmically truncated hCD4 reporter, and the avian β-globin insulator is shown (Fig. 1A). Marrow mononuclear cells from a founder line with hCD4 expression sufficient for detection by FACS (Line 1) were analyzed for surface hCD4 in Mac-1+Gr-1+ neutrophils, Mac-1+Gr-1− monocytes, CD3+ T cells, B220+ or CD19+ B cells, or Ter119+ nucleated erythroid cells; representative data labeled with the average percent of hCD4+ cells in each population and their sds are shown (Fig. 1B). With the exception of monocytes, <10% of these mature cells expressed hCD4. On average, 7% of total marrow, 13% of Lin−, 41% of Lin−Sca-1−c-Kit+, and 76% of LSK cells expressed hCD4 (not shown). To enumerate hCD4 expression in lineage-restricted progenitors, the Lin−Sca-1−c-Kit+ population was analyzed for CD34 and FcγR and the Lin−Sca-1lowc-Kitlow subset for IL-7R (Fig. 1C). On average, 56% of CMP, 70% of GMP, 36% of CLP, but only 2% of MEP expressed hCD4. To assess hCD4 expression in earlier stem/progenitor subsets, LSK cells were analyzed for CD34 and Flk2/FLT3 (Fig. 1D). Ninety-one percent of MPP, 61% of ST-HSC, and 17% of LT-HSC expressed the hCD4 transgene. As an alternative means to assess expression in phenotypic LT-HSC, LSK cells were also analyzed using the CD48 and CD150 SLAM markers: on average, 19% of CD48−CD150+ LT-HSC expressed hCD4, similar to expression seen in CD34−FLT3− LT-HSC (Fig. 1D). MFI for hCD4 expression in expressing cells for each subset is also shown (Fig. 1E). MFI was approximately twofold higher in CMP, GMP, MPP, and ST-HSC compared with CLP or LT-HSC and approximately threefold higher than mature monocytes or granulocytes.
Figure 1. Evaluation of Cebpa-hCD4 transgene expression in FACS-defined mature, progenitor, and stem cell marrow populations.
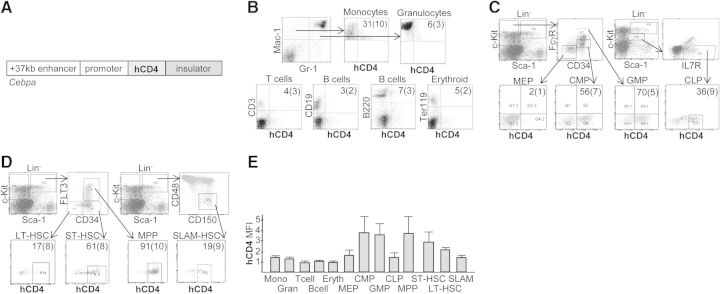
(A) Diagram of the Cebpa-hCD4 transgene. (B) Mononuclear marrow cells from transgenic Line 1 were stained for Mac-1/Gr-1, CD3, CD19, B220, or Ter119 and hCD4 and subjected to FACS analysis for indicated mature hematopoietic cell populations. Representative FACS data and the proportion of hCD4+ cells in each subset are shown (mean and sd; n=4). (C) Marrow cells were stained for hCD4, lineage markers, c-Kit, Sca-1, and CD34 and FcγR or IL-7R. Lin−Sca-1−c-Kit+ or Lin−Sca-1intc-Kitint cells were then further gated to allow assessment of hCD4 expression in indicated HPC populations (n=5). (D) Marrow cells were stained for hCD4, lineage markers, c-Kit, Sca-1, and CD34 and Flk2/FLT3 or CD150 and CD48 (SLAM markers). LSK cells were then further gated to allow assessment of hCD4 expression in indicated HPC and HSC populations (n=4). (E) The relative MFI for hCD4 expression in hCD4+ cells in the indicated marrow populations is shown, with MFI set to 1.0 for T cells. B cell data represent expression in CD19+ cells.
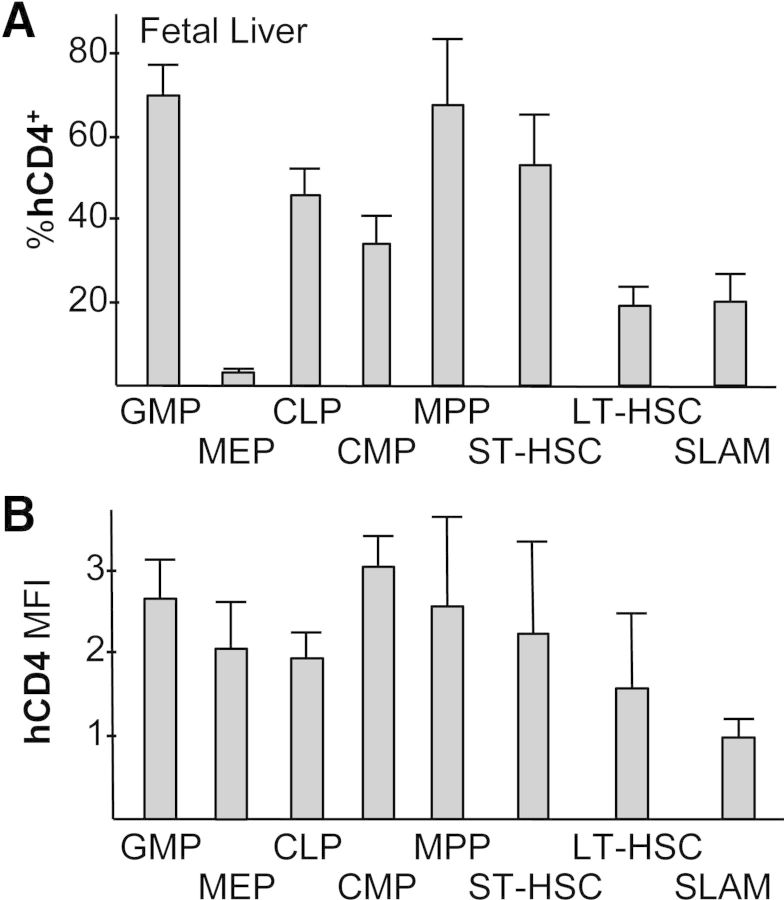
A similar expression pattern was evident in E13.5 FL HPC and HSC subsets (Fig. 2). Cebpa-hCD4 transgene expression was also similar in mature blood cells isolated from FL (n=4) versus adult marrow, with 18 ± 2% of FL Mac-1+Gr-1+ granulocytes, 42 ± 10% of FL Mac-1+Gr-1− monocytes, 0.6 ± 0.2% of FL Ter119+ erythroid cells, 3.8 ± 2.8% of FL CD19+ or 10.3 ± 3.8% of FL B220+ B cells, and 2.9 ± 1.1% of FL CD3+ T cells expressing hCD4 with MFI similar to the analogous marrow populations (not shown).
Figure 2. Evaluation of Cebpa-hCD4 transgene expression in FL hematopoietic populations.
(A) E13.5 FL cells from individual embryos were screened for hCD4 expression, and positive embryos were then evaluated for hCD4 expression by FACS as in Fig. 1. The proportion of hCD4+ cells in each subset is shown (n=4–6). (B) The relative MFI for hCD4 expression in hCD4+ cells in the indicated FL populations is shown, with MFI set to 1.0 for LSK/SLAM cells.
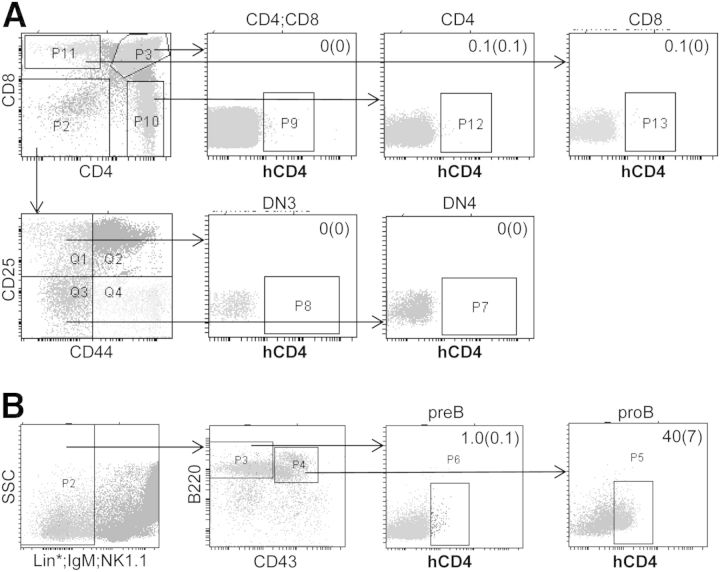
Having detected significant transgene expression in CLP but little expression in mature B or T cells, we also evaluated hCD4 expression in immature marrow B cell and thymic T cell populations (Fig. 3). No or very low transgene expression was evident in CD4+CD8+, CD4+, CD8+, CD4−CD8−CD44−CD25+ (DN3) or CD4−CD8−CD44−CD25− (DN4) thymic T cells. hCD4 expression was found in only 1.0 ± 0.1% of Lin*−IgM−NK1.1−B220+CD43− pre-B cells but was detected in 40 ± 7% of Lin*−NK1.1−IgM−B220+CD43+ pro-B cells.
Figure 3. Evaluation of Cebpa-hCD4 transgene expression in thymic T cell and marrow B cell precursors.
(A) Thymic cells from transgenic Line 1 were stained for CD4, CD8, CD25, CD44, and hCD4 and subjected to FACS analysis to identify the CD4+CD8+, CD4+, CD8+, DN3, and DN4 T cell populations. Representative FACS data and the proportion of hCD4+ cells in each subset are shown (mean and sd; n=3). (B) Marrow cells from transgenic Line 2 were stained for Gr-1, Mac-1, CD3, Ter119 (Lin*), IgM, NK1.1, B220, CD43, and hCD4 and subjected to FACS analysis to identify pre-B and pro-B cells. Representative FACS data and the proportion of hCD4+ cells in each subset are shown (mean and sd; n=3). SSC, Side-scatter.
The +37-kb Cebpa enhancer/promoter directs transgene expression preferentially to myeloid CFUs
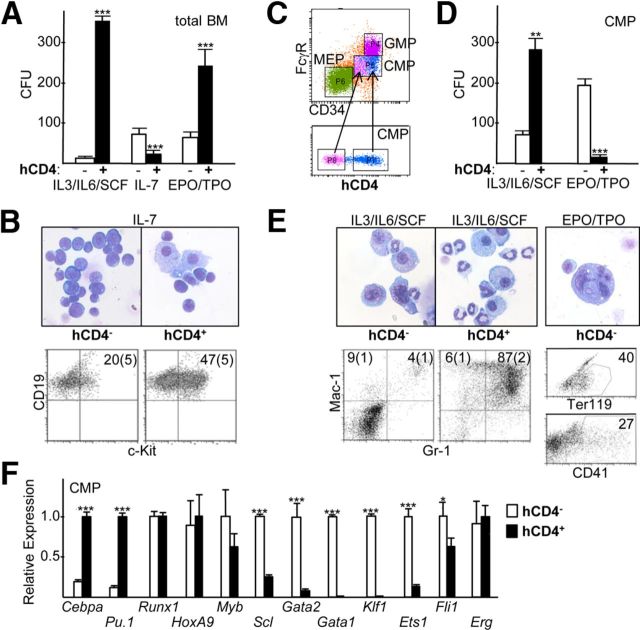
Marrow mononuclear cells from the high-expression founder line were sorted into hCD4− and hCD4+ fractions, and these were plated in methylcellulose with IL-3/IL-6/SCF to enumerate myeloid CFUs, with IL-7 to enumerate B lymphoid CFUs, and in EPO/TPO to enumerate Meg/E CFUs (Fig. 4A). Consistent with high hCD4 expression in the majority of FACS-defined GMP, >99% of myeloid CFUs were in the hCD4+ fraction.
Figure 4. Evaluation of Cebpa-hCD4 transgene expression in myeloid, B lymphoid, and Meg/E CFUs and RNA analysis of hCD4− versus hCD4+ CMP.
(A) Mononuclear marrow cells from transgenic Line 1 were sorted into hCD4− and hCD4+ populations and plated in methylcellulose with IL-3/IL-6/SCF, IL-7, or EPO/TPO. The number of myeloid CFUs obtained/1E4 cells plated and the number of B lymphoid or Meg/E CFUs obtained/2E5 cells plated are shown (mean and sd; n=3). BM, Bone marrow. (B) Morphology and CD19 and c-Kit FACS analysis of pooled CFUs obtained in IL-7 from hCD4− or hCD4+ marrow cells. (C) Marrow mononuclear cells were stained for hCD4, lineage markers, c-Kit, Sca-1, CD34, and FcγR and subjected to FACS analysis. Lin−Sca-1−c-Kit+ cells were gated to allow enumeration of CMP. These were then subdivided into hCD4low (pink) and hCD4hi (blue) subsets, which were then mapped back to the CMP population. Representative FACS data from three independent experiments are shown. (D) hCD4− and hCD4+ CMPs were sorted and plated in IL-3/IL-6/SCF or EPO/TPO, and CFUs were enumerated (n=3). (E) Morphology and Mac-1; Gr-1 FACS (n=3) of pooled CFUs obtained in IL-3/IL-6/SCF from hCD4− or hCD4+ CMP (left). Morphology and Ter119 or CD41 FACS (n=3) of pooled CFUs obtained in EPO/TPO from hCD4− or hCD4+ CMP (right). (F) RNA prepared from hCD4− or hCD4+ CMP was subjected to qRT-PCR for indicated RNAs (n=3). The average level of each RNA was set to 1.0 in the CMP subset with the higher expression. *P < 0.05, **P < 0.01, and ***P < 0.001.
In contrast, consistent with the lower hCD4 expression in FACS-defined CLP, 75% of B lymphoid CFUs were present in the hCD4− population. Moreover, two lines of evidence indicated a qualitative difference between the progenitors that gave rise to hCD4− compared with hCD4+ B lymphoid CFUs (Fig. 4B). First, the hCD4+ CFUs contained both lymphoid cells and macrophages, suggesting their origin from a less mature, bipotent B cell/macrophage progenitor [14]. Second, 47% of the CD19+ B cells in the hCD4+ CFUs express c-Kit, a progenitor marker; in contrast, c-Kit was found on only 20% of CD19+ cells present in B lymphoid CFUs derived from hCD4− transgenic marrow cells and was expressed on these cells at a lower intensity.
In contrast to the very low frequency of hCD4 expression on FACS-defined MEP, the majority of Meg/E colonies obtained in EPO/TPO derived from the total hCD4+ marrow mononuclear subset. Total marrow hCD4+ cells include hCD4+ LT-HSC, ST-HSC, and MPP, which might give rise to hCD4+ CMP that possess myeloid but lack Meg/E potential and to hCD4− CMP that lack myeloid but retain Meg/E potential. To test this idea, CMP from Cebpa-hCD4 transgenic mice were gated for hCD4 expression; interestingly, hCD4low CMP had reduced CD34 expression compared with hCD4hi CMP (Fig. 4C). In three separate mice, the MFI for CD34 in hCD4hi CMP was 2.2 ± 0.2-fold greater than the MFI for CD34 in hCD4low CMP (P<0.01). In addition, CMP were sorted into hCD4− and hCD4+ subsets and subjected to the CFU assay in the presence of IL-3/IL-6/SCF or EPO/TPO. Approximately 80% of myeloid CFUs were again in the hCD4+ CMP subset, whereas >90% of the Meg/E CFUs were now in the hCD4− CMP population (Fig. 4D). Morphologic and FACS analysis revealed qualitative differences between the myeloid cells obtained from the hCD4− versus hCD4+ subsets (Fig. 4E, left)—the hCD4+ population had increased neutrophils, more mature-appearing monocytic cells, and stained much more frequently with Mac-1 and Gr-1. CFUs, obtained in EPO/TPO from the hCD4+ CMP subset, were typically smaller and better hemoglobinized than those obtained from the hCD4− subset (not shown). Morphologic analysis of pooled Meg/E CFU cells derived from the hCD4− CMP subset confirmed the presence of small erythroblasts with condensed chromatin and larger, multinucleated megakaryocytes, and cells expressing Ter119 or the megakaryocytic marker CD41 were evident by FACS; erythroblasts predominated in CFUs derived from the hCD4+ subset, with an increased proportion of Ter119+ cells (Fig. 4E, right and not shown).
Thus, the +37-kb Cebpa enhancer/promoter directs expression to the large majority of phenotypic and functional granulocyte/monocyte myeloid progenitors. Expression is also evident in B cell/macrophage progenitors, potentially reflecting their retention of myeloid potential. In contrast, the Cebpa enhancer/promoter directs minimal expression to purely B lymphoid or Meg/E CFUs.
These data also indicate that Cebpa-hCD4 expression distinguishes CMP with myeloid compared with Meg/E potential. We therefore sorted the CMP population into hCD4− and hCD4+ subsets and analyzed these by qRT-PCR for expression of a panel of transcription factors implicated in myeloid compared with Meg/E differentiation (Fig. 4F). Cebpa and Pu.1 RNAs were preferentially expressed in hCD4+ CMP; Scl, Gata2, Gata1, Klf1, Ets1, and Fli1 were enriched in hCD4− CMP; and Runx1, Myb, HoxA9, and Erg levels were similar in both subsets.
The +37-kb Cebpa enhancer/promoter directs transgene expression to functional LT-HSC
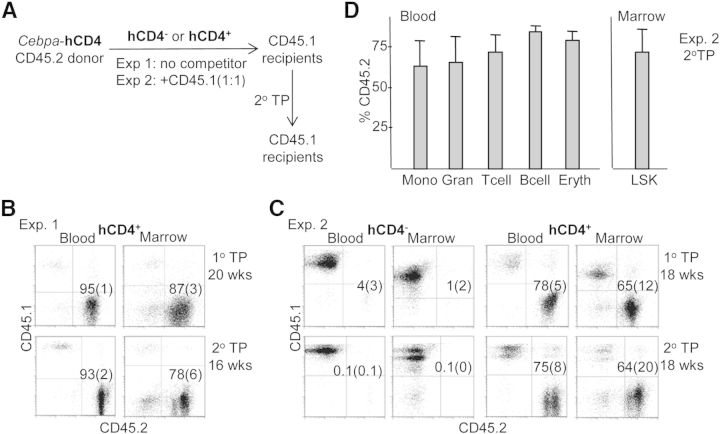
Total mononuclear marrow cells from CD45.2+ transgenic mice were sorted into hCD4− and hCD4+ populations. CD45 is a pan-hematopoietic marker, and its CD45.1 and CD45.2 alleles can be used to distinguish donor from recipient murine marrow cells. In Experiment 1, as diagrammed in Fig. 5A, 1E6 hCD4−CD45.2+ or hCD4+CD45.2+ cells from Cebpa-hCD4 transgenic mice were transplanted into each of five lethally irradiated CD45.1+ syngeneic C57BL/6 recipients. All of the mice receiving hCD4− cells died by 2 weeks of age, indicating lack of progenitors required for ST radio-protection and engraftment. In contrast, all five recipients receiving hCD4+ marrow survived. Analysis of their peripheral blood or marrow at 20 weeks demonstrated that the large majority of cells derived from the CD45.2+ donor, and this phenotype was retained 16 weeks after secondary marrow transplantation (Fig. 5B). These data indicate that functional LT-HSCs are present in the hCD4+ subset of Cebpa-hCD4 transgenic marrow cells.
Figure 5. Evaluation of Cebpa-hCD4 transgene expression in marrow LT, repopulating HSCs.
(A) Schema for Experiments 1 and 2. (B) Blood and marrow mononuclear cells, isolated 20 weeks after primary transplantation (TP; 1° TP) of 1E6 hCD4+ transgenic, CD45.2+ marrow cells into CD45.1+ recipients, were analyzed for CD45.1 and CD45.2 expression. Representative FACS data and the proportion of CD45.2 donor cells in each population are shown (upper, mean and sd; n=5). 1E6 marrow cells from four primary recipients were transplanted at Week 20 into secondary recipients. Blood and marrow mononuclear cells, isolated 16 weeks after secondary transplantation (2° TP) were analyzed for CD45.1 and CD45.2 expression (lower, n=4). (C) Blood and marrow mononuclear cells, isolated 18 weeks after primary transplantation of 2E5 hCD4− or hCD4+ transgenic, CD45.2+ marrow cells with 2E5 CD45.1+ marrow cells into CD45.1+ recipients, were analyzed for CD45.1 and CD45.2 expression (upper, n=5). 1E6 marrow cells from five primary recipients were transplanted at Week 18 into secondary recipients. Blood and marrow mononuclear cells, isolated 18 weeks after secondary transplantation were analyzed for CD45.1 and CD45.2 expression (lower, n=5). (D) Blood isolated from secondary recipients of hCD4+ donor cells in Experiment 2 was analyzed for CD45.2 expression in Mac-1+Gr-1− monocytes, Mac-1+Gr-1+ granulocytes, CD3+ T cells, CD19+ B cells, Ter119+ erythroid cells, and marrow was analyzed for CD45.2 in the LSK population (n=5).
In Experiment 2, as also diagrammed in Fig. 5A, 2E5 hCD4−CD45.2+ or hCD4+CD45.2+ cells from Cebpa-hCD4 transgenic mice were transplanted at a 1:1 ratio with 2E5 CD45.1+ marrow cells into lethally irradiated CD45.1+ recipients. Strikingly, at 18 weeks, donor hCD4+CD45.2+ cells contributed, on average, to 78% of blood or 65% of marrow cells, whereas in contrast, donor hCD4−CD45.2+ cells contributed to only 4% of blood and 1% of marrow cells. And this striking difference was retained 18 weeks after secondary transplantation (Fig. 5C). Moreover, both primary (not shown) and secondary engraftment was multilineage, with a high proportion of blood B cells, T cells, myeloid cells, and nucleated erythroid cells and also, marrow LSK cells manifesting donor CD45.2 expression (Fig. 5D).
If all of the phenotypic, FACS-defined LT-HSCs were equally capable of LT engraftment, then hCD4− or hCD4+ transgenic donor cells would have been expected to contribute equally to LT engraftment. The striking lack of contribution of hCD4− donor cells and preferential contribution of hCD4+ cells suggest that the majority of functional LT-HSCs is within the 17–19% hCD4+ subset of CD34−FLT3− or CD48−CD150+ (SLAM) LT-HSC, delineated by FACS analysis. If one assumes that the 2E5 CD45.1+ competitor cells contain 20 RU, one can use the primary transplant blood engraftment data from Experiment 2 to estimate RU (hCD4+) = 20× (% donor/100−% donor) = 70.9, and RU (hCD4−) = 0.83 (per research.jax.org/faculty/harrison/hem2_RU.html; The Jackson Laboratory, Bar Harbor, ME, USA) in the equivalent 2E5 donor cells.
The +37-kb Cebpa enhancer/promoter directs transgene expression preferentially to hematopoietic compared with nonhematopoietic lineages in two founder lines
RNAs prepared from marrow, spleen, liver, lung, adipose, heart, kidney, and muscle from wild-type mice, from the high-expression Cebpa-hCD4 transgenic Line 1, from the lower-expressing Line 2, and from nontransgenic littermates, were analyzed for hCD4 by qRT-PCR (Fig. 6A). Expression from both founder lines was marrow-specific, with hCD4 RNA levels, on average, 11-fold higher in Line 1 compared with Line 2. For Line 1, marrow expression exceeded heart by 44-fold; spleen, lung, adipose, or kidney by ∼73-fold; and liver or muscle by >100-fold. Confirming specificity of our hCD4 primers, no expression was seen in nontransgenic mice. We also evaluated genomic Cebpa-hCD4 copy number by qPCR; compared with a normal curve, established using plasmid DNA, Line 1 has nine, and Line 2 has one transgene copy/genome (not shown), accounting for the 11-fold increased hCD4 expression in Line 1 marrow cells.
Figure 6. Evaluation of Cebpa-hCD4 transgene RNA expression in nonhematopoietic tissues and in marrow subsets.
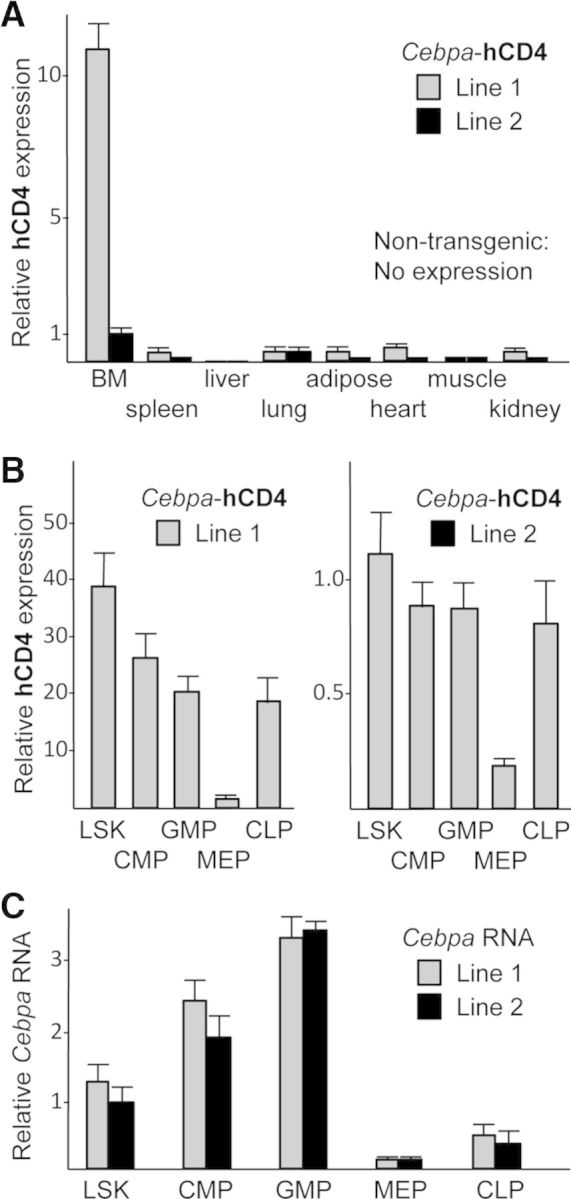
(A) Total RNA from bone marrow or from indicated tissues was assessed for hCD4 RNA expression by qRT-PCR, normalized to ribosomal protein S16 RNA expression. Relative hCD4 expression between all samples is shown (n=4 mice/line). (B) Total RNAs from indicated marrow hematopoietic subsets were analyzed similarly. Although plotted separately, relative hCD4 expression for Lines 1 and 2 samples were all compared in simultaneous analyses—note differences on ordinate scale (n=4). (C) These hematopoietic RNA samples were also analyzed for relative endogenous Cebpa RNA expression (n=4).
Marrow cells from Lines 1 and 2 were sorted into LSK, CMP, GMP, CLP, and MEP. The expression pattern of hCD4 RNA among these HPCs was similar in the two lines; consistent with the FACS and CFU analyses, expression in GMP and CLP greatly exceeded that seen in MEP (Fig. 6B). For comparison, these same RNA samples were also analyzed for endogenous Cebpa RNA expression (Fig. 6C). As seen previously [2], Cebpa RNA increases as cells progress along the LSK to CMP to GMP myeloid differentiation pathway is expressed at lower levels in CLP, and is barely detectable in MEP.
The key conclusion from this study is that the +37-kb Cebpa enhancer, linked to its cognate promoter, directs marrow-specific expression and within marrow, directs preferential expression to myeloid progenitors and LT-HSCs. Minimal transgene expression in liver, lung, and adipose suggests that the Cebpa locus contains additional enhancers, active specifically in these tissues. Indeed, we noted six additional homologous segments beyond the promoter region when comparing the human and murine genes [11].
Our findings leave open the possibility that the Cebpa gene contains additional enhancers active in hematopoietic cells besides the +37-kb locus. Genome-wide chromatin immunoprecipitation sequencing (ChIP-Seq) analysis, evaluating the hematopoietic transcription factors SCL, Lyl1, Lmo2, GATA-2, Runx1, Meis1, PU.1, Erg, Fli-1, and Gfi-1b in the HPC-7 progenitor line, demonstrated binding of the majority of these factors in the vicinity of the +37-kb enhancer and also at +35 kb [15], the latter possessing a conserved 207-bp segment. Both the +35- and +37-kb regions have conserved SCL and Ets factor cis elements, with conserved GATA and Runx1 sites present only at +37 kb.
Preferential expression of the Cebpa-hCD4 transgene in myeloid versus lymphoid or MEPs corresponds well with the expression pattern of C/EBPα and its cognate mRNA [1], as confirmed by our analysis of Cebpa RNA in GMP, MEP, and CLP. Cebpa-hCD4 expression in LT-HSC, albeit at reduced levels, is consistent with the several-fold reduced expression of Cebpa RNA in the LSK compared with the GMP marrow subsets [2], as we also confirm.
FACS-defined marrow stem or progenitor populations are often heterogeneous. Indeed, the CFU assay of isolated CMP yields 64% myeloid CFUs, 20% Meg/E CFUs, and 12% mixed CFUs [16]. The Cebpa-hCD4 transgene was expressed, on average, in 56% of marrow CMP. The division of this population into hCD4− and hCD4+ subsets allowed us to separate CMP into populations predominately committed to the Meg/E or myeloid lineages, respectively. Consistent with this heterogeneity, we noted that CD34 surface expression was increased in hCD4+ compared with hCD4− CMP, further suggesting that the hCD4+ CMP subset is enriched for cells that are differentiating toward GMP and that the hCD4− subset is differentiating toward MEP. Notably, CMPs from FL or adult marrow lacking C/EBPα specifically lack the subset with higher CD34 expression [3]. The Cebpa promoter is activated by C/EBPα [9], and the +37-kb enhancer has two consensus C/EBP-binding sites; our finding that Cebpa-hCD4+ CMPs have approximately sixfold-increased Cebpa RNA expression compared with hCD4− CMP may thereby account, at least in part, for the bias of hCD4+ CMP toward myeloid compared with erythroid colony formation. Consistent with this idea, sufficient short hairpin RNA knockdown of marrow Cebpa RNA prevents myelopoieis, while substantially increasing erythropoiesis [17].
Of note, deletion of the Runx1 alleles by polyinosinic:polycytidylic acid injection of Runx1(f/f);Mx1-Cre adult mice reduces Cebpa RNA in CMP and GMP [11]; Scl knockdown in CMP reduces formation of myeloid CFU, threefold, associated with reduced Cebpa RNA [18]; and Gata2+/− marrow has reduced GMP and fewer myeloid CFUs [19]. Yet, our RNA analysis of the hCD4− versus hCD4+ CMP subsets revealed similar expression of Runx1 in both and preferential expression of Gata2 and Scl in the hCD4− subset that predominately yielded Meg/E CFUs. These apparent discrepancies likely result from the presence of more abundant, lineage-restricted progenitors within the hCD4− and hCD4+ CMP subsets.
LT-HSCs are most stringently defined as cells capable of LT, multilineage hematopoietic engraftment. As with CMP, the FACS-defined LT-HSC population likely also includes more committed cells. The Cebpa-hCD4 transgene was expressed, on average, in only 18% of phenotypic LSK, CD34−FLT3− or LSK, SLAM LT-HSC. Yet, in competition with an equal number of recipient marrow cells, donor hCD4+ cells contributed to 78% of peripheral blood at 18 weeks, whereas hCD4− cells contribute to only 4% of peripheral blood, and this striking difference was maintained 18 weeks after secondary transplantation. These competitive transplantation data indicate that LT-HSCs are found essentially exclusively in the Cebpa-hCD4 transgene-expressing subset of phenotypic LT-HSCs. Future studies will evaluate further the ability of Cebpa-hCD4 expression, which integrates activity of bound transcription factors and external signals, to facilitate purification of myeloid-restricted CMP or functional LT-HSC.
From a translational perspective, the tracking of Cebpa enhancer/promoter activity may facilitate generation and expansion of clinically useful myeloid progenitors or LT-HSCs from adult marrow or from embryonic stem cells. In addition, as reduced C/EBPα expression or activity is a common feature of the majority of AML cases, characterizing the activity of DNA elements, such as the +37-kb enhancer, that enable Cebpa expression and ultimately, their regulation by transacting factors and external cues may allow new insights into the pathogenesis of AML and new avenues for therapeutic intervention.
Supplementary Material
ACKNOWLEDGMENTS
This work was supported by U.S. National Institutes of Health Grants U01 HL099775 and R01 HL089176 (to A.D.F.) and by the Giant Food Children's Cancer Research Fund.
The online version of this paper, found at www.jleukbio.org, includes supplemental information.
- AML
- acute myeloid leukemia
- APC
- allophycocyanin
- CLP
- common lymphoid progenitor
- CMP
- common myeloid progenitor
- EPO
- erythropoietin
- FL
- fetal liver
- Flk2
- fetal liver kinase-2
- FLT3
- FMS-like tyrosine kinase 3
- GMP
- granulocyte/monocyte progenitor
- Gr-1
- granulocyte 1
- hCD4
- human CD4
- HI-FBS
- heat-inactivated FBS
- HPC
- hemopoietic progenitor cell
- HSC
- hematopoietic stem cell
- LSK
- Lin−Sca-1+c-Kit+
- LT
- long-term
- Mac-1
- macrophage 1
- Meg/E
- megakaryocyte/erythroid
- MEP
- megakaryocyte/erythroid progenitor
- MFI
- mean fluorescence intensity
- MPP
- multipotent progenitor
- qRT-PCR
- quantitative real-time PCR
- RU
- repopulating unit(s)
- SCF
- stem cell factor
- SLAM
- signaling lymphocyte activation molecule
- ST
- short-term
- TPO
- thrombopoietin
AUTHORSHIP
H.G. and A.D.F. designed the experiments. H.G., O.M., and A.D.F. performed the experiments. H.G. and A.D.F. analyzed the data. A.D.F. wrote the paper.
DISCLOSURES
The authors declare no conflict of interest.
REFERENCES
- 1. Scott L. M., Civin C. I., Rorth P., Friedman A. D. (1992) A novel temporal pattern of three C/EBP family members in differentiating myelomonocytic cells. Blood 80, 1725–1735. [PubMed] [Google Scholar]
- 2. Iwasaki H., Mizuno S., Arinobu Y., Ozawa H., Mori Y., Shigematsu H., Takatsu K., Tenen D. G., Akashi K. (2006) The order of expression of transcription factors directs hierarchical specification of hematopoietic lineages. Genes Dev. 20, 3010–3021. [DOI] [PMC free article] [PubMed] [Google Scholar]
- 3. Zhang P., Iwasaki-Arai J., Iwasaki H., Fenyus M. L., Dayaram T., Owens B. M., Shigematsu H., Levantini E., Huettner C. S., Lekstrom-Himes J. A., Akashi K., Tenen D. G. (2004) Enhancement of hematopoietic stem cell repopulating capacity and self-renewal in the absence of the transcription factor C/EBPα. Immunity 21, 853–863. [DOI] [PubMed] [Google Scholar]
- 4. Ye M., Zhang H., Amabile G., Yang H., Staber P. B., Zhang P., Levantini E., Alberich-Jordà M., Zhang J., Kawasaki A., Tenen D. G. (2013) C/EBPα controls acquisition and maintenance of adult haematopoietic stem cell quiescence. Nat. Cell Biol. 15, 385–394. [DOI] [PMC free article] [PubMed] [Google Scholar]
- 5. Hasemann M. S., Lauridsen F. K., Waage J., Jakobsen J. S., Frank A. K., Schuster M. B., Rapin N., Bagger F. O., Hoppe P. S., Schroeder T., Porse B. T. (2014) C/EBPα is required for long-term self-renewal and lineage priming of hematopoietic stem cells and for the maintenance of epigenetic configurations in multipotent progenitors. PLoS Genet. 10, e1004079. [DOI] [PMC free article] [PubMed] [Google Scholar]
- 6. Birkenmeier E. H., Gwynn B., Howard S., Jerry J., Gordon J. I., Landschulz W. H., McKnight S. L. (1989) Tissue-specific expression, developmental regulation, and genetic mapping of the gene encoding CCAAT/enhancer binding protein. Genes Dev. 3, 1146–1156. [DOI] [PubMed] [Google Scholar]
- 7. Flodby P., Barlow C., Kyelfjord H., Ahrlund-Richter L., Xanthopoulos K. G. (1996) Increased hepatic cell proliferation and lung abnormalities in mice deficient in CCAAT/enhancer binding protein α. J. Biol. Chem. 271, 24753–24760. [DOI] [PubMed] [Google Scholar]
- 8. Paz-Priel I., Friedman A. D. (2011) C/EBPα dysregulation in AML and ALL. Crit. Rev. Oncogenesis 16, 93–102. [DOI] [PMC free article] [PubMed] [Google Scholar]
- 9. Christy R. J., Kaestner K. H., Geiman D. E., Lane M. D. (1991) CCAAT/enhancer binding protein gene promoter: binding of nuclear factors during differentiation of 3T3-L1 preadipocytes. Proc. Natl. Acad. Sci. USA 88, 2593–2597. [DOI] [PMC free article] [PubMed] [Google Scholar]
- 10. Guiu J., Shimizu R., D'Altri T., Fraser S. T., Hatakeyama J., Bresnick E. H., Kageyama R., Dzierzak E., Yamamoto M., Espinosa L., Bigas A. (2013) Hes repressors are essential regulators of hematopoietic stem cell development downstream of Notch signaling. J. Exp. Med. 210, 71–84. [DOI] [PMC free article] [PubMed] [Google Scholar]
- 11. Guo H., Ma O., Speck N. A., Friedman A. D. (2012) Runx1 deletion or dominant inhibition reduces Cebpa transcription via conserved promoter and distal enhancer sites to favor monopoiesis over granulopoiesis. Blood 119, 4408–4418. [DOI] [PMC free article] [PubMed] [Google Scholar]
- 12. Giraldo P., Rival-Gervier S., Houdebine L. M., Montoliu L. (2003) The potential benefits of insulators on heterologous constructs in transgenic animals. Transgenic Res. 12, 751–755. [DOI] [PubMed] [Google Scholar]
- 13. Ogilvy S., Metcalf D., Gibson L., Bath M. L., Harris A. W., Adams J. M. (1999) Promoter elements of vav drive transgene expression in vivo throughout the hematopoietic compartment. Blood 94, 1855–1863. [PubMed] [Google Scholar]
- 14. Montecino-Rodriguez E., Dorshkind K. (2002) Identification of B/macrophage progenitors in adult bone marrow. Semin. Immunol. 14, 371–376. [DOI] [PubMed] [Google Scholar]
- 15. Wilson N. K., Foster S. D., Wang X., Knezevic K., Schütte J., Kaimakis P., Chilarska P. M., Kinston S., Ouwehand W. H., Dzierzak E., Pimanda J. E., de Bruijn M. F., Göttgens B. (2010) Combinatorial transcriptional control in blood stem/progenitor cells: genome-wide analysis of ten major transcriptional regulators. Cell. Stem Cell 7, 532–544. [DOI] [PubMed] [Google Scholar]
- 16. Akashi K., Traver D., Miyamoto T., Weissman I. L. (2000) A clonogenic common myeloid progenitor that gives rise to all myeloid lineages. Nature 404, 193–197. [DOI] [PubMed] [Google Scholar]
- 17. Ma O., Hong S. H., Guo H., Ghiaur G., Friedman A. D. (2014) Granulopoiesis requires increased C/EBPα compared to monopoiesis, correlated with elevated Cebpa in immature G-CSF receptor versus M-CSF receptor expressing cells. PLoS One 9, e95784. [DOI] [PMC free article] [PubMed] [Google Scholar]
- 18. Brunet de la Grange P., Zink E., Armstrong F., Rouyez M. C., Pflumio F. (2008) Impairment of granulo-monocytic development of human common myeloid progenitors but not of granulo-monocytic progenitors by decreasing stem cell leukemia/T-cell acute leukemia 1 expression. Stem Cells 26, 1658–1662. [DOI] [PubMed] [Google Scholar]
- 19. Rodrigues N. P., Boyd A. S., Fugazza C., May G. E., Guo Y., Tipping A. J., Scadden D. T., Vyas P., Enver T. (2008) GATA-2 regulates granulocyte-macrophage progenitor cell function. Blood 112, 4862–4873. [DOI] [PubMed] [Google Scholar]
Associated Data
This section collects any data citations, data availability statements, or supplementary materials included in this article.


