

Abstract
Purpose
Meibomian gland dysfunction (MGD) is a common clinical problem that is often associated with evaporative dry eye disease. Alterations of the lipids of the meibomian glands have been identified in several studies of MGD. This prospective, observational, open label clinical trial documents the improvement in both clinical signs and symptoms of disease as well as spectroscopic characteristics of the meibomian gland lipids after therapy with topical azithromycin ophthalmic solution and oral doxycycline treatment.
Methods
Subjects with symptomatic MGD were recruited. Signs of MGD were evaluated with a slit lamp. Symptoms of MGD were measured by the response of subjects to a questionnaire. Meibum lipid-lipid interaction strength, conformation and phase transition parameters, and meibum protein content were measured using Fourier transform infrared spectroscopy (FTIR) and principal component analysis (PCA). Terpenoids, short chain CH3 moieties, lipid oxidation, wax, cholesterylesters and glycerides were measured with a proton nuclear magnetic resonance (1H-NMR) spectrometer.
Results
Topical therapy with azithromycin and oral therapy with doxycycline relieved signs and symptoms and restored the lipid properties of the meibomian gland secretion towards normal. Compared to 4 weeks of azithromycin treatment reported in our previous study, oral doxycycline treatment was slightly less effective in improving foreign body sensation and the signs of plugging and secretion. In subjects with clinical evidence of MGD, changes in ordering of the lipids and phase transition temperature were brought closer to normal with azithromycin treatment than doxycycline treatment. Treatment with doxycycline but not azithromycin restored the FTIR PCA scores and relative area of the 1H-NMR resonance at 1.26 ppm. Both doxycycline and azithromycin treatment restored the levels of the relative areas of the 1H-NMR resonances at 5.2 and 7.9 ppm to normal levels. The level of meibum protein and meibum lipid oxidation were not influenced by azithromycin or doxycycline treatment.
Conclusions
The mechanism of action of doxycycline may be different than that of azithromycin in therapy of MGD. It is notable that when carotenoids in meibum are low, as in MGD, the tear film is unstable and patients have the signs and symptoms of dry eye. When carotenoids are restored with azithromycin and doxycycline treatment, tear film stability is restored and patients no longer have the signs and symptoms of dry eye.
Keywords: meibomian gland dysfunction, meibum lipids, azithromycin, doxycycline
INTRODUCTION
Meibomian gland dysfunction (MGD) is a common clinical problem responsible for symptoms and signs of eyelid irritation and is frequently a cause of evaporative dry eye.1,2 Spectroscopic3–14 and other approachs15–20 have been used to characterize alterations of the lipids of the meibomian glands with advancing age and disease.2,21 The identified changes in the lipids help to explain some of the abnormalities of tear film function in evaporative dry eye.22–24
Conventional therapy of MGD includes mechanical options of lid massage and lid expression as well as medicinal therapy of systemic tetracycline and doxycycline.25 Oral azithromycin therapy improved the signs and symptoms associated with dry eye.26 The use of azithromycin in DuraSite for the treatment of blepharitis has recently been reviewed.27 Clinical trials have identified topical azithromycin as a potentially effective and well tolerated therapy of lid margin disease and meibomian gland dysfunction.28,29 Azithromycin is antiinflammatory30,31 inhibiting proinflammatory cytokines, and is a potent against gram-negative microorgansims.32,33 It is believed to penetrate into the ocular surface where it remains at therapeutic levels days after the therapy has stopped.34
Doxycycline is antimicrobial and inhibits matrix metalloproteinases that degrade connective tissue.35 It has been used to treat ocular rosacea, improving irritation symptoms and increasing tear film stability.36–38 It has also been used to treat corneal erosions.39–41
We have recently found that azithromycin in DuraSite abrogated the signs and symptoms of dry eye in patients with MGD and restored some of the biophysical characteristics of the meibum.42 In this pilot study we further characterized human meibum before and after treatment with topical azithromycin/DuraSite and oral administration of doxycycline. The meibum was characterized using Fourier transform infrared (FTIR) spectroscopy and proton nuclear magnetic resonance (1H-NMR) spectroscopy. Infrared spectra were analyzed using principal component analysis (PCA). The prospective, observational, open-label clinical trial described in this report compared both the clinical signs and symptoms of meibomian gland dysfunction as well as the spectroscopically analyzed alterations in lipid behavior of the meibomian gland secretion in a group of subjects with symptomatic MGD unresponsive to lid massage and hygiene before and after therapy with topical azithromycin ophthalmic solution and oral administration of doxycycline.
MATERIALS AND METHODS
Subjects
Twenty two subjects for the azithromycin study and 9 subjects for the doxycycline study were diagnosed with symptomatic MGD that was unresponsive to lid massage following application of a hot compress to the eyelid and were recruited to the clinical trial. Written informed consent was obtained from all donors. All protocols and procedures were reviewed by the Institutional Review Boards of the University of Louisville and the Louisville Veterans Administration Hospital and procedures were in accord with the Declaration of Helsinki. Subject demographics are summarized in Table I. Subject inclusion criteria were the presence of symptomatic MGD in subjects between ages 18 and 90 years of age who were not taking systemic nor topical antibiotics nor using topical anti-inflammatory medications. Exclusion criteria were the history of allergy to azithromycin, altered lid anatomy (with the exception of meibomian gland dysfunction), or inability to comprehend the informed consent or complete the requested therapy and follow-up. All subjects underwent a complete examination of the eyelids and anterior segment of the eye including measurement of intraocular pressure prior to entry into the study. The same grading scale for evaluation of symptoms and signs was used in each study to assure comparability of severity and outcome. Symptoms were measured on a four point categorical scale of none, mild, moderate, or severe according to the subject’s response to questions regarding itching, burning, foreign body sensation, eyelid redness, and eyelid swelling (Table II). Signs were evaluated with slit lamp- observed conjunctival injection, fluorescein tear breakup time, ocular surface staining with fluorescein, and evaluation of the eyelid margin and character of meibomian gland orifices and secretion (Table III). Some signs were graded on a four point categorical scale as summarized in Table III. The sign, tear breakup time, was measured in seconds following a complete blink after instillation of 5 µl of topical 1% fluorescein solution.
Table I.
Subject demographics
| Azithromycin Study |
| N=22 |
| Age: 64 years mean (± 3 yr) [range 33 – 83 years] |
| Sex: 12 male 10 female |
| Race: 20 caucasian 1 african-american 1 asian |
| Doxycycline Study |
| N=9 |
| Age: 68 years mean (± 12 yr) [range45 – 87 years] |
| Sex: All male |
| Race: All caucasian |
Table II.
Grading of clinical symptoms
| Symptom | Grade 0 | Grade 1 | Grade 2 | Grade 3 |
|---|---|---|---|---|
| Itching | none | awareness | desire to rub | frequent rub |
| FBS | none | awareness | desire to rub | desire to close lid |
| Dryness | none | awareness | need for drop | frequent drops |
| Burning | none | awareness | need to rub | frequent rub |
| Swelling | none | noticeable | obvious | decrease in aperture |
Table III.
Grading of clinical signs
| Sign | Grade 0 | Grade 1 | Grade 2 | Grade 3 |
|---|---|---|---|---|
| Conjunctival redness | none | pink | light red | bright red |
| Lid margin debris | none | 1–5 crusts | 6–10 crusts | >10 crusts |
| Lid margin redness | none | pink | light red | bright red |
| MG expression | touch | light pressure | moderate pressure | occluded |
| MG secretion | clear | turbid | turbid with clumps | solid paste |
| MG plugging | Number of plugged orifices within the central 10 glands of lower lid | |||
| TBUT | Number of seconds to first breakup following complete blink | |||
Materials
Silver chloride windows for infrared spectroscopy were obtained from Crystran Limited, Poole, United Kingdom. All chemicals were purchased from Sigma-Aldrich Chemical Co., St. Louis MO. Azithromycin was obtained from Inspire Pharmaceuticals, Inc., Raleigh NC, now part of Merck and Co. Inc., Whitehouse Station, NJ. Doxycycline hyclate 100 mg tablets were purchased from IVAX Corporation, Miami, FL.
Collection of Tear Lipids
Meibum lipid (ML) was obtained from thirty-one subjects as described in Kilp et al., 1986,43 except that meibomian gland excreta were collected with a platinum spatula. Lid expression was performed with cotton tipped applicators following instillation of topical proparacaine. All four eyelids were expressed and about 1 mg of meibum was collected per individual for direct spectroscopic study. The expressate was collected with a platinum spatula and immediately spread onto the AgCl window and into 0.5 mL of tetrahydrofuran/methanol, 3:1, v:v (THF/MeOH) in a 9-mm micro vial with a Teflon cap (Microliter Analytical Supplies Ind., Suwanee, Georgia). All samples were frozen under argon gas until analysis. Analyses were performed within three weeks of collection of the sample. Storage of the sample on AgCl windows for over two months under argon did not affect the sample.23 Prior to NMR analysis, the THF/MeOH in the micro vial containing ML rinsed from the spatula was evaporated with a stream of argon gas. Sampling of the expressed meibum was done at 0, 2 and 4 weeks of azithromycin therapy, and 0, 4 and 8 weeks after oral doxycycline therapy, and 1 month following cessation of therapy. Subjects were instructed not to instill medication for at least eight hours prior to collection of lipid secretions.
Fourier Transform Infrared Spectroscopy
Infrared spectra were measured using a Nicolet 5000 Magna Series Fourier transform infrared spectrometer (Thermo Fisher Scientific, Inc., Waltham MA). The ML was placed on the AgCl window and placed in a temperature-controlled infrared cell holder. The cell was jacketed by an insulated water coil connected to a Neslab R-134A (NESLAB Instruments, Newton NH) circulating water bath. The sample temperature was measured and controlled by a thermistor touching the sample cell window. The water bath unit was programmed to measure the temperature at the thermistor and to adjust the bath temperature so the sample temperature was adjusted to the desired set point. The rate of heating or cooling (1°C/15 min) at the sample was also adjusted by the water bath unit. Temperatures were maintained within ± 0.01°C. One-hundred and fifty interferograms were recorded and averaged. Spectral resolution was set to 1.0 cm−1.
Infrared data analysis was performed with GRAMS/386 software (Galactic Industries, Salem, NH). The frequency of the CH2 band near 2850 cm−1 was used to estimate the content of trans and gauche rotomers in the hydrocarbon chains. The ν̃sym was calculated by first baseline leveling the OH-CH stretching region near 3,500 and 2,700 cm−1. The center of mass of the CH2 symmetric stretching band was calculated by integrating the top 10 % of the intensity of the band. The baseline for integrating the top 10% of the intensity of the band was parallel to the OH-CH region baseline.
Lipid CH2 groups in the hydrocarbon chains are present as gauche rotomers, prevalent in disordered hydrocarbon chains, or trans rotomers, more abundant in ordered hydrocarbon chains. Thus, lipid hydrocarbon chain order may be evaluated in terms of the amount of CH2 trans rotomers.42,52 The frequency of the CH2 symmetric stretch, ν̃sym, is dependent on the amount of trans or gauche rotomers12 and has been used to characterize lipid phase transitions3,5.9.14.44–51 to measure the trans rotomer content of lipid hydrocarbon chains with changes in temperature.3,5,9,14,44–46,52 Since rotomers are either trans or gauche, phase transitions can be described by a two-state sigmoidal equation, as reported by Borchman et al.3 Lipid order at 33.4°C was calculated by extrapolating the ν̃sym at 33.4°C from the fit of the phase transition and then converting ν̃sym to the % of trans rotomers, a measure of lipid conformational order (see Borchman et al.3). The % trans rotomer data were used to calculate the phase transition enthalpy and entropy from the slopes of Arrhenius plots as described previously.3 Arrhenius plots from tear-lipid phase transitions were linear with correlation coefficients greater than 0.998.
Principal component analysis
Principal component and infrared data analysis were performed with GRAMS/386 software (Galactic Industries, Salem, NH). PCA analyzes the variations among spectra called a training set.7,8,13 PCA finds the variations that appear to be synchronized proportionally and extracts them to produce eigenvectors that often look like infrared spectra. Eigenvectors also called loading spectra or factors represent a component that changes in concentration from sample to sample. The training sets may be eventually used to model how the eigenvectors relate to a component such as age or disease. A training set of infrared spectra of meibum from donors with MGD (Md) and meibum from normal donors (Mn) were used as reported.8 For each spectrum, two constituents were used, age and ‘meibomian gland dysfunction /normal score’. The training set was set up by assigning Mn spectra a ‘meibomian gland dysfunction /normal score’ of 0 and Md spectra a ‘meibomian gland dysfunction /normal score’ of 100. The training set encompassed the CH and OH stretching region from 3612 to 2490 cm−1 and the fingerprint region from 1814 to 676 cm−1. The total number of spectra used in the training set was 73, 41 corresponding to Md and 32 to Mn.
Processing samples for NMR analysis
After infrared analysis and solvent evaporation, ML was removed from the AgCl window using a series of solvents with different hydrophobicities to ensure that all lipid classes were extracted from the AgCl window. First, the AgCl window was placed with the ML side down,into a 15-mL glass scintillation vial containing 1 mL of hexane and purged with argon gas. A glass vial rather than a plastic one was used in all protocols to avoid plasticizer contamination. The vial was sonicated in an ultrasonic bath (Branson 1510, Branson Ultrasonics, Danbury, CT) for 10 min. The hexane was decanted into the micro-vial containing the ML rinsed from the spatula. The hexane was evaporated under a stream of nitrogen gas. Methanol (1.5 mL) was then added to the scintillation vial containing the AgCl window and purged with argon gas. The vial was sonicated in an ultrasonic bath (Branson Ultrasonics, Danbury, CT) for 10 min. The methanol was decanted into the micro-vial containing the ML rinsed from the spatula and was evaporated under a stream of nitrogen gas. THF/MeOH (1.5 mL) was added to the scintillation vial containing the AgCl window and purged with argon gas. The vial was sonicated in an ultrasonic bath (Branson Ultrasonics, Danbury, CT) for 10 min. The micro vial containing the extracted meibum lipid was lyophilized for 12 hours to remove trace amounts of organic solvents. Finally, deuterated cyclohexane (0.5 mL) was added to the sample and sonicated (Branson Ultrasonics, Danbury, CT) for 10 minutes in a bath sonicator. The solution was transferred to glass NMR tubes (Sigma Chemical Co, St Louis MO) and NMR spectra were collected.
NMR Spectral Measurement
Spectral data were acquired (Inova-500 spectrometer; Varian, Lexington, MA). The following parameters were used: eight hundred scans were acquired with a spectral width of 15 ppm, 60° pulse, 4-K data points, 1.0-second delay time, and 2.049-second acquisition time at 25°C. A computer running commercial software (GRAMS 386; Galactic Industries Corp., Salem, NH) was used for phasing and integrating.
Treatment protocol
Azithromycin
Subjects were provided 1% topical azithromycin ophthalmic solution (Azasitetm, Inspire Pharmaceuticals, Inc, Raleigh, NC) with instructions to use one drop twice daily for two days then once daily for the four week duration of the treatment phase of the study. Subjects were instructed not to instill medication the morning of examinations.
Doxycycline
Oral doxycycline hyclate (100 mg) was taken twice a day for two months of therapy.
Statistics
Data are presented as the average ± the standard error of the mean. Statistical significance was determined using Student’s t-test. Values of p < 0.05 were considered statistically significant.
RESULTS
Clinical
Our clinical results for the azithromycin study have been reported.42 All nine of the subjects enrolled in the doxycycline study completed eight weeks of therapy. Subject-reported global response to therapy demonstrated observable improvement at four weeks but greater response at eight weeks of therapy as depicted in Table IV. All subjects described relief or absence of symptoms at four weeks of therapy.
Table IV.
Global Response to Therapy
| Global Clinical Results | ||
|---|---|---|
| azithromycin | dcn | |
| Enrolled pts | 27 | 7 |
| Completed Rx | 23 | 4 |
| Intolerant of Rx | ||
| Stinging | 2 | |
| Nausea | 2 | |
| Lost to f/u | 1 | 1 |
| Global response (subject assessment, eyes): | ||
| Resolved | 10 | 2 |
| Improved | 31 | 4 |
| No change | 2 | 2 |
| p< 0.001 | ||
Symptom improvement, as measured by mean score of severity, decreased for itching and swelling by a statistically significant amount (p < 0.05) at eight weeks of treatment. After eight weeks of treatment as shown in Figure 1A, all of the subjects reported no burning symptoms. The reason that the results are not statistically significant in Figure 1 is that only three of eight subjects reported burning at the start of the study.
Figure 1.
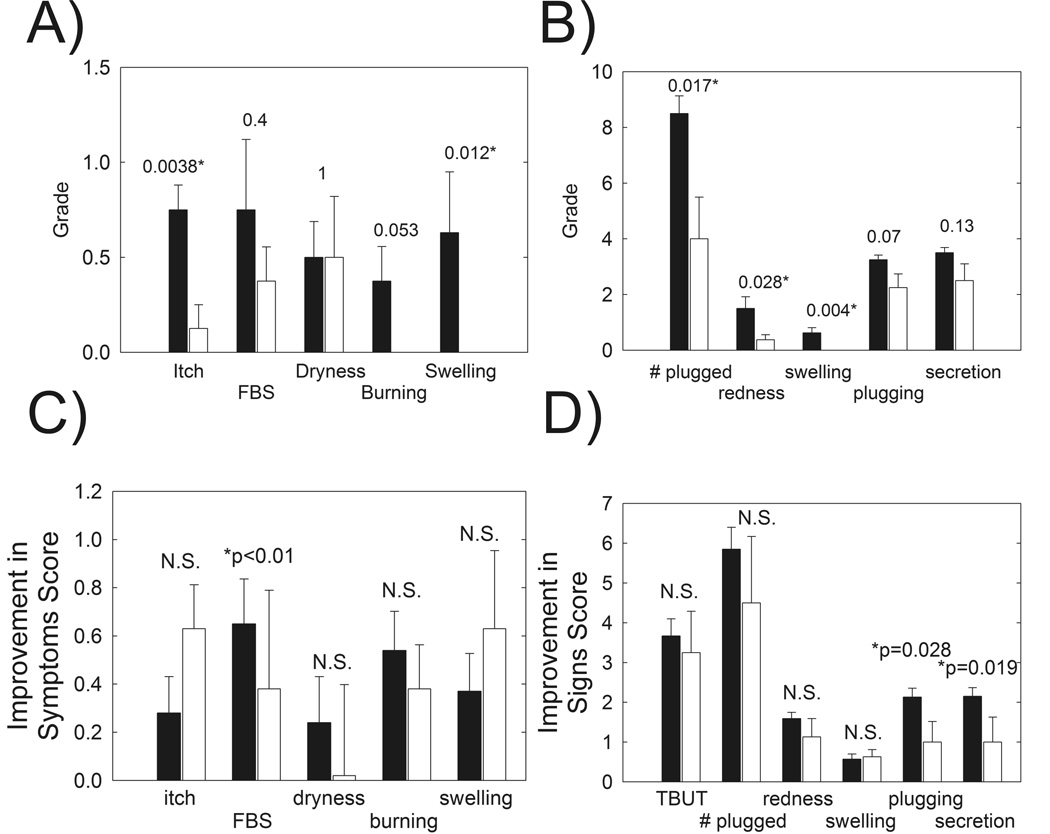
A) Patients with MGD reported global improvement in symptoms in response to 8 weeks of oral doxycycline therapy. FBS: foreign body sensation, NS: not statistically significant (p > 0.05). Filled bars: Subjects with MGD prior to treatment. Open bars: Patients after 8 weeks of doxycycline treatment. B) Signs of MGD were improved in patients with MGD in response to 8 weeks of oral doxycycline therapy. Symptoms were assessed from a questionnaire. C) Improvement in symptoms after 8 weeks of doxycycline therapy, open bars, compared with published42 improvement in symptoms after 4 weeks topical azithromycin therapy (filled bars). D) Improvement in signs after 8 weeks of doxycycline therapy, open bars, compared with published42 improvement in signs after 4 weeks topical azithromycin therapy (filled bars). * Statistically significant difference, p < 0.05.
All signs of eyelid margin disease improved at four weeks with # plugged, redness and swelling being statistically significant (p < 0.05) (Figure 1B). Improvement in tear breakup time was highly statistically significant at eight weeks of therapy (p < 0.001) (Figure 2).
Figure 2.
Tear breakup time increased significantly after 8 weeks of oral doxycycline treatment (open bars) compared to patients with MGD prior to treatment (filled bars).
Infrared Spectroscopic analysis of meibum
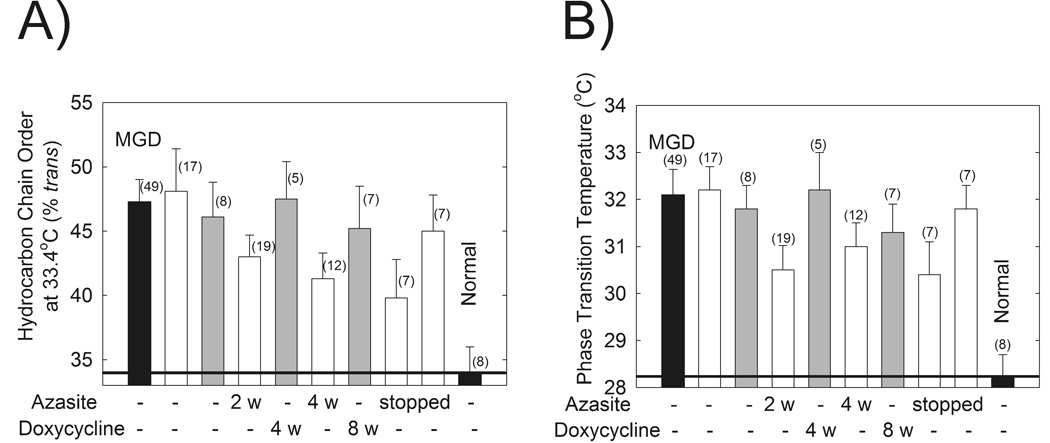
Meibum phase transition parameters were measured using FTIR and are summarized in Table V. The phase transition temperature and lipid order at 33.4°C MLwere significantly different for Md compared with Mn as reported (p < 0.01, Fig. 3A).42 The phase transition temperature and degree of lipid ordering from the enrolled subjects were comparable to data from a larger group of subjects with MGD obtained in a separate study (Fig. 3).42 No significant differences were detected in any of the phase transition parameters of subjects treated with doxycycline (Table V, Fig. 3).
Table V.
Phase Transition Parameters For Doxycycline Study
| Phase transition Parameter |
MGD* | Enrolled Treatment Time (weeks) |
Enrolled Post Treatment time (weeks) |
Normal | ||
|---|---|---|---|---|---|---|
| (0) | (4) | (8) | (4) | |||
| Minimum Frequency (cm−1) | 2849.68 ± 0.06 | 2849.8 ± 0.1 | 2849.6 ± 0.1 | 2849.7 ± 0.1 | 2849.6 ± 0.1 | 2849.9 ± 0.1 |
| Maximum Frequency (cm−1) | 2853.48 ± 0.07 | 2853.4 ± 0.1 | 2853.5 ± 0.1 | 2853.3 ± 0.2 | 2853.2 ± 0.2 | 2853.5 ± 0.1 |
| Cooperativity | −8.5 ± 0.4 | −9.0 ± 0.4 | −9.7 ± 0.9 | −9.5 ± 0.8 | −8.0 ± 0.8 | −9.2 ± 0.4 |
| Phase transition Temperature (°C) | 32.2 ± 0.5 | 31.8 ± 0.5 | 32.2 ± 0.8 | 31.3 ± 0.6 | 33.0 ± 0.5 | 28.5 ± 0.5 |
| Enthalpy (Kcal/mol) | 157 ± 7 | 143 ± 11 | 158 ± 27 | 159 ± 17 | 127 ± 4 | 149 ± 7 |
| Entropy (Kcal/mol/degree) | 0.51 ± 0.02 | 0.47 ± 0.04 | 0.52 ± 0.09 | 0.52 ± 0.06 | 0.41 ± 0.01 | 0.50 ± 0.08 |
| Order (%) at 33.4°C | 47 ± 2 | 46 ± 3 | 47 ± 3 | 45 ± 3 | 52.7 ± 0.9 | 36 ± 2 |
| Number of samples | 49 | 8 | 6 | 7 | 1 | 9 |
MGD is meibomian gland dysfunction. MGD and normal have been reported.42
Figure 3.
Data from the FTIR spectra of human meibum. Open bars: data are from a published azithromycin study.42 Filled bars: data from a larger study.42 A) Hydrocarbon order of Mn and Md at 33.4°C was not statistically different in patients after 8 weeks of oral doxycycline therapy (gray bars) and 1 month after treatment was stopped. More order indicates stiffer lipids with stronger lipid-lipid interactions. B) The phase transition temperatures of Md and Mn were not statistically different in patients after 8 weeks of oral doxycycline therapy (gray bars) and 1 month after treatment was stopped.
The phase transition parameters measured above utilize only 0.1% of the spectra of human meibum. Principal Component analysis was used to analyze the remaining regions encompassing the CH and OH stretching region from 3612 to 2490 cm−1 and the fingerprint region from 1814 to 676 cm−1. Based on a training set of 77 infrared spectra from Md and Mn,8 scores were assigned to the spectra. A score higher than 59 indicates that the infrared spectra is similar to the spectra of Md. A score lower than 59 indicates that the infrared spectra are similar to the spectra of Mn.8 All of the scores from the enrolled subjects were significantly (p < 0.05) lower than those from the pool of 41 patients with MGD used in the training set except for the samples collected one month after azithromycin was stopped (Fig. 4). The average score was in the normal range for the samples collected two weeks after azithromycin treatment was stopped and after 8 weeks of doxycycline treatment (Fig. 4). The average scores for the treated samples never reached the levels of 36 donors that never had dry eye symptoms (Fig. 4).
Figure 4.

Data from the FTIR spectra of human meibum. Gray bars: azythromycin study. Filled bars: data is from a larger published study.42 * statistically significant difference p < 0.05. Principal Component analysis was used to analyze the CH and OH stretching region from 3612 to 2490 cm−1 and the fingerprint region from 1814 to 676 cm−1. Based on a training set of 77 infrared spectra from Md and Mn,8 scores were assigned to the spectra. A score higher than 59 indicates that the infrared spectra is similar to the spectra of Md. A score lower than 59 indicates that the infrared spectra are similar to the spectra of Mn.8
Measurement of the areas of the infrared amide I and II bands and the infrared carbonyl band due to lipids showed that protein levels were significantly higher in Md compared with Mn.8 Neither doxycycline treatment or azithromycin treatment affected the amount of protein (Fig. 5).
Figure 5.

Data from the FTIR spectra of human meibum. Gray bars: azythromycin study. Filled bars: data is from a larger published study.8 * Statistically significant difference, p < 0.05.
MGD: meibomian gland dysfunction.
1H-NMR analysis of meibum
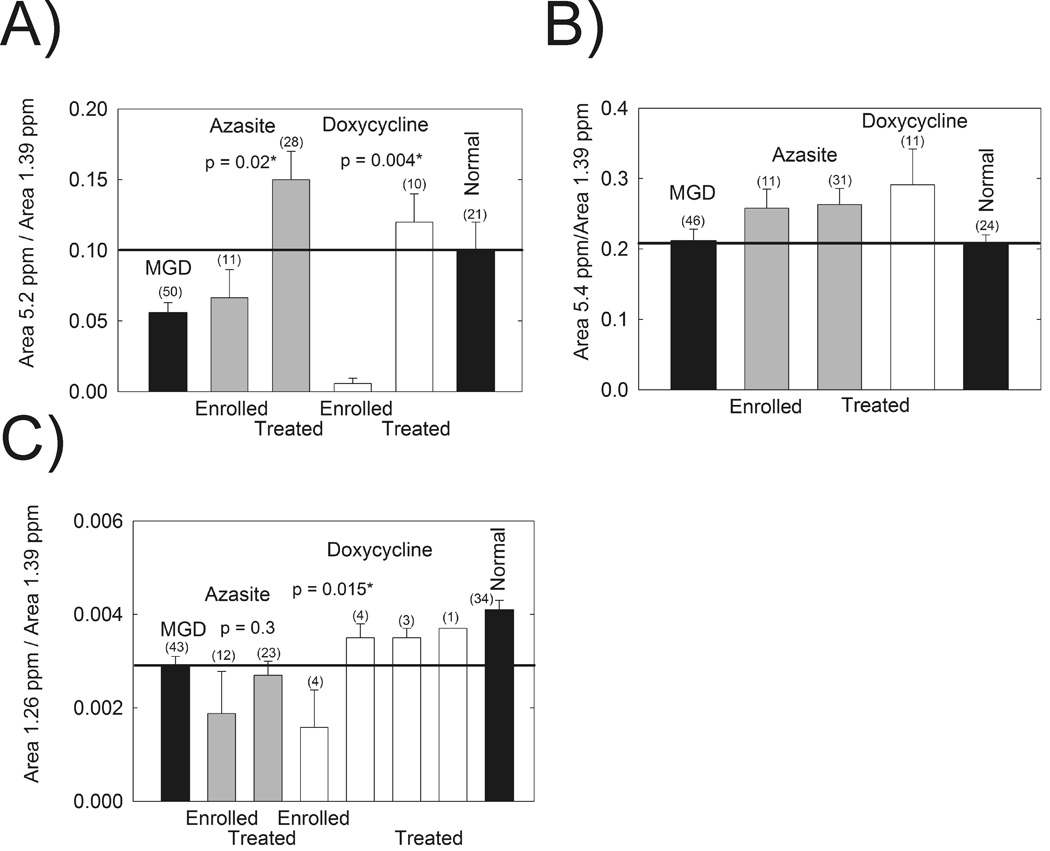
NMR analysis of meibum showed that the relative intensity of the band at 5.2 ppm assigned to protons associated with terpenoid double bonds was restored to normal levels after treatment with both doxycycline, and azithromycin (Fig. 6A).12,13 The resonances due to double bonds in general at 5.4 ppm (Fig. 6B) did not change with doxycycline or azithromycin treatment.12,13 The resonance at 1.26 ppm has been tentatively assigned to –CH3 protons attached with short chain hydrocarbons.12,13 The relative area of this resonance has been shown to be statistically lower in Md compared with Mn.12,13 Doxycycline treatment restored the average relative area of the 1.26 ppm resonance to normal levels (Fig. 6C).
Figure 6.

Data from 1H-NMR spectra of human meibum. Gray bars: azythromycin study. Filled bars: data are from a larger published study (labled MGD and Normal).12,13 Open bars: doxycycline study(labled DCN). A) The resonance at 5.2 ppm has been tentatively assigned to terpenoids.12,13 B) The resonance at 5.4 is assigned to unconjugated =CH protons. C) The resonance at 1.26 ppm has been tentatively assigned to short chain CH3 moieties.12,13 *Statistically significant difference, p < 0.05.
The amount of wax was not statistically different for any of the samples measured (p > 0.05) except for the doxycycline-treated samples whose wax levels were about twice as large as Mn (Table 6). The ratio of cholesterylester to wax was significantly lower for Md compared with Mn as previously reported11 and the doxycycline treated samples compared with Md (Table 6). The ratio of glycerides to wax was not statistically different for any of the samples measured (p > 0.05, Table 6).
Table VI.
Meibum Lipid Composition
| Sample Pool | Resonance Area ratio Wax ester/CH2 |
Resonance Area ratio Cholesterylester/Wax |
Resonance Area ratio Glycerides/Wax |
|---|---|---|---|
| Normal (Mn)a | 0.026 ± 0.003, n = 32 | 0.28 ± 0.04, n = 26 | 0.37 ± 0.06, n = 40 |
| MGD enrolled | 0.021 ± 0.005, n = 10 | 0.21 ± 0.07, n = 12 | 0.45 ± 0.10, n = 12 |
| MGD (Md)a | 0.026 ± 0.003, n = 39 | 0.17 ± 0.02, n = 47 | 0.39 ± 0.04, n = 46 |
| MGD treated 2 to 4 weeks with azithromycin | 0.032 ± 0.011, n = 22 | 0.10 ± 0.028, n = 23 | 0.62 ± 0.07, n = 23 |
| MGD 2 to 4 weeks After treatment with azithromycin was stopped | 0.011 ± 0.016, n = 8 | 0.19 ± 0.08, n = 7 | 0.52 ± 0.09, n = 7 |
| MGD treated 4 to 8 weeks with Doxycycline | 0.053 ± 0.013, n = 11 | 0.05 ± 0.02, n = 10 | 0.45 ± 0.069, n = 11 |
| Normal vs MGD (p) | 0.97 | 0.0098* | 0.078 |
| Doxycycline treated vs MGD (p) | 0.004* | 0.012* | 0.53 |
Previously reported.11
Statistically significant, p < 0.05.
The resonances with chemical shifts above 7 ppm has been assigned to products of lipid oxidation.13 The sum of the area of all of the resonances above 7 was not statistically significant for any of the samples.
The resonance at 7.9 ppm has been assigned to lipid hydroperoxides12,13 and was relatively small, only 0.0046 of the area of the CH2 resonance at 1.39 ppm (Table 7). The 7.9 ppm resonace was statistically higher for the azithromycin and doxycycline treated samples compared with Md (Table 7).
Table VII.
Meibum Lipid Oxidation
| Sample Pool | Resonance Area ratio 7.9 ppm/CH2 |
Resonance Area ratio Above 7 ppm/CH2 |
|---|---|---|
| Normala | 0.0097 ± 0.0016, n = 26 | 0.107 ± 0.011, n = 37 |
| MGD enrolled | 0.0046 ± 0.001, n = 12 | 0.042 ± 0.019, n = 12 |
| MGDb | 0.0066 ± 0.00044, n = 48 | 0.039 ± 0.0065, n = 51 |
| MGD treated 2 to 4 weeks with azithromycin | 0.020 ± 0.0046, n = 24 | 0.024 ± 0.0047, n = 23 |
| MGD 2 to 4 weeks after treatment with azithromycin was stopped | 0.011 ± 0.002, n = 8 | 0.026 ± 0.007, n = 8 |
| MGD treated 4 to 8 weeks with doxycycline | 0.040 ± 0.011, n = 9 | 0.051 ± 0.014, n = 9 |
| Normal vs MGD (p) | 0.021* | 0.001* |
| Doxycycline treated vs MGD (p) | < 0.0001* | 0.47 |
| Azithromycin treated vs MGD (p) | < 0.0001* | 0.15 |
Previously reported.13
Statistically significant, p < 0.05.
DISCUSSION
The major finding of this study is that like topical azithromycin treatment,42 oral treatment with doxycycline improved the signs and symptoms of MGD and associated dry eye. Treatment with the two drugs changed the characteristics and composition of meibum differently suggesting they have different mechanisms of action.
Tear break up time of patients with MGD improved to normal values after 8 weeks of oral treatment with doxycycline (Fig. 2). Symptoms of itch and swelling also improved significantly (Fig. 1A) as did all the other signs (Fig. 1B). Compared to 4 weeks of azithromycin treatment reported in our previous study,42 oral doxycycline treatment was slightly less effective in improving foreign body sensation and the signs of plugging and secretion (Fig. 1 B and C) and required longer treatment to achieve the effect.
Unlike azithromycin,42 doxycycline treatment did not improve the degree of meibum lipid ordering and correlative change in phase transition temperature (Fig. 3). Phase transition temperature, although not equivalent to melting temperature, is an indication of the fluidity of the lipid secretion and a lower phase transition temperature would likely be associated with greater movement of lipid secretion from the duct of the gland to the tear film and ocular surface.53 A higher content of trans rotomers (higher lipid order) would result in stronger lipid-lipid interactions. Stronger lipid-lipid interactions could result in a lower surface pressure which would impede ML spreading on the aqueous tear film surface causing lowered tear breakup time.30 Bringing the phase transition temperature and lipid order closer to normal levels was not a requirement for improving the signs and symptoms of MGD in patients treated with doxycycline.
Another difference between azithromycin and doxycycline treatment and the characteristics of meibum is that doxycycline improved the PCA scores more effectively than azithromycin (Fig. 4). The PCA scores were found to be dependent on lipid saturation, order, protein and CH3 groups.7,8 Although azithromycin treatment improved the PCA scores, the scores were not lowered below normal levels as they were for doxycycline.
The amount of protein in Md is significant and elevated with MGD compared with Mn.8 The amount of protein in meibum has been correlated to lipid order and phase transition temperature.8 It was suggested that as meibum protein was increased with MGD, lipid order (viscosity) increases lowering the flow of meibum from the meibomian gland to the lid margin.8 There was no significant change in the total amount of meibum protein in patients treated with either azithromycin or doxycycline. Howvever, it is possible that minor changes may occur in specific proteins with either treatment.
1H-NMR studies provided 4 markers of MGD. The area of the resonances at 5.2 and 1.26 ppm, the relative amount cholesterol esters, and the amount of products of lipid oxidation above 7 ppm are lower in Md compared with Mn.11–13 The resonance at 5.2 ppm has been tentatively assigned to terpenoids.12,13 The resonance at 1.26 ppm has been tentatively assigned to short chain CH3 moieties.12,13 Doxycycline treatment restored the relative area of the 1.26 ppm resonance to normal levels whereas azithromycin treatment had no affect (Fig. 6). Until the identity of the 1.26 ppm resonance is confirmed little should be said of the importance of this resonance to tear film stability. The observation that doxycycline treatment restored the relative area of the 1.26 ppm resonance to normal levels and azithromycin had no affect reinforces the idea that the mechanisms of the efficacy of the two drugs is different. Perhaps the difference between the mechanism of action of azithromycin and doxycycline on the characteristics of meibum may be related to the properties of azithromycin to inhibit tissue or bacterial lipases that otherwise degrade the lipid structure.27,55,56 Doxycycline inhibits matrix metalloproteinases. Further studies to clarify the mechanism of action of doxycycline and azithromycin are needed.
Products of lipid oxidation were surprisingly lower in Md compared with Mn (Table VII). Treatment with either azithromycin or doxycycline did not significantly change the total level of lipid oxidation in meibum. One small resonance at 7.9 ppm, one-tenth the area of the resonances above 7 ppm was restored to a higher level after treatment with azithromycin and doxycycline. The resonance at 7.9 ppm has been tentatively assigned to lipid hydroperoxides. The relevance of this finding will be reserved until the identity of this resonance is firmly established.
The amount of cholesterylester relative to wax decreased with MGD and treatment with doxycycline but not with azithromycin (Table 6). Three groups of donors were identified with a widely distributed relative amount of cholesterylesters. The distribution results in a large standard deviation associated with the average amount of cholesterylesters for the three groups.11 Cholesterylesters have little effect on the conformation of waxes.9 The amounts of cholesterylesters were lower with MGD as was tear film stability. In this study doxycycline treatment significantly lowered the amount of cholestrylesters and yet tear film stability increased, opposite to the relationship found between tear film stability and the amount of cholesterylesters with MGD. This suggests that changes in the amount of cholesterylester do not contribute to changes in tear film stability.
Both doxycycline treatment and azithromycin treatment restored the relative area of the resonance at 5.2 ppm to normal levels (Fig. 6). The 5.2 ppm resonance in the 1H-NMR spectra of meibum has been assigned to squalene, but this assignment has not been confirmed.57 This resonance could arise from a class of compounds called terpenoids that contain a =CH proton that is trans to a CH3 moiety.12,13 Carotenoids, a class of terpenoids such as lycopene and lutein have been found in the eye.4,58,59 A carotenoid-like compound in human meibum has been identified by Raman spectroscopy.4 Carotenoids are strong antioxidants60 and terpenoids in general protect against many diseases.61–64 Their concentration is lower in the retina of donors with macular degeneration.58 Future studies designed to isolate and identify the compounds responsible for the resonance at 5.2 ppm could provide useful information about the mechanisms by which azithromycin and doxycycline treatment reduce the signs and symptoms of dry eye. It is interesting that when carotenoid levels in meibum are low as in MGD, the tear film is unstable and patients have the signs and symptoms of dry eye. When carotenoids are restored with azithromycin and doxycycline treatment, tear film stability is restored and patients no longer have the signs and symptoms of dry eye.
Conclusion
This work highlights the power of following a clinical trial at the molecular level using spectroscopic approaches. Through the use of 1H-NMR spectroscopy, we could follow the compositional changes that restored the meibum to a near normal state as the patients experienced improvement in their symptoms of MGD. As both drugs have antibiotic properties, it is possible that treatment of MGD could lead to reduction of bacterial induced inflammation. Both drugs have been shown to have anti-lipase effects and these could certainly contribute to the observed changes in secretion. Further studies are needed to clarify the mechanisms of action of both drugs in therapy of MGD. Ideally, a prospective, randomized, double-masked comparative effectiveness clinical trial can be conducted to verify the differences both in clinical response and also in composition and behavior of meibum with therapy. Greater numbers of subjects would certainly be needed but the more complicated issue is that of masking of both subject and investigator. A topical placebo (Durasite vehicle) would be required for simultaneous use in those subjects randomized to doxycycline and an oral placebo would be required for simultaneous use in those subjects randomized to topical azithromycin. In addition to verifying the differences in response time and meibum character, such a comparative trial might also define which level of severity of disease would be most responsive to therapy through subset analysis. A further consideration would be to evaluate through a separate treatment arm of such a comparative effectiveness trial the utility of combined therapy of topical azithromycin and concurrent oral doxycycline therapy.
Acknowledgements
Supported by Public Health Service research grant EY017094-03 (Bethesda, MD., U.S.A.), the Kentucky Lions Eye Foundation, an unrestricted grant from Research to Prevent Blindness Inc., and a grant from Inspire Pharmaceuticals, Inc.
Much of this material is the result of work supported with resources and use of the facilities at the Louisville Veterans Affairs Medical Center, Louisville, KY. Dr Foulks is a member of the part-time staff of the Surgical Service, Department of Veteran Affairs Medical Center, Louisville, KY.
Footnotes
Publisher's Disclaimer: This is a PDF file of an unedited manuscript that has been accepted for publication. As a service to our customers we are providing this early version of the manuscript. The manuscript will undergo copyediting, typesetting, and review of the resulting proof before it is published in its final citable form. Please note that during the production process errors may be discovered which could affect the content, and all legal disclaimers that apply to the journal pertain.
References
- 1.Lemp M, Baudouin C, Baum J, et al. The definition and classification of dry eye disease: Report of the definition and classification subcommittee of the International Dry Eye Workshop (2007) The Ocular Surface. 2007;5:75–92. doi: 10.1016/s1542-0124(12)70081-2. [DOI] [PubMed] [Google Scholar]
- 2.Green-Church KB, Butovich I, Willcox M, Borchman D, Paulsen F, Barabino S, Glasgow B Meibomian Gland Contribution to the Tear Film. The Report of the International Workshop on Meibomian Gland Dysfunction. Invest. Ophthalmol. Vis. Sci. 2011;52:1979–1993. doi: 10.1167/iovs.10-6997d. [DOI] [PMC free article] [PubMed] [Google Scholar]
- 3.Borchman D, Foulks GN, Yappert MC, Tang D, Ho DV. Temperature-Induced Conformational Changes in Human Tear Lipids Hydrocarbon Chains. Biopolymers/Biospectroscopy. 2007;87:124–133. doi: 10.1002/bip.20798. [DOI] [PubMed] [Google Scholar]
- 4.Oshima Y, Sato H, Zaghloul A, Foulks GN, Yappert MC, Borchman D. Characterization of Human Meibum Lipid using Raman Spectroscopy. Curr. Eye Res. 2009;34:824–835. doi: 10.3109/02713680903122029. [DOI] [PubMed] [Google Scholar]
- 5.Borchman D, Foulks GN, Yappert MC, Kakar S, Podoll N, Rychwalski P, Schwietz E. Physical Changes in Human Meibum with Age as Measured by Infrared Spectroscopy. Ophthalmic Res. 2010;44:34–42. doi: 10.1159/000283606. [DOI] [PMC free article] [PubMed] [Google Scholar]
- 6.Foulks GN, Borchman D. Meibomian gland dysfunction:the past, the present, the future. Eye Contact Lens. 2010;36:249–253. doi: 10.1097/ICL.0b013e3181ef0d37. [DOI] [PubMed] [Google Scholar]
- 7.Borchman D, Foulks GN, Yappert MC. Confirmation of changes in human meibum lipid infrared spectra with age using principal component analysis. Curr. Eye Res. 2010;35:778–786. doi: 10.3109/02713683.2010.490895. [DOI] [PubMed] [Google Scholar]
- 8.Borchman D, Foulks GN, Yappert MC. Changes in human meibum lipid with meibomian gland dysfunction using principal component analysis. Exp Eye Res. 2010;91:246–256. doi: 10.1016/j.exer.2010.05.014. [DOI] [PMC free article] [PubMed] [Google Scholar]
- 9.Borchman D, Foulks GN, Yappert MC, Bell J, Wells E, Neravetla S, Greenstone V. Human meibum lipid conformation and thermodynamic changes with meibomian-gland dysfunction. Invest. Ophthalmol. Vis. Sci. 2011;52:3805–3817. doi: 10.1167/iovs.10-6514. [DOI] [PMC free article] [PubMed] [Google Scholar]
- 10.Ashraf Z, Pasha U, Greenstone V, Akbar J, Apenbrinck E, Foulks GN, Borchman D. Quantification of Human Sebum on Skin and Human Meibum on the Eye Lid margin using Sebum Tape, Spectroscopy and Chemical Analysis. Curr. Eye Res. 2011;36:553–562. doi: 10.3109/02713683.2011.574331. [DOI] [PubMed] [Google Scholar]
- 11.Shrestha RK, Borchman D, Foulks GN, Yappert MC. Analysis of the Composition of Lipid in Human Meibum from Normal Infants, Children, Adolescents, Adults and Adults with Meibomian Gland Dysfunction using 1H-NMR Spectroscopy. Invest Ophthalmol Vis Sci. 2011 doi: 10.1167/iovs.11-7391. In Press. [DOI] [PMC free article] [PubMed] [Google Scholar]
- 12.Borchman D, Foulks GN, Yappert MC, Millinar SE. Changes in Human Meibum Lipid Composition with Age Using NMR Spectroscopy. doi: 10.1167/iovs.11-8341. In press IOVS. [DOI] [PMC free article] [PubMed] [Google Scholar]
- 13.Borchman D, Foulks GN, Yappert MC, Millinar SE. Differences in Human Meibum Lipid Composition with Meibomian Gland Dysfunction using NMR and Principal Component Analysis. doi: 10.1167/iovs.11-8551. In press, IOVS. [DOI] [PMC free article] [PubMed] [Google Scholar]
- 14.Borchman D, Foulks GN, Yappert MC, Tang D, Ho DV. Spectroscopic Evaluation of Human Tear Lipids. Chem. Phys. Lipids. 2007;147:87–102. doi: 10.1016/j.chemphyslip.2007.04.001. [DOI] [PubMed] [Google Scholar]
- 15.Sullivan DA, Sullivan BD, Evans JE, et al. Androgen deficiency, Meibomian gland dysfunction, and evaporative dry eye. Ann N Y Acad Sci. 2002;966:211–222. doi: 10.1111/j.1749-6632.2002.tb04217.x. [DOI] [PubMed] [Google Scholar]
- 16.Shine WE, McCulley JP. Polar lipids in human meibomian gland secretions. Curr Eye Res. 2003;26:89–94. doi: 10.1076/ceyr.26.2.89.14515. [DOI] [PubMed] [Google Scholar]
- 17.Shine WE, McCulley JP. Association of meibum oleic acid with meibomian seborrhea. Cornea. 2000;19:72–74. doi: 10.1097/00003226-200001000-00014. [DOI] [PubMed] [Google Scholar]
- 18.Dougherty JM, Osgood JK, McCulley JP. The role of wax and sterol ester fatty acids in chronic blepharitis. Invest Ophthalmol Vis Sci. 1991;32:1932–1937. [PubMed] [Google Scholar]
- 19.Ong BL, Larke JR. Meibomian gland dysfunction: some clinical, biochemical and physical observations. Ophthalmic Physiol Opt. 1990;10:144–148. doi: 10.1111/j.1475-1313.1990.tb00968.x. [DOI] [PubMed] [Google Scholar]
- 20.Joffre C, Souchier M, Gregoire S, et al. Differences in meibomian fatty acid composition in patients with meibomian gland dysfunction and aqueous-deficient dry eye. Br J Ophthalmol. 2008;92:116–119. doi: 10.1136/bjo.2007.126144. [DOI] [PubMed] [Google Scholar]
- 21.Wojtowicz JC, Butovich I, McCulley JP. Historical brief on human meibum lipids composition. The Ocular Surface. 2009;7:145–153. doi: 10.1016/s1542-0124(12)70309-9. [DOI] [PubMed] [Google Scholar]
- 22.Borchman D, et al. Factors affecting evaporation rates of tear film components measured in vitro. Eye Contact Lens. 2009;35:32–37. doi: 10.1097/ICL.0b013e318193f4fc. [DOI] [PubMed] [Google Scholar]
- 23.Mathers WD. Ocular evaporation in meibomian gland dysfunction and dry eye. Ophthalmology. 1993;100:347–351. doi: 10.1016/s0161-6420(93)31643-x. [DOI] [PubMed] [Google Scholar]
- 24.Sullivan DA, Sullivan BD, Evans JE, et al. Androgen deficiency, meibomian gland dysfunction, and evaporative dry eye. Ann NY Acad Sci. 2002;966:211–222. doi: 10.1111/j.1749-6632.2002.tb04217.x. [DOI] [PubMed] [Google Scholar]
- 25.Paranjpe DR, Foulks GN. Therapy of meibomian gland disease. Ophthalmol Clin NA. 2003;16:37–42. doi: 10.1016/s0896-1549(02)00106-2. [DOI] [PubMed] [Google Scholar]
- 26.Donaldson KE, Karp CL, Dunbar MT. Evaluation and treatment of children with ocular rosacea. Cornea. 2007;26(1):42–46. doi: 10.1097/ICO.0b013e31802e3a54. [DOI] [PubMed] [Google Scholar]
- 27.Luchs J. Azithromycin in DuraSite for the treatment of blepharitis. Clin Ophthalmol. 2010 Jul 30;4:681–688. doi: 10.2147/opth.s6370. [DOI] [PMC free article] [PubMed] [Google Scholar]
- 28.John T, Shah AA. Use of azithromycin ophthalmic solution in the treatment of chronic mixed anterior blepharitis. Ann Ophthalmol (Skokie) 2008;40:68–74. [PubMed] [Google Scholar]
- 29.Luchs J. Efficacy of topical azithromycin ophthalmic solution 1% in the treatment of blepharitis. Adv Ther. 2008;25:858–870. doi: 10.1007/s12325-008-0096-9. [DOI] [PubMed] [Google Scholar]
- 30.Scaglione F, Rossoni G. Comparative anti-inflammatory effects of roxithromycin, azithromycin, and clarithromycin. J Antimicrob Chemother. 1998;41(Suppl B):47–50. doi: 10.1093/jac/41.suppl_2.47. [DOI] [PubMed] [Google Scholar]
- 31.Jacot JL, Jacot TA, Sheppard JD, et al. Evaluation of MMP 2/9 modulation by AzaSite and DuraSite in human corneal epithelial cells and bovine corneal endothelial cells in vitro. Ft. Lauderdale, FL. Association for Research in Vision and Ophthalmology. 2008 Apr 28; [Google Scholar]
- 32.Retsema J, Girard A, Schelkly W, et al. Spectrum and mode of action of azithromycin (CP-62,993), a 15-membered-ring macrolide with improved potency against gram-negative organisms. Antimicrob Agents Chemother. 1987;31(12):1939–1947. doi: 10.1128/aac.31.12.1939. [DOI] [PMC free article] [PubMed] [Google Scholar]
- 33.Pechere JC. Effect of the molecular structure of azithromycin on pharmacokinetics and the antimicrobial activity. Pathol Biol (Paris) 1995;43(6):483–487. [PubMed] [Google Scholar]
- 34.Stewart WC, Crean CS, Zink RC, Haque R, Hwang DG. Pharmacokinetics of azithromycin and moxifloxacin in human conjunctiva and aqueous humor during and after the approved dosing regimens. Ft. Lauderdale, FL. Association for Research in Vision and Ophthalmology. 2009 May 3–7; doi: 10.1016/j.ajo.2010.05.039. [DOI] [PubMed] [Google Scholar]
- 35.Golub LM, Lee HM, Ryan ME, Giannobile WV, Payne J, Sorsa T. Tetracyclines inhibit connective tissue breakdown by multiple non-antimicrobial mechanisms. Adv Dent Res. 1998;12:12–26. doi: 10.1177/08959374980120010501. [DOI] [PubMed] [Google Scholar]
- 36.Frucht-Pery J, Sagi E, Hemo I, Ever-Hadani P. Efficacy of doxycycline and tetracycline in ocular rosacea. Am J Ophthalmol. 1993;116:88–92. doi: 10.1016/s0002-9394(14)71750-7. [DOI] [PubMed] [Google Scholar]
- 37.Zengin N, Tol H, Gunduz K, Okudan S, Balevi S, Endogru H. Meibomian gland dysfunction and tear film abnormalities in rosacea. Cornea. 1995;14:144–146. [PubMed] [Google Scholar]
- 38.Akpek EK, Merchant A, Pinar V, Foster CS. Ocular rosacea: patient characteristics and follow-up. Ophthalmology. 1997;104:1863–1867. [PubMed] [Google Scholar]
- 39.Dursun D, Kim MC, Solomon A, Pflugfelder SC. Treatment of recalcitrant recurrent corneal epithelial erosions with inhibitors of matrix metalloproteinases-9, doxycycline and corticosteroids. Am J Ophthalmol. 2001;132:8–13. doi: 10.1016/s0002-9394(01)00913-8. [DOI] [PubMed] [Google Scholar]
- 40.Hope-Ross MW, Chell PB, Kervick GN, McDonnell PJ, Jones HS. Oral tetracycline in the treatment of recurrent corneal erosions. Eye. 1994;8:384–388. doi: 10.1038/eye.1994.91. [DOI] [PubMed] [Google Scholar]
- 41.Culbertson WW, Huang AJ, Mandelbaum SH, Pflugfelder SC, Boozalis GT, Miller D. Effective treatment of phlyctenular keratoconjunctivitis with oral tetracycline. Ophthalmology. 1993;100:1358–1366. doi: 10.1016/s0161-6420(93)31475-2. [DOI] [PubMed] [Google Scholar]
- 42.Foulks GN, Borchman D, Yappert MC, Sung-Hye K, McKay JW. Topical Azithromycin Therapy of Meibomian Gland Dysfunction: Clinical response and lipid alterations. Cornea. 2010;29:781–788. doi: 10.1097/ICO.0b013e3181cda38f. [DOI] [PMC free article] [PubMed] [Google Scholar]
- 43.Kilp H, Schmid E, Kirchner L, Pohl A. In: The Preocular Tear Film in Health, Disease and Contact Lens Wear. Holly FJ, editor. Lubbock: The Dry Eye Institute; 1986. p. 564. [Google Scholar]
- 44.Borchman D, Yappert MC, Herrell P. Structural characterization of human lens membrane lipid by infrared spectroscopy. Invest Ophthalmol Vis Sci. 1991;32:2404–2416. [PubMed] [Google Scholar]
- 45.Borchman D, Tang D, Yappert MC. Lipid composition, membrane structure relationships in lens and muscle sarcoplasmic reticulum membranes. Biospectroscopy. 1999;5:151–167. doi: 10.1002/(SICI)1520-6343(1999)5:3<151::AID-BSPY5>3.0.CO;2-D. [DOI] [PubMed] [Google Scholar]
- 46.Borchman D, Yappert MC, Afzal M. Lens lipids and maximum lifespan. Exp Eye Res. 2004;79:761–768. doi: 10.1016/j.exer.2004.04.004. [DOI] [PubMed] [Google Scholar]
- 47.Borchman D, Cenedella RI, Lamba OP. Role of cholesterol in the structural order of lens membrane lipids. Exp Eye Res. 1996;62:191–197. doi: 10.1006/exer.1996.0023. [DOI] [PubMed] [Google Scholar]
- 48.Moore DJ, Wyrwa M, Reboulleau CP, et al. Quantitative IR studies of acyl chain conformational order in fatty acid homogeneous membranes of live cells of Acholeplasma laidlawii B. Biochemistry. 1993;32:6281–6287. doi: 10.1021/bi00075a023. [DOI] [PubMed] [Google Scholar]
- 49.Popova AV, Hincha DK. Intermolecular interactions in dry and rehydrated pure and mixed bilayers of phosphatidylcholine and digalactosyldiacylglycerol: a Fourier transform infrared spectroscopy study. Biophys J. 2003;85:1682–1690. doi: 10.1016/S0006-3495(03)74598-6. [DOI] [PMC free article] [PubMed] [Google Scholar]
- 50.Casal HL, Mantsch HH. Polymorphic phase behaviour of phospholipid membranes studied by infrared spectroscopy. Biochim Biophys Acta. 1984;779:381–401. doi: 10.1016/0304-4157(84)90017-0. [DOI] [PubMed] [Google Scholar]
- 51.Mantsch HH, McElhaney RN. Phospholipid phase transitions in model and biological membranes as studied by infrared spectroscopy. Chem Phys Lipids. 1991;57:213–226. doi: 10.1016/0009-3084(91)90077-o. [DOI] [PubMed] [Google Scholar]
- 52.Kóta Z, Debreczeny M, Szalontai B. Separable contributions of ordered and disordered lipid fatty acyl chain segments to CH2 bands in model and biological membranes: a Fourier transform infrared spectroscopic study. Biospectroscopy. 1999;5:169–178. doi: 10.1002/(SICI)1520-6343(1999)5:3<169::AID-BSPY6>3.0.CO;2-#. [DOI] [PubMed] [Google Scholar]
- 53.Nagymihalyi A, Dikstein S, Tiffany JM. The influence of eyelid temperature on the delivery of meibomian oil. Exp Eye Res. 2004;78:367–370. doi: 10.1016/s0014-4835(03)00197-0. [DOI] [PubMed] [Google Scholar]
- 54.Holly FJ. Formation and rupture of the tear film. Exp Eye Res. 1973;15:515–525. doi: 10.1016/0014-4835(73)90064-x. [DOI] [PubMed] [Google Scholar]
- 55.Dougherty JM, McCulley JP, Silvany RE, Meyer DR. The role of tetracycline in chronic blepharitis-Inhibition of lipase production in staphylococci. Invest Ophthalmol Vis Sci. 1991;32:2970–2975. [PubMed] [Google Scholar]
- 56.Molinari G, Guzman CA, Pesce A, Schito GC. Inhibition of Pseudomonas aeruginosa virulence factors by subinhibitory concentrations of azithromycin and other macrolide antibiotics. Jour Antimicrobial Chemo. 1993;31:681–688. doi: 10.1093/jac/31.5.681. [DOI] [PubMed] [Google Scholar]
- 57.Robosky LC, Wade K, Woolson D, Baker DJ, Manning ML, Gage DA, Reily MD. Quantitative evaluation of sebum lipid components with muclear magnetic resonance. J Lipid Res. 2008;49:686–692. doi: 10.1194/jlr.D700035-JLR200. [DOI] [PubMed] [Google Scholar]
- 58.Leung IY. Macular pigment: New clinical methods of detection and the role of carotenoids in age-related macular degeneration. Optometry. 2008;79:266–272. doi: 10.1016/j.optm.2007.03.017. [DOI] [PubMed] [Google Scholar]
- 59.Ermakov IV, Sharifzadeh M, Ermakova M, Gellermann W. Resonance Raman detection of carotenoid antioxidants in living human tissue. J Biomed Opt. 2005;10:861–867. doi: 10.1117/1.2139974. [DOI] [PMC free article] [PubMed] [Google Scholar]
- 60.DiMascio P, Kaiser S, Sies H. Lycopene as the most efficient biological carotenoid singlet oxygen quencher. Arch. Biochem. Biophys. 1989;274:532–538. doi: 10.1016/0003-9861(89)90467-0. [DOI] [PubMed] [Google Scholar]
- 61.Krinsky NI. The biological properties of carotenoids. Pure Appl. Chem. 1994;66:1003–1010. [Google Scholar]
- 62.Schwartz JL. In vitro biological methods for determination of carotenoid activity. Methods Enzymol. 1993;214:226–256. doi: 10.1016/0076-6879(93)14069-u. [DOI] [PubMed] [Google Scholar]
- 63.Mayne ST. Beta-carotene, carotenoids, and disease prevention in humans. FASEB J. 1996;10:690–701. [PubMed] [Google Scholar]
- 64.Bara A, Socaciu C, Neamtu G. Radioter. Oncol. Med. 1995;2:16–21. [Google Scholar]