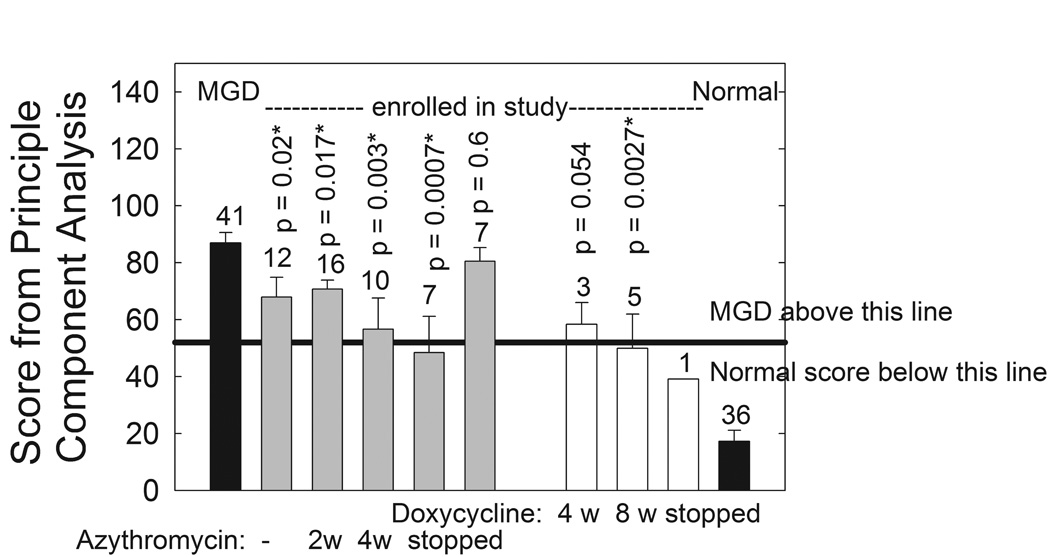
Figure 4.
Data from the FTIR spectra of human meibum. Gray bars: azythromycin study. Filled bars: data is from a larger published study.42 * statistically significant difference p < 0.05. Principal Component analysis was used to analyze the CH and OH stretching region from 3612 to 2490 cm−1 and the fingerprint region from 1814 to 676 cm−1. Based on a training set of 77 infrared spectra from Md and Mn,8 scores were assigned to the spectra. A score higher than 59 indicates that the infrared spectra is similar to the spectra of Md. A score lower than 59 indicates that the infrared spectra are similar to the spectra of Mn.8

