

Abstract
The heterogeneity of volumes of distribution in the heart influences the rates of uptake and washout of substrates and metabolites; thus it is important to evaluate their variability in the normal heart. Several tracers were injected intravenously into anesthetized adult closed-chest rabbits, and time was allowed for equilibration in the heart. Tracer microspheres were injected into the left ventricular cavity at the apex for the measurement of regional flows, the chest was opened, another set of microspheres was injected, and the heart was frozen rapidly in situ with liquid nitrogen-cooled Freon-22. Each heart was divided into 72 pieces of <0.1 g weight, and the tracer content of each was determined by multichannel γ-counting and the water content by desiccation. The regional myocardial flows were (closed chest) 0.62 ± 0.16 ml·g−1·min−1 and (open chest) 0.63 ± 0.37 ml·g−1·min−1. The volumes of distribution (ml/g) for the 432 pieces for six rabbits, given as mean ± SD (% coefficient of variation), were as follows: for plasma, VP = 0.11 ± 0.03 (26%); erythrocytes, VRBC = 0.041 ± 0.015 (37%); vascular space, VV = 0.15 ± 0.04 (26%); extracellular space, VECF = 0.33 ± 0.05 (15%); interstitial space, VISF = 0.21 ± 0.03 (15%); and water space, VW − 0.79 ± 0.022 (2.8%). Regional hematocrits were 77% ± 9% of the large-vessel hematocrits.
Keywords: extracellular space, interstitial fluid, plasma volume, erythrocyte space, myocardial blood volume, heart water content, capillary hematocrit, tissue variability, sucrose, radiocobaltic ethylenediaminetetraacetic acid
MARKED HETEROGENEITY in regional blood flow in the normal heart has been recognized in studies using microsphere deposition and outflow dilution techniques (5, 48). The relative dispersions of the regional flows (the standard deviation/mean) have been measured in the normal awake baboon heart to be 0.25–0.35 (28), with the flows ranging from 30 to 200% of the mean flow. Heterogeneity of regional flows seriously affects estimates of total myocardial flow using either external detection techniques (9) or coronary sinus outflow sampling (29); it also results in erroneously low values for capillary permeability-surface area products (PSC) estimated using multiple indicator-dilution techniques (6, 22, 24, 43, 46). In fact, a flow distribution in the heart having a relative dispersion of ~0.35 will result in a 22–30% underestimate in PS (6). The models of Rose and co-workers (43, 44) incorporate assumptions as to the form of the heterogeneity of vessel transit times (vessel volume/flow) that provide better fits to data from indicator-dilution curves through the coronary circulation. Kuikka et al. (31) used microsphere deposition densities to provide estimates of flow heterogeneity; these were used in multicapillary models, improving the accuracy of estimating blood-tissue exchange rates.
On this background, it is now important to recognize that the heterogeneity of the vessel transit times implies that, in addition to flow heterogeneity, the presence of volume heterogeneity and its effect on PS estimates are also important and should be investigated. Despite the considerable data on heterogeneity of regional myocardial flows, there are no studies that deal specifically with the heterogeneity of regional volumes of distribution. Page (37), in reporting his studies of mannitol space (40% of the total water) and inulin space (24%) in isolated superfused cat papillary muscles, states that the extracellular space is clearly not homogeneous. The studies of Yipintsoi et al. (52) demonstrated only a narrow heterogeneity of regional myocardial water content but provided no data on other spaces. Past studies have generally dealt with either whole heart volumes of distribution determined using indicator-dilution techniques (22, 23, 54) or volumes of distribution of several tissue samples determined either after steady-state equilibration of tracers (23, 26, 32, 39) or by using histological methods (26, 39). Bridge et al. (11) showed data indicating substantial variation in volumes of distribution of sucrose and cobaltic EDTA, but in those studies the emphasis was on the comparison between the two tracers and not on the heterogeneity of their volumes of distribution. Heterogeneity of cellular metabolism was revealed by the studies of Stahl et al. (47) showing regional variation in oxygen uptake; Franzen et al. (19) found variation in local ATP and phosphocreatine concentrations. It has long been recognized that hematocrits in small vessels are smaller than in large vessels, but we are lacking whole organ data that would allow one to relate this to transcapillary transit times for erythrocytes vs. plasma and to use such information in understanding blood-tissue exchange kinetics.
In this study both ventricles of the rabbit heart were finely sectioned after steady-state equilibration of tracers and the injection of radioactive microspheres in vivo. The volumes of distribution and flows were then calculated in the individual heart pieces and were grouped according to region. The regional volumes of distribution and flows in the heart and their degrees of heterogeneity were determined. From this better understanding of the volumes of distribution in the heart and their heterogeneity, more realistic heterogeneous models can be developed for characterizing the transport of substrates in the heart.
The experimental data thus serve three purposes directly: 1) to determine the heterogeneity of regional volumes of distribution for both intravascular tracers and tracers entering the extravascular regions; 2) to test for associations between the various regional volumes of distribution and the regional flows; and 3) to obtain estimates of the hematocrit in small pieces of myocardium, which would provide a basis for previous observations that transcoronary transit times are shorter for erythrocytes than for plasma.
METHODS
Animal preparation
Male New Zealand White rabbits weighing 2–3 kg were anesthetized with thiopental sodium (~30 mg/kg) and allowed to ventilate spontaneously via a tracheal cannula. The left femoral artery was cannulated for the measurement of blood pressure and for withdrawal of blood samples, the left femoral vein for the injection of tracers, the left carotid artery for the injection of microspheres via a catheter advanced into the apical region of the left ventricle, and the right femoral artery for the collection of the microsphere reference sample. All catheters were 0.87-mm-ID 1.27-mm-OD polyethylene tubing, 30 cm long and inserted ~10–15 cm. After the cannulations the abdomen was opened, the renal vessels were tied off to eliminate tracer loss, and the abdomen was closed. The animal was heparinized (400 U/kg) after surgery.
Experimental procedure
In the six main experiments, after a 1-ml control blood sample was taken for background activity and hematocrit, 22NaCl (50 μCi) for the estimation of sodium space and the interstitial fluid (ISF) volume and 51Cr-erythrocytes (150 μCi) for red blood cell volume were injected at t = 0 min into the inferior vena cava and allowed to equilibrate until the rabbits were killed at 50 min. At t = 30 min, 99mTc- or 131I-albumin was injected for the estimation of plasma volume. From t = 0 to 50 min, 1-ml arterial blood samples were taken at 5-min intervals to monitor the plasma isotope levels. At t = 35 min, the 15 ± 1-μm-diameter 46Sc-labeled microspheres (20 μCi, same size) were injected into the left ventricle for regional flow determination in the intact heart. The animal was then put on a respirator, the chest was opened, and the heart was exposed. At t = 47 min, the 95Nb microspheres (20 μCi, same size) were injected into the left ventricle for estimation of regional myocardial flows after opening the chest. Each microsphere injection lasted between 10 and 30 s while a reference sample was being withdrawn (Harvard Pump model 932) at a rate of 1.53 ml/min for 3 min for use in determining the absolute values of the regional myocardial blood flows. Immediately after the 95Nb microsphere reference sample, an aluminum foil boat was slipped under the heart and ~100 ml of Freon 22 at −150°C was poured over the heart and into the boat at t = 50 min. Within ~2 s the heart stopped beating and its surface was frozen, trapping the blood at that moment. Preliminary studies, employing a thermocouple inserted into the left ventricle, indicated that the heart was completely frozen within 30–45 s. After freezing, the heart was immediately removed, the adipose tissue and atria were cut away, and the ventricles were sectioned on dry ice into 72 pieces using the standardized pattern shown in Fig. 1. These experiments thus provided data on the concentrations of five different γ-tracers in each piece of tissue.
Fig. 1.
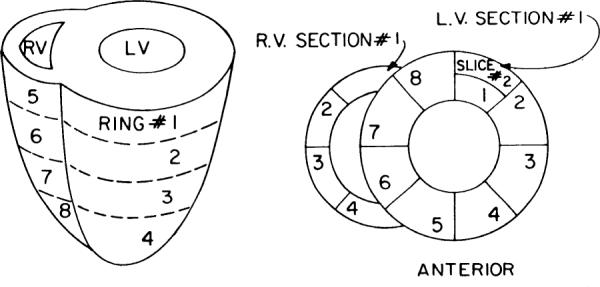
Format for partitioning ventricles of rabbit heart. Four transverse rings are shown on left. Four rings of left ventricle (LV) are divided into 8 sections, each of which in turn is divided into endocardial and epicardial slices, except for apical ring where wall was too thin to merit separating endo- from epicardium. Total equalled 72 pieces, averaging ~0.1 g. RV, right ventricle.
In two other rabbits, specific studies were made to estimate the apparent hematocrits in small regions: injections of 51Cr-erythrocytes and 131I-albumin were made intravenously 5 min before the rabbits were killed, allowing time for intravascular mixing throughout the heart and minimizing the time for any albumin loss from the vascular space.
In two additional hearts, specific comparisons between 22Na (25 μCi), 58cobalt-labeled EDTA (100 μCi), and [14C]sucrose (75 μCi) were made. The 58Co-EDTA was prepared for us by Dr. John Bridge, as he has described (11). 58Co-EDTA and [14C]sucrose are considered to be specific markers for extracellular space (11), whereas 22Na enters myocardial and other cells slowly and to a small extent, being held at a low intracellular concentration by the sodium pump. Sodium may also bind to macromolecules in the ISF space (27) as well as to the cell surface (e.g., at transport sites). Injections of the three tracers were made 25 min before the rabbits were killed, allowing for complete ISF-plasma equilibration but probably not allowing sufficient time for complete equilibration between extracellular and intracellular sodium.
Analysis of samples
The individual pieces were weighed, and their radioactivity was counted for 5 min/sample in a well-type Tl-activated NaI crystal photo-multiplier system using an automatic sample changer (Baird-Atomic model 707) and a multichannel analyzer (Tracer-Northern model MS 700) from which the whole spectra were recorded from each sample. Regions of interest for the major peaks of the five isotopes were selected in the spectra, and the counts for the individual tracers were separated by determining the ratios of the efficiencies of the tracers in each region of the spectra. Counts for each isotope were corrected for background and for isotope decay. After isotope counting, the heart pieces were desiccated at 105°C for 24 h and then re-weighed to determine water volume.
Tissue samples containing [14C]sucrose and 58Co-EDTA were then dissolved in Beckman tissue solubilizer (Beckman Instruments, Fullerton, CA) for 24 h at 40°C in preparation for β-counting. The dissolved samples were pipetted into scintillation vials (the pipette tips were saved in their respective tubes) and decolorized by adding 0.1 ml perchloric acid (70%) and 0.2 ml hydrogen peroxide (30%) and heating at 90°C for 45 min; this reduced the quenching of β-emissions. The residual isotope in the empty tubes was recovered by rinsing the tubes five times with 2-ml aliquots of scintillation fluid, which was then pipetted into the respective scintillation vials. The empty tubes and pipette tips were counted for residual 58Co by γ-counting: when the residual level was less than two times background, the washout process was considered acceptable. The scintillation vials were shaken until the contents appeared clear, and the activities were counted using a Nuclear-Chicago Mark II Liquid scintillation counter (model 6844). The quench curve samples, containing varying amounts of dissolved decolorized myocardial tissue as the quenching agent, were prepared and counted in an identical manner to the heart pieces. The quench curve coefficients were calculated for [14C]sucrose and 58Co-EDTA. The emissions were counted in two channels of the β-counter, and the activities for each tracer were estimated using the appropriate corrections for background and spillover at each level of quenching as well as for isotopic decay of the 58Co.
Calculations
The concentrations (C) of each of the tracers in each sample were calculated as the counts per minute per gram of frozen wet myocardial tissue corrected for background counts and for spillover from other tracers. The Plasma volume (VP, ml/g of myocardium) was calculated for each heart piece from the activity of 131I-albumin
| (1) |
where CAlb(heart) is the radioactive albumin activity in each heart piece (counts·min−1·g−1 of frozen tissue), CAlb(plasma) is the radioactive albumin activity of the plasma (counts·min−1·g−1 of plasma), and ρP is the density of plasma (1.025 g/ml) (33).
In experiments using 99mTc-albumin, some of the 99mTc was free, which required making a correction to estimates of plasma volume. The percentage free at 30 min after injection into the blood was 2.8%. In one experiment, stopping the heart 30 min after injection, the estimates of plasma volume using 99mTc-albumin in Eq. 1 were 0.025 ml/g larger than those obtained from the 131I-albumin simultaneously for 72 pieces; the regression equation was VP(99mTc) = 0.025 + 1.0 VP(131I) with a correlation coefficient of 0.997. The slope being 1.0 indicates that there was no systematic change in the degree of overestimation in regions with higher vs. lower plasma volumes so that in those experiments in which only 99mTc-albumin was used the value taken for VP was that calculated using Eq. 1 and subtracting 0.025 ml/g.
The red cell volume (VRBC, ml/g of myocardium) was calculated from the 51Cr-erythrocyte activity
| (2) |
where CRBC(heart) is the 51Cr-erythrocyte activity in each piece (counts·min−1·g−1 of frozen tissue), CRBC(red cells) is the 51Cr-erythrocyte activity of packed red cells (counts·min−1·g−1 of red cells), corrected for the trapping of plasma, and ρRBC is 1.098 g/ml, the density of red blood cells (33). Plasma trapping was usually ~3–4%, estimated in all samples from the activity of the labeled albumin. The plasma and packed red cell activities used in the calculations were determined from the last blood sample taken just before freezing the heart.
The vascular volume (VV, ml/g of myocardium) and the regional hematocrit (Hct) were calculated from the plasma and red cell volumes of each piece
| (3) |
| (4) |
The tracer sodium volume of distribution (VNa, ml/g of myocardium) was
| (5) |
where CNa (heart) is the 22Na activity in each heart piece (counts·min−1·g−1 of frozen tissue) and CNa(plasma) is the 22Na activity of the plasma (counts·min−1·g−1 of plasma).
The extracellular fluid space (ECF) volume (VECF, ml of plasma-equivalent fluid/g of myocardium) was calculated from the tracer activities for 58Co-EDTA and [14C]sucrose by
| (6) |
where CECF(heart) is the activity of either of the ECF markers in each heart piece (counts·min−1·g−1 of frozen tissue) and CECF(plasma) is the ECF tracer activity of plasma (counts·min−1·g−1 of plasma) averaged from the last blood sample taken just before freezing the heart and the five venous samples taken immediately after freezing.
The interstitial fluid volume (VISF, ml of plasma-equivalent fluid/g of myocardium) was calculated from the estimated ECF and plasma volumes of each piece
| (7) |
In the two hearts in which 22N, 58Co-EDTA, and [14C]sucrose volumes of distribution were obtained simultaneously and in which the estimates of VECF from 58Co-EDTA and [14C]sucrose were essentially identical, the relationship between VECF and VNa was as shown in RESULTS
| (8) |
For the analysis of the experiments done with 22Na alone, this estimate of VECF was used in Eq. 7 to obtain an estimate of VISF corrected for Na entry into cells. Because the regression relationship of Eq. 8 was relatively scattered, this added about 10% random error to the estimates of VECF (see RESULTS).
The water volume (VW, ml/g of myocardium) was calculated from the wet and dry weights of the heart pieces
| (9) |
where W(wet) is the weight (g) of the frozen tissue, W(dry) is the weight (g) after desiccation, and the specific gravity of water ρW is taken to be 1.0 g/ml.
The regional capillary blood flow (FB, ml·g−1·min−1) was calculated for each piece of myocardium from the microsphere activities (Cm)
| (10) |
where Fref is the withdrawal rate of the reference blood sample (ml/min), Wref is the total weight of the reference sample (g), Cm(heart) is the microsphere deposition density in each piece (counts·min−1·g−1 of frozen tissue), and Cm(ref) is the microsphere deposition density in the reference sample (counts·min−1·g−1 of blood). Microspheres have been found to provide valid estimates of regional myocardial flows in rabbits (8).
The coronary blood flow FB is the sum of plasma and erythrocyte flows (FP and FRBC)
| (11) |
On the assumption that the hematocrit of the blood entering the tissue regions is the same as the large-vessel hematocrit (HctLV), then differences in plasma and red cell velocities and in transit times must exist whenever the regional hematocrit (Hct) is different from HctLV. Usually local Hct is less than HctLV, in which case red cell transit times (τRBC) are shorter than plasma transit times (τP)
| (12) |
| (13) |
The mean transit time for the blood (τB) reduces to the simpler calculation in the case where erythrocyte skimming or shunting occurs within groups of capillaries smaller than our tissue samples
| (14) |
The calculations for VECF and VISF in Eqs. 6 and 7 provide estimates in terms of plasma-equivalent volumes of distribution. To translate these into equivalent water spaces, one multiplies these values by the fractional water content of plasma; this is dependent principally on the protein content of plasma but, for our purposes, will be taken to be at an average value of 0.95 ml H2O/ml. This is a rough estimate based on the 0.944 ml H2O/ml plasma (1). It is close to the value of 0.956 obtained by Effros and Chinard (16) for dog plasma. Therefore the interstitial water content (VISFW) would be 0.95 VISF and cellular water (VCW) would be
| (15) |
where 0.73 is the water content of erythrocytes in the dog (16).
The mean transit time for water (τW) through a tissue region is its volume of distribution (VW) divided by the water flow (FW)
| (16) |
Much of the data is presented in the form of normalized probability density functions having unity area underneath the curve. These are computed as histograms with narrow class sizes; the midpoints of the classes are joined by a polygon so that several on the same plot can be distinguished from one another, whereas the traditional histograms cannot. For normalized distributions, we have used a class size of 10% of the mean or have used 25 classes spread over the range of the distribution. Linear regression analyses were calculated assuming equal error in x and y (49), which approximately minimizes the perpendiculars from the points to the line and gives a best fitting line which is close to the bisector of the angle between the y on x and x on y regressions. An algorithm by York (53) has the same intent but often fails to converge, whereas that reported by Boggs, Byrd, and Schnabel (10) appears to converge rapidly to a correct answer. An implementation of this algorithm in FORTRAN is available in ORDPACK, which can be obtained from the National Institute for Standards and Technology (Applied and Computational Mathematics Division, Boulder, CO).
The observations contain error. Mean coefficient of variation in flow estimates from microspheres is taken to be 8% (8). Mean coefficient of variation for β-labeled tracers is taken to be 2.5%, the error observed by Bassingthwaighte et al. (7). The error in β-labeled tracers has not been reliably and independently assessed but from the [14C]sucrose-58Co-EDTA comparisons must be 2.5–4.5%.
RESULTS
Comparisons between ECF markers
The two experiments in which we measured the volumes of distribution of 58Co-EDTA, [14C]sucrose, and 22Na (without microspheres) will be reported first because the results are needed to interpret the 22Na data in the main set of experiments. The comparisons between sucrose and 58Co-EDTA are shown for two rabbits in Fig. 2A. They give essentially identical volumes of distribution: the ratios of VECF(58Co-EDTA)/VECF([14C]Suc) were 0.973 ± 0.043 (mean ± SD, N = 130) using the γ-counting for 58Co and 1.05 ± 0.08 using β-counting for 58Co, which is less reliable, and the average, weighted for the relative reliability, is ~1.00 ± 0.05. These data are from the same experiments reported and discussed in detail by Bridge et al. (11) and have been analyzed more extensively. 58Co-EDTA and [14C]sucrose are probably nearly equally reliable markers for ECF in rabbit heart, with the edge in favor of the γ-labeled 58Co-EDTA.
Fig. 2.

Estimates of volumes of distribution of extracellular markers. A: comparison of extracellular fluid space volume (VECF) estimates from [14C]sucrose vs. 58Co-EDTA (from γ-counting rather than β-counting). Regression line, VECF(Suc) = 0.001 + 1.03 VECF(58Co-EDTA), with a correlation coefficient of 0.974, is not distinguishable from line of identity. Average VECF for 2 tracers is 0.32 ± 0.06 (N = 130) ml of plasma-equivalent volume/gram of myocardium. [Data from same experiment as in Fig. 2 of Bridge et al. (11).] B: comparison of sodium space volume (VNa) with VECF, where VECF is average in each piece for VECF([14C]Suc) and VECF(58Co-EDTA) (γ-counts). Ratio VNa/VECF averaged 1.13 ± 0.08 in this comparison.
The volumes of distribution for 58Co-EDTA, VECF-(58Co-EDTA), were 0.310 ± 0.060 (mean ± SD, N = 130) ml plasma-equivalent space/g of heart tissue and 0.35 ± 0.066 from β-counting, whereas those for VECF([14C]Suc) were 0.319 ± 0.063 (N = 130) ml/g. The average of the two indicators gives an estimate of VECF of 0.32 ± 0.06 ml plasma-equivalent volume/g of heart tissue; this is equivalent to extracellular water space of 0.96 × 0.32 or 0.31 ml water/g heart tissue.
The estimates of VNa averaged 0.355 ± 0.056 ml/g. In Fig. 2B are shown the estimates of VNa vs. the average of the pair of values for VECF(58Co-EDTA) (γ-counting) and VECF([14C]Suc) in each piece of tissue of the same two hearts as portrayed in Fig. 2A. The relationship is more variable than for the [14C]sucrose-58Co-EDTA comparison, the standard deviation of the ratios being ~2.5 times greater. The ratios of VNa/VECF averaged 1.11 ± 0.13 (N = 130) using the data from both γ- and β- counting. This average ratio was used in estimating VECF from VNa in those experiments in which sucrose and 58Co-EDTA were not available. A regression relationship was not used for the estimation for two reasons: the intercept was not significantly different from zero, and also it seemed that since the major variability in the tissue is the content of large vessels, the ratio of cell to ISF volumes should have less variation and therefore it is more logical to estimate VECF from its ratio to VNa than any y on x or x on y regression relationship. This is our justification for using Eq. 8 for estimating VECF from VNa.
Volumes of distribution of vascular and extravascular spaces
The six main experiments provided estimates of the regional volumes of distribution of erythrocytes, plasma, sodium, and water, and by calculation, interstitial space and hematocrits. The animals, though anesthetized and suffering blood loss because of the sampling, appeared to be in acceptable physiological state. The mean systolic and diastolic blood pressures for the six rabbits after the initial cannulations were 92/69 mmHg. After the abdomen was opened and the renal vessels were ligated, the pressures dropped transiently by 20–40 mmHg systolic. During the microsphere injections in only two of the six experiments, there was a transient increase in blood pressure by ~5 mmHg for ~1 min. Because blood samples were taken every 5 min to measure isotope activities, the mean hematocrit dropped from 40.3 ± 3.5 just before the first isotope injection to 34.7 ± 5.4 just before the heart was frozen. The activities of each of the tracers in the plasma plateaued during the last 10 min before the rabbits were killed, with the exception of the 99mTc-albumin levels, which continued to diminish slowly because of the fraction of unbound 99mTc that was accounted for as described under METHODS.
The hearts were each divided into 72 pieces, weighing an average of 0.076 ± 0.036 g (mean ± SD, N = 432). The estimated average number of microspheres per piece was 1,400 ± 400 for 46Sc and 970 ± 260 for 95Nb. These numbers indicate that one can expect 5.2 and 6.3% accuracy, respectively, at the 95% confidence interval (13).
Mean volumes, flows, and hematocrits
The mean regional volumes of distribution, flows, and relative hematocrits in the heart, averaged from all six experiments, are listed in Table 1. In the right ventricles the red cell, plasma, vascular, and sodium volumes of distribution averaged 15–34% larger than in the left ventricle, the differences being statistically significant. The water volumes averaged slightly greater in the left ventricle than in the right, but the difference was not statistically significant. The values for water space in the left ventricle are also slightly larger in these rabbit hearts than the 0.777 ± 0.011 ml/g (mean ± SD, N = 160) found by Yipintsoi et al. (52) in dog hearts. The volumes of distribution for the whole left ventricle are shown in Fig. 3.
TABLE 1.
Regional volumes of distribution, flows, and relative tissue hematocrits in six rabbit hearts
| Region | N | Mean Wt of Pieces, g | VRBC, ml/g | VP, ml/g | VV, ml/g | VNa, ml/g | VECF, ml/g | VISF, ml/g | VW, ml/g | FB (Chest Closed), ml · g−1 · minȒ1 | FB (Chest Open), ml · g−1 · min−1 | Hct/HctLV |
|---|---|---|---|---|---|---|---|---|---|---|---|---|
| LV | 56 × 6 | 0.078 ± 0.010 | 0.038 ± 0.012 | 0.101 ± 0.020 | 0.139 ± 0.027 | 0.349 ± 0.024 | 0.314 ± 0.03 | 0.210 ± 0.027 | 0.795 ± 0.015 | 0.681 ± 0.058 | 0.672 ± 0.368 | 0.771 ± 0.084 |
| LV epicardium | 24 × 6 | 0.097 ± 0.015 | 0.040 ± 0.012 | 0.103 ± 0.020 | 0.144 ± 0.027 | 0.354 ± 0.026 | 0.318 ± 0.03 | 0.212 ± 0.030 | 0.793 ± 0.019 | 0.651 ± 0.069 | 0.652 ± 0.333 | 0.793 ± 0.067 |
| LV endocardium | 24 × 6 | 0.059 ± 0.008 | 0.037 ± 0.013 | 0.100 ± 0.021 | 0.137 ± 0.029 | 0.345 ± 0.018 | 0.311 ± 0.03 | 0.207 ± 0.022 | 0.801 ± 0.010 | 0.759 ± 0.139 | 0.739 ± 0.462 | 0.742 ± 0.112 |
| RV | 16 × 6 | 0.066 ± 0.019 | 0.051 ± 0.021 | 0.129 ± 0.040 | 0.180 ± 0.052 | 0.403 ± 0.037 | 0.363 ± 0.05 | 0.230 ± 0.043 | 0.777 ± 0.034 | 0.413 ± 0.208 | 0.467 ± 0.336 | 0.808 ± 0.102 |
| Whole heart | 72 × 6 | 0.075 ± 0.013 | 0.041 ± 0.015 | 0.107 ± 0.028 | 0.148 ± 0.038 | 0.361 ± 0.035 | 0.325 ± 0.05 | 0.214 ± 0.032 | 0.791 ± 0.022 | 0.621 ± 0.156 | 0.626 ± 0.369 | 0.779 ± 0.089 |
Values are means ± SD averaged from means of 6 experiments. N, no. pieces in each heart. Volume distributions (V): RBC, erythrocyte; P, plasma; vascular; Na, sodium; ECF, extracellular fluid; ISF, interstitial fluid; W, water. FB, regional capillary blood flow; Hct, hematocrit; LV, large vessel; LV, left ventricle; RV, right ventricle.
Fig. 3.
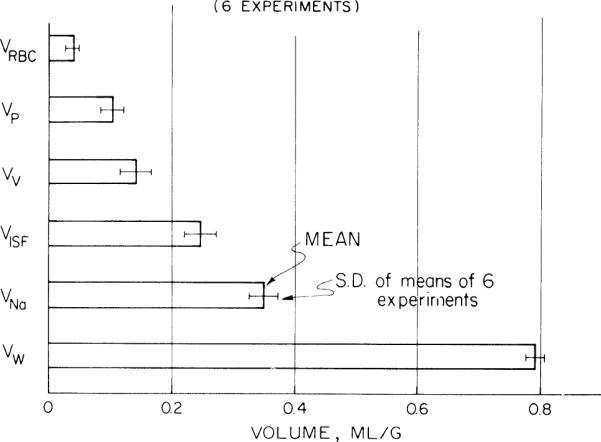
Volumes of distributions in whole left ventricle of rabbit heart calculated from tracers labeling erythrocyte space (VRBC), plasma space (VP), vascular space (VV), interstitial fluid space (VISF), sodium space (VNa), and water space (VW). Error bars give standard deviations of means of each of 6 rabbit left ventricles.
Differences between the endocardial and epicardial regions in the left ventricle were small and not statistically significant. However, there was a suggestion that vascular volumes (both components) were greater in the epicardium than the endocardium, as might be expected due to the preponderance of major vessels on the epicardial surface. Flows were ~15% greater in the endocardium; the difference between means was not statistically significant, but paired differences in individual sections were.
In summary, all volumes except the water volume were greatest in the right ventricle, intermediate in the left ventricular epicardium, and smallest in the left ventricular endocardium, and flows were greatest in the left ventricular endocardium, intermediate in the left ventricular enicardium, and smallest in the right ventricle as observed by King et al. (28) in baboons. However, only the volume differences between the left and right ventricles were statistically significant.
Heterogeneity of volumes and flows
Since the hearts were divided into 72 pieces, we were able to construct histograms of the distributions of the volumes and flows for each experiment. To combine these distributions for all experiments, the volumes and flows calculated for each of the heart pieces were divided by the mean values from their respective experiments, allowing us to describe the relative flows and volumes for each experiment as a distribution around the mean of unity. The distributions from all six experiments were then combined to give overall density functions for each of the volumes and flows in the left and right ventricles. Those for the LV are shown in Fig. 4, and these distributions are summarized in Table 1. Note that the distributions are slightly right skewed.
Fig. 4.
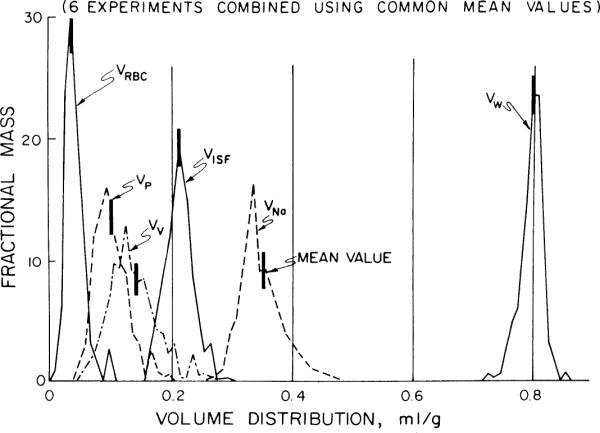
Probability density functions of volumes of distributions in rabbit left ventricle. Mean values and abbreviations are those shown in Fig. 3. Density functions for 6 animals are combined by superimposing mean of each individual heart upon average mean; this provides a correct and realistic representation of spread of the data around mean.
The relative dispersions of the volumes of distribution are given in Table 2 for the whole of individual hearts and for the right and left ventricles separately. The second and third columns illustrate that the right ventricular tissues are significantly more variable, particularly for the components of the vascular volumes. The scatter in the estimates of VNa, illustrated in Fig. 2 (right), is the main contributor to the scatter in VECF, but the scatter in VISF contains an additional contribution from the wide scatter in VP.
TABLE 2.
Percentage relative dispersions of volumes of distribution in rabbit hearts
| Region of Distribution | %RD in Individual Hearts |
%RD in 6 LV Grouped | ||
|---|---|---|---|---|
| Whole heart | RV alone | LV alone | ||
| VRBC | 37 | 41 | 32 | 41 |
| VP | 26 | 31 | 20 | 33 |
| VV | 26 | 29 | 19 | 35 |
| VISF | 15 | 19 | 13 | 10 |
| VNa | 10 | 9 | 7 | 12 |
| VECF | 10 | 9 | 7 | 12 |
| VW | 2.8 | 4.4 | 1.9 | 3 |
%RD (relative dispersion) = 100 × SD/mean. See Table 1 footnote for abbreviations.
The variance of the distribution in Fig. 5 is mainly due to variation among samples in a heart but is augmented by differences in the shapes of the distributions in the different hearts. The relative dispersions of each volume of distribution in the LV from all the heart pieces grouped together is given in Fig. 5 and in the rightmost column of Table 2. The relative dispersions for the vascular space appears 84% greater comparing VV in the LV of the individual hearts (19%) with that in the lumped LV data (35%), illustrating that variation between the experiments was great. The opposite occurred for VNa, suggesting that the distributions of ISF and cell water are more stable than are the vascular spaces which are subject to physiological regulation.
Fig. 5.
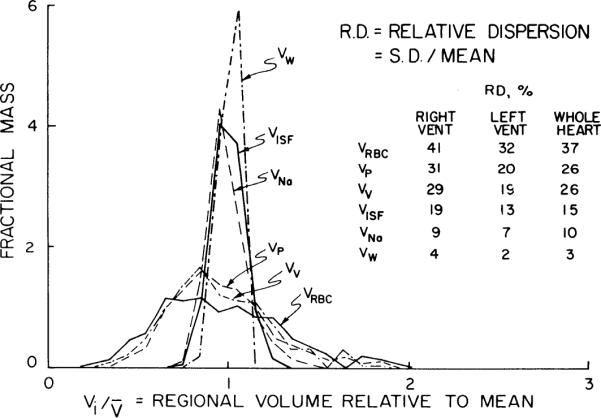
Normalized probability density functions for volumes of distributions in left ventricle of 6 rabbits. Distributions are composed of individual pieces from 6 ventricles, a total of 56 × 6 or 336 pieces, and volume of distribution in each piece is plotted relative to the mean for whole 336 pieces. Relative dispersions are therefore larger than for individual animals, of which Fig. 4 gives a closer representation. For abbreviations see Fig. 2 legend. (See Table 2 for the contrasting viewpoints.)
The variation in water space is narrow, particularly in individual left ventricles (Table 1, Fig. 4) as was observed in dogs by Yipintsoi et al. (52), and tended to be slightly left skewed. The left skewness is probably a statistical inevitability, simply reflecting a natural right skewness of the distribution of solids in the tissue, as the water plus solid equals the total weight.
The distribution of flows shown in Fig. 6, determined from microspheres injected into the closed-chest rabbit, is quite similar to that shown in well-perfused isolated hearts (51) and in intact awake baboons (28). The exposure of the heart on opening the chest created broader flow heterogeneity (Fig. 6), even though the mean flows were unchanged (Table 1). This is not what we would have anticipated from the baboon studies, where the spatial heterogeneity remained rather stable through a range of physiological changes in body heating or mild exercise. It is presumably related to a marked drop in aortic perfusion pressure occurring as the chest was opened or to the subsequent cooling of the epicardium. The responses to changes in conditions are similar to those seen by Gorman et al. (21) in guinea pig hearts vasodilated using dipyridamole. (The data from the baboons, in which up to 6 sets of microspheres were injected with intervening periods of 30–60 minutes, showed stable heterogeneity, thereby indicating that prior injections did not result in increasing variability in deposition densities and estimated flows.) In the right ventricle the relative dispersions of the flow distributions were larger and the relative dispersions averaged 0.54 with the chest closed and 0.69 with the chest opened.
Fig. 6.
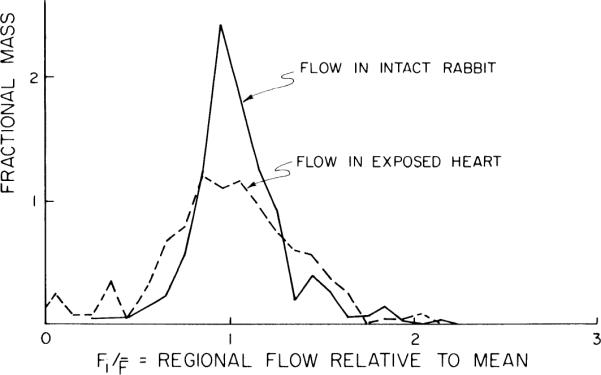
Probability density functions of regional flows in ~0.1-g pieces of left ventricular myocardium of an anesthetized rabbit. Microspheres labeled with 46Sc were injected into apical region of left ventricular cavity 5 min before thoracotomy [solid line, intact rabbit, relative dispersion (RD) = 0.25] and 95Nb-labeled microspheres a few seconds after (dashed line, exposed heart, RD = 0.37).
Volume vs. flow comparisons
The relationship between the volumes of distribution and flows in the individual heart pieces were investigated for the left and right ventricles. In the left ventricle the red cell, plasma, vascular, and sodium volumes decreased significantly with increasing flow (P < 0.05 for slope = 0). A particularly steep diminution of VV with respect to regional blood flow FB is shown in Fig. 7A. Also the hematocrits in left ventricular myocardium decreased significantly with increasing flow, suggesting a higher fraction of smaller vessels in high flow regions. In the right ventricle none of the volumes were statistically significantly related to flow. The regression lines for the various spaces in the left ventricle are plotted vs. FB in Fig. 7B. The slopes are so gentle that this flow dependency should not be overemphasized. Even so, it is interesting to note that in the regions with the higher flows the vascular components occupy less volume and the water content is if anything a little higher. This suggests that the highest flow regions contain more myocardial cells, with a high water content, and fewer erythrocytes, which are relatively dry. This suggestion would fit the prospect that there are fewer large vessels in regions of high tissue flow, an obvious point since microspheres are trapped only in capillaries and sometimes small arterioles.
Fig. 7.

Regional volumes of distribution and regional flows. Abscissa is regional capillary blood flow (FB). A: vascular volume (VV) vs. flow in experiment with steepest relationship. Regression line is VV = 0.22 – 0.08 FB. B: volumes of distribution vs. regional flow for all pieces of left ventricles of 6 rabbits. Higher flow regions have smaller vascular volumes, but interstitial fluid space volume appeared unaffected and water snace volume may be slightly higher.
Volume ratios
The ratios of volumes within individual pieces of heart were examined as a function of flow, since the regression lines of Fig. 7 suggest that VW and VISF increase with flow but that VRBC and VP diminish. In 260 left ventricular pieces, VISF/VV averaged 1.92 ± 0.79 (mean ± SD). In these same pieces, VW/VV = 7.32 ± 2.71. Neither was related to the regional flow. These ratios are much smaller than the ratios of extravascular volumes to capillary volumes because these tissue samples contain also blood in arteries and veins.
Local vascular volumes and hematocrits
The red cell vs. plasma volumes were the only ones significantly correlated, having correlation coefficients ranging between 0.965 and 0.990 for the six experiments individually. The slopes in individual experiments ranged ~1.2–1.3, with intercepts for VRBC = 0 ranging from VP = 0.014 to 0.026 ml/g, indicating that the intraregional hematocrits are lowest in regions with small blood volumes and highest where the blood volume is large. This is best demonstrated for the six hearts by normalizing VRBC and VP relative to their means for each individual heart; these are plotted in Fig. 8. The intercept for VRBC = 0 is at or, given an average VP of 0.107 ml/g from Table 1, at VP = 0.021 ml/g. This small excess plasma suggests the existence of a plasma sheath in capillaries not available to erythrocytes, or plasma skimming in some vessels.
Fig. 8.
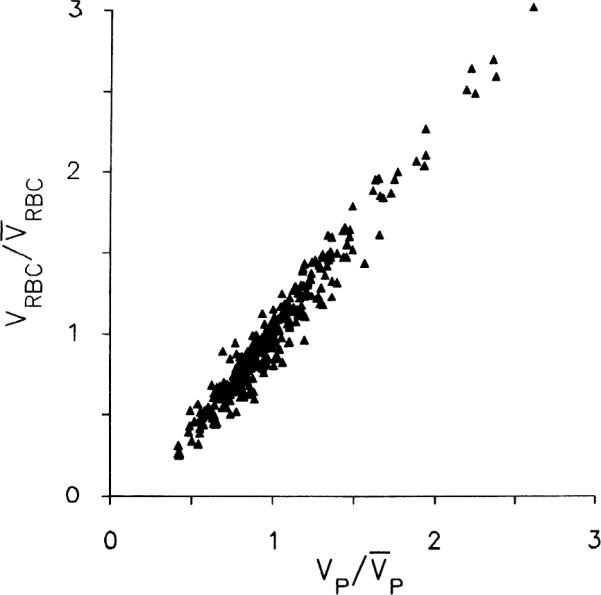
Relationship between erythrocyte volume of distribution (VRBC) and regional plasma volume (VP) in left ventricular myocardium of 6 rabbits. Ordinate is VRBC for each piece of tissue divided by average of VRBCS for whole left ventricle of same rabbit. Abscissa is constructed the same way for VP. Regression line (minimizing perpendiculars) is (where overbar denotes mean value), with a correlation coefficient of 0.977. Note that both VP and VRBC exhibit strongly skewed distribution ranging from 30 to 40% of mean to >250% of mean.
Because there was also some possibility that during the 20-min equilibration some tracer albumin might penetrate the capillary walls, which would give an exaggerated value for VP and for the intercept, two experiments were done specifically with 51Cr-RBC and 131I-albumin, allowing 5 min for intramyocardial intravascular mixing and then freezing the heart suddenly. The data for VRBC vs. VP in the left ventricle were similar to those shown in Fig. 6: the regression lines were VRBC = −0.01 + 0.37 VP (r = 0.99, N = 56) and VRBC = −0.01 + 0.42 VP (r = 0.99, N = 56). The regression for one of these experiments is plotted in Fig. 9A and the regional hematocrits from Eq. 4 are plotted from the same experiment in Fig. 9B.
Fig. 9.

Regional hematocrits vs. vascular volume. A: in one of the experiments allowing only 5 min for intravascular mixing, erythrocyte volume (VRBC) is plotted vs. plasma volume (VP) as in Fig. 8, for left ventricular myocardium only. B: regional hematocrit (Hct) is plotted as a fraction of large-vessel hematocrit (HctLV) vs. regional vascular volume (VV); it is lowest in regions having small vascular volumes. Curved line is same regression equation of A for this one heart, now plotted as Hct vs. VV. Lowest regional hematocrits are ~60% of HctLV. These data may be compared with those in C. C: data of Barbee and Cokelet (2) on Fahraeus-Lindqvist effect in glass tubes showing diminution of Hct in tubes of <300 μm in diameter for comparison with B.
Figure 9C is taken from the data of Barbee and Cokelet (2) and Fahraeus and Lindqvist (18) obtained on red cell suspensions flowing through glass tubes. The implication obtained by comparing B and C of Fig. 9 is that in the regions of the heart where the vascular content is low the vessel diameters must be small enough to restrict the red cell space. The corollary is that red cell transit times must be shorter than plasma transit times through the heart, as has regularly been observed from paired erythrocyte and plasma coronary sinus outflow indicator dilution curves (e.g., Ref. 45).
Mean transit times
These were calculated by Eqs.12–14 and 16, i.e.; the regional volumes divided by the particular regional flows were shortest for the vascular indicators and longest for water. The distribution of the transit times relative to the mean for each indicator is shown in Fig. 10 for the whole heart using the values of FB before thoracotomy. The distributions are right skewed. The increase in the heterogeneity of flows after the heart was exposed resulted in a 35–50% increase in the calculated transit time heterogeneity and an increased right skewness characterized by a 30–40% shift in the mode to the left of the mean.
Fig. 10.
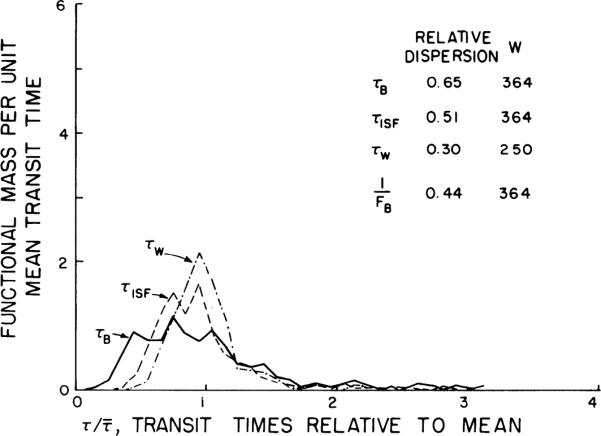
Probability density functions of transit times for water (τW), interstitial fluid (τISF), and blood spaces (τB) from data on individual pieces from whole heart. Transit time, τ, is a mean for each piece, volume of distribution divided by relevant flow: τB = VV/FB, τISF = VISF/VP, and τW = VW/FW (see Eq. 16), VV, VISF, VP, and VW are distribution of volumes for vascular, interstitial fluid, plasma, and water spaces and FB and FW are regional blood and water flows.
The relative dispersions of the transit times were greatest for blood and least for water. This was because the relative dispersion of the vascular volume was greatest and the relative dispersion of the water volume was least, with ISF volume being intermediate. In the closed chest the relative dispersion for τB was 2.2 times that for τW, whereas in the open chest, which had a greater flow heterogeneity, the relative dispersion for τB was only 10% greater than that for τW. Therefore volume heterogeneity has a more obvious effect when flow heterogeneity is smaller, as expected since F is in the denominator of the expression τ = V/F.
In the left ventricle the trends in the transit time data were the same as for the whole heart, except that the relative dispersions were slightly less, being 0.62, 0.39, and 0.21 for τB, τISF, and τW, respectively, when the chest was closed, and 0.85, 0.72, and 0.71 for τB, τISF, and τW, respectively, after the chest was open.
The calculated distributions of transit times through the vascular space are more dispersed than is actually observed in the intact coronary circulation: Knopp et al. (30) found relative dispersions of only 0.38 ± 0.05 (N = 60) for transcoronary plasma protein indicator. This difference is surely partly explained by the difference in the experiments, particularly in that the vascular volumes in this study are the most subject to artifactual variation as the heart is being frozen. For water, the calculations are much less subject to error; as probable evidence, the spread of the water-dilution curves in the isolated dog hearts obtained by Yipintsoi et al. (50) appears to be about the same as that shown in Fig. 10.
DISCUSSION
This method of freezing and sectioning the heart to determine the heterogeneity of the volumes of distribution has the advantage that there was no loss of fluid or tracer during the procedure. Also, since the heart was frozen in vivo and immediately stopped beating, no major fluid or volume shifts are expected to have occurred across distances equivalent to the piece sizes. One problem with the technique is that the heart had to be exposed for freezing [in the fashion of Rakusan (40) and Everett et al. (17)], which probably changed the spatial distribution of vascular volumes to some extent. Presumably these effects are not large, since the maximum effects might be between endocardium and epicardium, and large differences were not seen.
The relationships of volumes to flows and the calculations of transit times are critically dependent on the accuracy of regional flow estimates by microspheres. The data of King et al. (28) in 0.1-g pieces of hearts from awake normal baboons showed methodological variation of ~10% standard deviation. Bassingthwaighte et al. (8) found standard deviations of 8% in rabbits; so these error estimates should be applicable to this study. The study of Bassingthwaighte et al. (7) shows that the error for counting tissue samples for the content of diffusible markers is <4%. All of these show that the technical sources of error are much less than the estimated volume variation.
The main objective of this study was to determine the mean volumes of distribution in the intact rabbit heart. A comparison of our estimates with those of other investigators can be made from Table 3. Our values for VP and VRBC are larger than those of Myers and Honig (35), even though their methods were similar to ours; their red cell and plasma volumes were 44 and 68% smaller than ours. Gibson et al. (20) obtained similarly low values in dog hearts from which the blood had been allowed to leak passively after death, 0.022 ml/g for VRBC and 0.049 ml/g for VP. However, our values are comparable to those of Ziegler and Goresky (54). The sodium and sucrose spaces and the histological ECF observations are listed in Table 3 for a comparison of the methods used for the estimation of ECF volume. As expected, the sodium spaces were larger than the sucrose spaces since the sodium enters the cells. Probably the best estimates of ECF volume are those of Bridge et al. (11) of 0.31 ± 0.06 ml/g, which are somewhat larger than the sucrose spaces of the other in vivo preparations listed in Table 3, ranging from 0.15 to 0.27 ml/g.
TABLE 3.
Comparison of myocardial volumes of distribution
| Animal | Preparation | VRBC | VP | VNa | VSuc | VW | Ref. |
|---|---|---|---|---|---|---|---|
| Rat | Intact, K+ arrest 8 min equil | 0.023±0.006 | 0.052±0.003 | Rakusan (40) | |||
| In vivo 33–240 min equil | 0.176±0.006 | 0.769±0.006 | Polimeni (39) | ||||
| In vivo 130 min equil | 0.205±0.019 | Macchia et al. (32) | |||||
| Rabbit | Isolated perf 10 min equil | 0.396±0.038 | Johnson and Simonds (26) | ||||
| In vivo 25 min equil | 0.314±0.056 | Bridge et al. (11) | |||||
| in vivo 50 min equil | 0.039±0.016 | 0.101±0.034 | 0.349±0.041 | 0.32±0.031 | 0.795±0.025 | This study | |
| Dog | Isolated perf indicator dil | 0.37±0.19 | Guller et al. (22) | ||||
| In vivo indicator dil | 0.066±0.11 | Morgenstern et al. (34) | |||||
| In vivo indicator dil | 0.099±0.026 | 0.125±0.030 | 0.272±0.067 | 0.77±0.03 | Ziegler and Goresky (54) | ||
| In vivo 10 min equil | 0.17±0.05 | 0.78±0.01 | Harris et al. (23) | ||||
| In vivo indicator dil | 0.15±0.04 | Harris et al. (23) | |||||
| In vivo 2 min equil | 0.022±0.004 | 0.033±0.008 | Myers and Honig (35) |
Values are means ± SD. Volume distributions (V): RBC, erythrocytes; P, plasma; Na, sodium; Suc, sucrose; W, water. VP, VNa, and VSuc are reported as ml of plasma-equivalent volume/g of tissue.
In the comparisons of the regional volumes, flows, and relative hematocrits and in comparisons between volumes and flows in individual pieces, we found that the red cell, plasma, vascular, sodium, and ISF volumes and relative hematocrits were lowest in regions with higher flows. The lowest ratios of tissue hematocrit to large-vessel hematocrit were in the regions with the smallest blood content, regions presumably devoid of large vessels and therefore demonstrating the red cell exclusion effect (18) maximally, the lowest ratios being ~0.6. There may be many vessels with even lower ratios, but these would not be observed if averaged with vessels having diameters over 40 μm. Even so, Rakusan (40) observed in suddenly frozen rat hearts hematocrit ratios of 63.7 ± 3.9% (SD, N = 9) in normal rats, and Rakusan and Rajhathy (41) observed ratios of 66 and 72%, not changing in anemia or polycythemia. The values found by Everett et al. (17), also in quick frozen rat hearts, were higher, 74% in male and 91% in female rats. These values are much higher than the 55% we calculate from data in Table IV of Gibson et al. (20) in dogs killed with pentobarbital; it is likely that allowing the blood to drain out of the organs leaves blood in only the minute vessels, as was their intention, which necessarily produces a bias toward lower ratios.
Our main objective was the determination of the heterogeneity of the volumes of distribution and the question of its importance in modeling capillary-tissue exchange in the heart. The red cell, plasma, and vascular volumes had the greatest heterogeneity with relative dispersions of ~2 times that of the sodium space and almost 10 times that of the water volumes. This large degree of heterogeneity most likely reflects the variations in the regional composition of capillary density vs. large-vessel density. The volume vs. flow comparisons indicated 3–33% changes in the volumes per 1-ml·g−1·min−1 change in flow, but these data were not highly correlated and do not account for much of the heterogeneity. In a comparison of the volumes only the red cell vs. plasma volume gave a significant correlation. The close functional relationship between the red cell and plasma volumes indicates the interdependence of the red cell, plasma, and vascular volumes, thus explaining their similar relative dispersions. This relationship is very useful in that either a red cell or plasma tracer can be used to give a good indication of the heterogeneity of the vascular volume.
That these volumes should vary with the state of the animal is not surprising. Vascular volumes must be most subject to rapid changes; Morgenstern et al. (34) observed in dogs that at a coronary perfusion pressure of 70 mmHg the blood control of the heart, estimated from indocyanine green mean transit times was 0.178 ml/g at 170 mmHg. Hoffman and Ritman (25) noted that intravascular volume increased with coronary blood flow to levels ~25% at flows of 5 ml·g−1·min−1
From the point of view of blood-tissue exchange modeling, the quantitative evaluation of the importance of this heterogeneity remains unknown. Bronikowski et al. (12) and Bassingthwaighte and Goresky (6) showed the influences of flow on estimates of parameters for exchange, particularly capillary permeability-surface area products, but not of volume heterogeneity. Others have used regional flow or transit time variations in modeling (3, 24, 38, 42, 43) but have not considered volume heterogeneity or assessed the effects of flow heterogeneity on parameter estimation.
Ziegler and Goresky (54), Bassingthwaighte (4), and Rowlett and Harris (46) showed in their modeling that although the vascular volumes influence the capillary transit times, it is the ratio of VISF to intracapillary volume that dominates the rate of return of tracer from ISF to capillary blood. Our observations are that even though VISF/VP has a relative dispersion of 50% when all of the heart pieces are used in the calculation, the dispersion is much narrower in those pieces in which the blood content is low, i.e., those pieces not containing many large vessels. In these, the ratio VISF/VP ranges from 3 to 5, and the variation is not statistically different from that in VP alone. If true, this would help to keep the modeling simplified by using VISF/VP as a constant. Further experiments with a purely extracellular, an erythrocyte, and a plasma label would be helpful to determine more precisely the variation in VISF/VP; clearly the scatter in the estimates of VNa detracts from our ability to assess this situation, but since it is VISF divided by the capillary plasma volume that is important, we will always be left with the difficult problem of distinguishing plasma in capillaries from that in larger vessels. O'Keefe et al. (36) have attempted to use histological point-counting methods to this end, estimating that the capillary-to-large-vessel volume ratios were ~27.2:4.9 or over 5-fold in normal dogs and 26.8:5.8 or ~4.5-fold in hypertrophied hearts. It would be useful to know the constancy of VISF/VP, especially for organs with highly variable flow; for example, Creese et al. (15) observed large changes in both inulin space (VECF and blood space in stimulated skeletal muscle. Another source of variation is the form and stage of development of the organ; e.g., Burr and McLennan (14) observed that the interstitial space is much larger in small skeletal muscles than in large ones.
In the modeling of capillary-tissue exchange it is the distribution of overall transit times through the heart that determines the shapes of indicator-dilution curves, but it is the variance of capillary transit times that affects the estimation of permeability-surface area products for the capillary and cell membranes. These are not yet well defined, nor is the relationship between large vessel and capillary transit times. Data on these points and on VISF/VP in capillary-tissue regions remain critically needed for improved analysis of multiple indicator-dilution curves or tracer washin or washout curves.
In summary, the heterogeneities of the volumes of distribution of both intravascular and extravascular labels in the nearly intact rabbit heart are considerable and therefore merit consideration in the analysis of experiments concerning the kinetics of blood-tissue exchange. Vascular volumes are smaller in high flow regions than in regions in which microsphere deposition densities are low; this finding is interpreted as corollary to the principle that highly cellular regions contain only capillaries and are relatively devoid of large arteries and veins. The intratissue hematocrits are lowest in these high-flow regions of low vascular volume, in accordance with a graded diminution in the fractional volume available to erythrocytes with diminished vessel diameters, the Fahraeus-Lindqvist effect.
Acknowledgments
This study was supported by National Institutes of Health Grants HL-19139 and RR-01243.
REFERENCES
- 1.Altman PL, Dittmer DS, editors. Respiration and Circulation. FASEB; Bethesda, MD: 1971. [Google Scholar]
- 2.Barbee JH, Cokelet GR. The Fahraeus effect. Microvasc. Res. 1971;3:6–16. doi: 10.1016/0026-2862(71)90002-1. [DOI] [PubMed] [Google Scholar]
- 3.Bass L, Robinson PJ. Effects of capillary heterogeneity on rates of steady uptake of substances by the intact liver. Microvasc. Res. 1981;22:43–57. doi: 10.1016/0026-2862(81)90110-2. [DOI] [PubMed] [Google Scholar]
- 4.Bassingthwaighte JB. A concurrent flow model for extraction during transcapillary passage. Circ. Res. 1974;35:483–503. doi: 10.1161/01.res.35.3.483. [DOI] [PMC free article] [PubMed] [Google Scholar]
- 5.Bassingthwaighte JB, Dobbs WA, Yipintsoi T. Heterogeneity of myocardial blood flow. In: Maseri A, editor. Myocardial Blood Flow in Man: Methods and Significance in Coronary Disease. Minerva Medica; Torino, Italy: 1972. pp. 197–205. [Google Scholar]
- 6.Bassingthwaighte JB, Goresky CA. Handbook of Physiology. The Cardiovascular System. Microcirculation. IV. Am. Physiol. Sot.; Bethesda, MD: 1984. Modeling in the analysis of solute and water exchange in the microvasculature; pp. 549–626. sect. 2. chapt. 13. [Google Scholar]
- 7.Bassingthwaighte JB, Malone MA, Moffett TC, King RB, Chan IS, Link JM, Krohn KA. Molecular and particulate depositions for regional myocardial flows in sheep. Circ. Res. 1990;66:1328–1344. doi: 10.1161/01.res.66.5.1328. PMCID: PMC3529659. [DOI] [PMC free article] [PubMed] [Google Scholar]
- 8.Bassingthwaighte JB, Malone MA, Moffett TC, King RB, Little SE, Link JM, Krohn KA. Validity of microsphere depositions for regional myocardial flows. Am. J. Physiol. 1987;253(Heart Circ. Physiol. 22):H184–H193. doi: 10.1152/ajpheart.1987.253.1.H184. [DOI] [PMC free article] [PubMed] [Google Scholar]
- 9.Bassingthwaighte JB, Strandell T, Donald DE. Estimation of coronary blood flow by washout of diffusible indicators. Circ. Res. 1968;23:259–278. doi: 10.1161/01.res.23.2.259. [DOI] [PMC free article] [PubMed] [Google Scholar]
- 10.Boggs PT, Byrd RH, Schnabel RB. A stable and efficient algorithm for nonlinear orthogonal distance regression. SIAM J. Sci. Stat. Comput. 1987;8:1052–1078. [Google Scholar]
- 11.Bridge JH, Bersohn MM, Gonzalez F, Bassingthwaighte JB. Synthesis and use of radio cobaltic EDTA as an extracellular marker in rabbit heart. Am J Physiol. 1982 Apr;242(4):H671–H676. doi: 10.1152/ajpheart.1982.242.4.H671. [DOI] [PMC free article] [PubMed] [Google Scholar]
- 12.Bronikowski TA, Linehan JH, Dawson CA. A mathematical analysis of the influence of perfusion heterogeneity on indicator extractions. Math. Biosci. 1980;52:27–51. [Google Scholar]
- 13.Buckberg GD, Luck JC, Payne BD, Hoffman JIE, Archie JP, Fixler DE. Some sources of error in measuring regional blood flow with radioactive microspheres. J. Appl. Physiol. 1971;31:598–604. doi: 10.1152/jappl.1971.31.4.598. [DOI] [PubMed] [Google Scholar]
- 14.Burr LH, Mclennan H. The apparent extracellular space of mammalian skeletal muscle. A comparison of the inulin space in normal and dystrophic mouse tissues. Can. J. Biochem. PhysioZ. 1960;38:829–835. [PubMed] [Google Scholar]
- 15.Creese R, D'Silva JL, Hashish SEE. Inulin space and fibre size of stimulated rat muscle. J. Physiol. Lond. 1955;127:525–532. doi: 10.1113/jphysiol.1955.sp005274. [DOI] [PMC free article] [PubMed] [Google Scholar]
- 16.Effros RM, Chinard FP. The in vivo pH of the extravascular space of the lung. J. Clin. Invest. 1969;48:1983–1996. doi: 10.1172/JCI106164. [DOI] [PMC free article] [PubMed] [Google Scholar]
- 17.Everett NB, Simmons B, Lasher EP. Distribution of blood (Fe59) and plasma (I131) volumes of rats determined by liquid nitrogen freezing. Circ. Res. 1956;4:419–424. doi: 10.1161/01.res.4.4.419. [DOI] [PubMed] [Google Scholar]
- 18.Fahraeus R, Lindqvist T. The viscosity of the blood in narrow capillary tubes. Am. J. Physiol. 1931;96:562–568. [Google Scholar]
- 19.Franzen D, Conway RS, Zhang H, Sonnenblick EH, Eng C. Spatial heterogeneity of local blood flow and metabolite content in dog hearts. Am. J. Physiol. 1988;254(Heart Circ. Physiol. 23):H344–H353. doi: 10.1152/ajpheart.1988.254.2.H344. [DOI] [PubMed] [Google Scholar]
- 20.Gibson JG, Seligman AM, Peacock WC, Aub JC, Fine J, Evans RD. The distribution of red cells and plasma in large and minute vessels of the normal dog, determined by radioactive isotopes of iron and iodine. J. Clin. Invest. 1946;25:848–857. doi: 10.1172/JCI101772. [DOI] [PMC free article] [PubMed] [Google Scholar]
- 21.Gorman MW, Wangler RD, Sparks HV. Distribution of perfusate flow during vasodilation in the isolated guinea pig heart. Am. J. Physiol. 1989;256(Heart Circ. Physiol. 25):H297–H301. doi: 10.1152/ajpheart.1989.256.1.H297. [DOI] [PubMed] [Google Scholar]
- 22.Guller B, Yipintsoi T, Orvis AL, Bassingthwaighte JB. Myocardial sodium extraction at varied coronary flows in the dog: Estimation of capillary permeability by residue and outflow detection. Circ. Res. 1975;37:359–378. doi: 10.1161/01.res.37.3.359. [DOI] [PMC free article] [PubMed] [Google Scholar]
- 23.Harris TR, Burks DD, Custer PL. Coronary capillary permeability and tissue volumes for sucrose and water in dogs: a comparison of bolus and constant infusion multiple indicator techniques. Cardiovasc. Res. 1978;12:537–546. doi: 10.1093/cvr/12.9.537. [DOI] [PubMed] [Google Scholar]
- 24.Hertz MM, Paulson OB. Heterogeneity of cerebral capillary flow in man and its consequences for estimation of blood-brain barrier permeability. J. Clin. Invest. 1980;65:1145–1151. doi: 10.1172/JCI109769. [DOI] [PMC free article] [PubMed] [Google Scholar]
- 25.Hoffman EA, Ritman EL. Intramyocardial blood volume—implications for analysis of myocardial mechanical characteristics via in vivo imaging of the heart. In: Sideman S, Beyar R, editors. Electromechanical Activation, Metabolism and Perfusion of the Heart. Nijhoff; Boston, MA: 1987. pp. 421–432. [Google Scholar]
- 26.Johnson JA, Simonds MA. Chemical and histological space determinations in rabbit heart. Am. J. Physiol. 1962;202:589–592. doi: 10.1152/ajplegacy.1962.202.3.589. [DOI] [PubMed] [Google Scholar]
- 27.Joseph NR, Engel MB, Catchpole HR. Distribution of ions in biological systems. Nature Lond. 1965;206:6–10. [Google Scholar]
- 28.King RB, Bassingthwaighte JB, Hales JRS, Rowell LB. Stability of heterogeneity of myocardial blood flow in normal awake baboons. Circ. Res. 1985;57:285–295. doi: 10.1161/01.res.57.2.285. [DOI] [PMC free article] [PubMed] [Google Scholar]
- 29.Klocke FJ, Koberstein RC, Pittman DE, Bunnell IL, Greene DG, Rosing DR. Effects of heterogeneous myocardial perfusion on coronary venous H2 desaturation curves and calculations of coronary flow. J. Clin. Invest. 1968;47:2711–2724. doi: 10.1172/JCI105954. [DOI] [PMC free article] [PubMed] [Google Scholar]
- 30.Knopp TJ, Dobbs WA, Greenleaf JF, Bassingthwaighte JB. Transcoronary intravascular transport functions obtained via a stable deconvolution technique. Ann. Biomed. Eng. 1976;4:44–59. doi: 10.1007/BF02363557. [DOI] [PMC free article] [PubMed] [Google Scholar]
- 31.Kuikka J, Levin M, Bassingthwaighte JB. Multiple tracer dilution estimates of D- and 2-deoxy-D-glucose uptake by the heart. Am. J. Physiol. 1986;250(Heart Circ. Physiol. 19):H29–H42. doi: 10.1152/ajpheart.1986.250.1.H29. [DOI] [PMC free article] [PubMed] [Google Scholar]
- 32.Macchia DD, Page E, Polimeni PI. Interstitial anion distribution in striated muscle determined with [35S]sulfate and [3H]sucrose. Am. J. Physiol. 1979;237(CeZL Physiol. 6):C125–C130. doi: 10.1152/ajpcell.1979.237.3.C125. [DOI] [PubMed] [Google Scholar]
- 33.Macleod J. Red-cell density in certain common animals. Q. J. Exp. Physiol. 1932;22:275–280. [Google Scholar]
- 34.Morgenstern C, Hölges U, Arnold G, Lochner W. The influence of coronary pressure and coronary flow on intracoronary blood volume and geometry of the left ventricle. PfZuegers Arch. 1973;340:101–111. doi: 10.1007/BF00588169. [DOI] [PubMed] [Google Scholar]
- 35.Myers WW, Honig CR. Number and distribution of capillaries as determinants of myocardial oxygen tension. Am. J. Physiol. 1964;207:653–660. doi: 10.1152/ajplegacy.1964.207.3.653. [DOI] [PubMed] [Google Scholar]
- 36.O'Keefe DD, Hoffman JIE, Cheitlin R, O'Neill MJ, Allard JR, Shapkin E. Coronary blood flow in experimental canine left ventricular hypertrophy. Circ. Res. 1978;43:43–51. doi: 10.1161/01.res.43.1.43. [DOI] [PubMed] [Google Scholar]
- 37.Page E. Cat heart muscle in vitro. III. The extracellular space. J. Gen. Physiol. 1962;46:201–213. doi: 10.1085/jgp.46.2.201. [DOI] [PMC free article] [PubMed] [Google Scholar]
- 38.Perl W, Effros RM, Chinard FP. Indicator equivalence theorem for input rates and regional masses in multi-inlet steady-state systems with partially labeled input. J. Theor. Biol. 1969;25:297–316. doi: 10.1016/s0022-5193(69)80065-2. [DOI] [PubMed] [Google Scholar]
- 39.Polimeni PI. Extracellular space and ionic distribution in rat ventricle. Am. J. Physiol. 1974;227:676–683. doi: 10.1152/ajplegacy.1974.227.3.676. [DOI] [PubMed] [Google Scholar]
- 40.Rakusan K. Vascular capacity and hematocrit in experimental cardiomegaly due to aortic constriction in rats. Can. J. Physiol. Pharmacol. 1971;49:819–823. [PubMed] [Google Scholar]
- 41.Rakusan K, Rajhathy J. Distribution of cardiac output and organ blood content in anemic polycythemic rats. Can. J. Physiol. Pharmacol. 1972;50:703–710. doi: 10.1139/y72-102. [DOI] [PubMed] [Google Scholar]
- 42.Roberts GW, Larson KB, Spaeth EE. The interpretation of mean transit time measurements for multiphase tissue systems. J. Theor. Biol. 1973;39:447–475. doi: 10.1016/0022-5193(73)90111-2. [DOI] [PubMed] [Google Scholar]
- 43.Rose CP, Goresky CA. Vasomotor control of capillary transit time heterogeneity in the canine coronary circulation. Circ. Res. 1976;39:541–554. doi: 10.1161/01.res.39.4.541. [DOI] [PubMed] [Google Scholar]
- 44.Rose CP, Goresky CA, Bach GG. The capillary and sarcolemmal barriers in the heart: An exploration of labeled water permeability. Circ. Res. 1977;41:515–533. doi: 10.1161/01.res.41.4.515. [DOI] [PubMed] [Google Scholar]
- 45.Roth AC, Feigl EO. Diffusional shunting in the canine myocardium. Circ. Res. 1981;48:470–480. doi: 10.1161/01.res.48.4.470. [DOI] [PubMed] [Google Scholar]
- 46.Rowlett RD, Harris TR. A comparative study of organs, models, and numerical techniques for the evaluation of capillary permeability from multiple-indicator data. Math. Biosci. 1976;29:273–298. [Google Scholar]
- 47.Stahl LD, Weiss HR, Becker LC. Myocardial oxygen consumption, oxygen supply/demand heterogeneity and microvascular patency in regionally stunned myocardium. Circulation. 1988;77:865–872. doi: 10.1161/01.cir.77.4.865. [DOI] [PubMed] [Google Scholar]
- 48.Tripp MR, Meyer MW, Einzig S, Leonard JJ, Swayze CR, Fox IJ. Simultaneous regional myocardial blood flows by tritiated water and microspheres. Am. J. Physiol. 1977;232(Heart Circ. Physiol. 1):H173–H190. doi: 10.1152/ajpheart.1977.232.2.H173. [DOI] [PubMed] [Google Scholar]
- 49.Williamson JH. Least-squares fitting of a straight line. Can. J. Phys. 1968;46:1845–1847. [Google Scholar]
- 50.Yipintsoi T, Bassingthwaighte JB. Circulatory transport of iodoantipyrine and water in the isolated dog heart. Circ. Res. 1970;27:461–477. doi: 10.1161/01.res.27.3.461. [DOI] [PMC free article] [PubMed] [Google Scholar]
- 51.Yipintsoi T, Dobbs WA, Jr., Scanlon PD, Knopp TJ, Bassingthwaighte JB. Regional distribution of diffusible tracers and carbonized microspheres in the left ventricle of isolated dog hearts. Circ. Res. 1973;33:573–587. doi: 10.1161/01.res.33.5.573. [DOI] [PMC free article] [PubMed] [Google Scholar]
- 52.Yipintsoi T, Scanlon PD, Bassingthwaighte JB. Density and water content of dog ventricular myocardium. Proc. Soc. Exp. Biol. Med. 1972;141:1032–1035. doi: 10.3181/00379727-141-36927. [DOI] [PMC free article] [PubMed] [Google Scholar]
- 53.York D. Least-squares fitting of a straight line. Can. J. Phys. 1966;44:1079–1086. [Google Scholar]
- 54.Ziegler WH, Goresky CA. Transcapillary exchange in the working left ventricle of the dog. Circ. Res. 1971;29:181–207. doi: 10.1161/01.res.29.2.181. [DOI] [PubMed] [Google Scholar]