

Abstract
Triple negative breast cancer (TNBC) is known to contain a high percentage of CD44+/CD24−/low cancer stem cells (CSC), corresponding with a poor prognosis despite systemic chemotherapy. Chloroquine (CQ), an anti-malarial drug, is a lysotropic reagent which inhibits autophagy. CQ was identified as a potential CSC inhibitor through in silico gene expression signature analysis of the CD44+/CD24−/low CSC population. Autophagy plays a critical role in adaptation to stress conditions in cancer cells, and is related with drug resistance and CSC maintenance. Thus the objectives of this study were to examine the potential enhanced efficacy arising from addition of chloroquine (CQ) to standard chemotherapy (paclitaxel) in TNBC and to identify the mechanism by which CQ eliminates CSCs in TNBCs. Herein, we report that CQ sensitizes TNBC cells to paclitaxel through inhibition of autophagy and reduces the CD44+/CD24−/low CSC population in both preclinical and clinical settings. Also, we are the first to report a mechanism by which CQ regulates the CSCs in TNBC through inhibition of the Janus-activated kinase 2 (Jak2) - Signal transducer and activator of transcription 3 (STAT3) signaling pathway by reducing the expression of Jak2 and DNA methyltransferase 1 (DNMT1).
Keywords: Breast Cancer Stem Cells, Autophagy, Chloroquine, DNMT1, Jak2
Introduction
Triple negative breast cancer (TNBC) is defined by the absence of expression of estrogen receptor, progesterone receptor, and human epidermal growth factor receptor 2 (Her2). It is an aggressive and lethal form of breast cancer with relative lack of targeted therapeutic options and poor prognosis1, 2. It constitutes roughly 15% of breast cancer cases and accounts for 25% of breast cancer mortality principally due to early relapse and frequent metastasis1, 2. In addition, TNBC has a higher percentage of CD44+/CD24−/low cancer stem cells (CSC) compared to other types of breast cancer1, 3. We have previously reported an enrichment of CD44+/CD24−/low CSCs following chemotherapy in women with locally advanced breast cancer, suggesting resistance of CSCs to conventional therapy4. As chemotherapy is the only choice of treatment for TNBC patients, a viable strategy is needed to target CSCs in addition to conventional chemotherapy5, 6.
Autophagy constitutes a salvage pathway for recycling nutrients that has been implicated in various aspects of cancer, including cell survival under stress conditions, drug resistance, and metastasis7, 8. Moreover, autophagy-mediated metabolic coupling between cancer cells and neighboring stromal cells has been identified as a mechanism of cancer survival, growth, and resistance to therapy9, 10. Additionally, recent reports emphasize critical roles of autophagy in maintenance of CSC self-renewal in breast cancer11, 12, leading to the exploration of potential anti-autophagy strategies for eliminating CSCs in preclinical and clinical studies.
Chloroquine (CQ) is an anti-malarial drug known to inhibit autophagy by disrupting lysosomal stability and function7. Previously, we identified a CD44+/CD24−/low MS-forming treatment-resistant gene expression signature using biopsies obtained from women with primary breast cancer4. Through network analysis of the gene signature, CQ was repositioned as a putative anti-cancer drug against CD44+/CD24−/low CSCs. Interestingly, CQ has been identified as a cancer stem cell targeting agent for other aggressive cancers including breast cancer11, 12, glioblastoma multiforme13, and chronic myeloid leukemia14. However, the mechanism by which CQ affects the CD44+/CD24−/low CSCs remains unclear.
We investigated the therapeutic potential of CQ in combination with paclitaxel (PTX) on the CD44+/CD24−/low CSC population, and determined the value and feasibility of incorporating CQ with chemotherapy for treatment of therapy-resistant TNBC. We hypothesized that CQ affects the CSC self-renewal through the inhibition of autophagy. Our findings suggest that CQ reduces the CD44+/CD24−/low CSCs population in TNBC cells through autophagy and by downregulation of Janus-activated kinase 2 (Jak2) signaling pathway with a concomitant inhibition of DNA methyltransferase 1 (DNMT1) expression.
Materials and Methods
Materials and Cell culture
Triple negative breast cancer cell lines (Hs578t, MDA-MB-231, HCC1937, and HCC38) were purchased from American Type Culture Collection (Manassas, VA, USA), with the exception of SUM159PT (Asterand, Detroit, MI). All cells were maintained in DMEM (Invitrogen, Grand Island, NY) and 10% FBS (Thermos Scientific Hyclone, Rockford, IL) in a humidified 5% CO2 incubator at 37°C. SUM159PT cells were first maintained in F12 (Invitrogen) containing 10% FBS, insulin (5 μg/ml), and hydrocortisone (1 μg/ml), then adjusted to DMEM (high glucose and glutamine) with 10% FBS. All chemicals were purchased from Sigma unless otherwise specified. Chloroquine was first dissolved in DPBS (Invitrogen) at the concentration of 0.1 M (kept in −80°C) and diluted further in DPBS (CQ 1 mM). All CD marker antibodies and mouse IgG isotype antibodies were purchased from BD Biosciences, San Jose, California. Rabbit polyclonal anti-p-Jak2, rabbit monoclonal anti-Jak2, rabbit polyclonal anti-pSTAT3-705, rabbit polyclonal anti-pSTAT3-727, mouse monoclonal STAT3, and mouse monoclonal anti-Actin antibodies were purchased from Cell Signaling Technology, Danvers, MA. Mouse monoclonal anti-DNMT1, rabbit polyclonal anti-SOCS1, and mouse monoclonal anti-SOCS3 were purchased from Santa Cruz Biotechnology Inc., Dallas, TX. SYTOX® Blue Nucleic Acid Stain (SYTOX-Blue) was purchased from Invitrogen for nuclear staining of dead cells.
In silico drug Repositioning for breast CSCs
Our previously published gene expression data of breast CSCs (CD44+/CD24−/low and MS-forming treatment-resistant cells) was used for in silico drug repositioning analysis (GSE7513, SE7515 and GSE10281)4. The Cancer Signaling Bridges (CSBs)–based drug repositioning computational modeling method was applied to derive specific CSCs signaling pathways15, 16.
Mammosphere Assay
Mammosphere (MS) assay was performed as previously described with minor modification4, 17. Modified methods are described in the Supplementary Materials and Methods.
Fluorescence-activated cell sorting (FACS) analysis
Cell lines and clinical samples were stained with antibodies against CD44-APC and CD24-FITC for FACS analysis and cell sorting as previously described17. A single-arm, phase two clinical trial (NCT01446016) is currently active and enrolling patients at our institution. Patients with metastasis or locally advanced breast cancer previously treated with anthracyclines underwent treatment with a combination of taxane and chloroquine. Biopsies were then obtained at baseline and at day 42 after treatment. FACS analysis and sorting was performed at the Houston Methodist Hospital Research Institute flow cytometry core using BD FACS Fortessa for FACS analysis of CSCs and BD FACS Aria II for cell sorting.
Western blot and Immunoprecipitation Assays
Western blotting and immunoprecipitation experiments were performed with the listed primary and matching secondary antibodies as described previously18. Detailed procedures are described in the Supplementary Materials and Methods.
In vivo experiments
All animal procedures were approved by the Methodist Hospital Research Institute Animal Care and Use Review Office. Athymic nude Mice (Hsd:Athymic Nude-Foxn1nu) (5 weeks old; 20–23 g) were purchased from Harlan Laboratories, Inc., Houston, TX. Detailed methods are described in the Supplementary Materials and Methods.
Immunofluorescence staining for the co-localization of Jak2 and SOCS3
Cells were fixed and stained using antibodies listed in Supplementary Materials and Methods as described previously18.
Real-Time PCR for SOCS1 and SOCS3
Real-Time PCR for SOCS1 and SOCS3 was performed as described previously17 with minor modifications. Detailed methods are described in the Supplementary Materials and Methods.
SOCS3 promoter PCR for methylation analysis
For the PCR primer design, sequences of proximal SOCS3 promoter regions (−5676 and +2633) was obtained from the NCBI reference sequence (NC_000017.10 GI:224589808) for Homo sapiens chromosome 17, GRCh37.p13 Primary Assembly. Primers were then designed using primer319 to result in about 200 to 250-bp of PCR products. The sequences and the site of each primer are indicated in Supplementary Table S1.
Methyl-CpG-binding domain proteins-enriched DNA sequencing (MBDCap-Seq) assay and data analysis
Methylated DNA from control and chloroquine-treated MDA-MB-231 cells was eluted using the MethylMiner Methylated DNA Enrichment Kit (Life Technologies) following the manufacturer’s instructions as described below. Genomic DNA was sonicated to ~300-bp fragments. Methylated DNA was captured by methyl-CpG-binding domain proteins and subsequently eluted in 1 M salt buffer for precipitation. Libraries were generated from eluted DNA (>10 ng) for single-end 50-bp sequencing following the protocols from Illumina (San Diego, CA). MBDCap-seq libraries were sequenced using the Illumina HiSeq 2000 system protocols. Image analysis and base calling were performed with the standard Illumina pipeline. Using the ELAND algorithm, unique reads (up to 50 bp reads) were mapped to the human reference genome (hg19) with Bowtie version 0.12.720 with reported parameters21. Further analysis of the MBDCap-seq data was performed by the Houston Methodist Research Institute Genomics Core as described in the Supplementary Materials and Methods.
Statistical Analysis
We used two-tailed Student’s t-test for comparison of two groups and one-way ANOVA for multiple group comparison. Two-way ANOVA was used for all animal experiments. Each value reported represents the mean of at least three replicate experiments with standard deviations. The values in the animal experiments represent the mean of 10 individual mice per group with standard error of the mean. Data were tested for normal distribution, and Student’s t-test and ANOVA were used to determine statistical significance. To account for multiple comparisons, Tukey’s multiple comparison tests for one-way ANOVA and Boneferroni post tests for two-way ANOVA were performed with Graphpad Prism 5.0 (Graphpad Software Inc., La Jolla, CA, USA). In all cases, p values < 0.05 were considered statistically significant.
All other materials and methods are described in the Supplementary Materials and Methods.
Results
In silico drug repositioning
Differentially expressed genes (p<0.001, Student’s t test) from the CD44+/CD24−/low and MS-forming treatment-resistant cells were used to identify CSC pathways (p<0.05, Fisher exact two-tailed test). The enriched pathways included: NOTCH, VEGF, PTEN, sonic Hedgehog, Wnt/β-catanin, JAK/STAT, P53, and PI3K/AKT signaling. The CSB-analysis was then performed to extend the incomprehensive pathways and establish cross-talks within pathways15, 16. The signaling networks included 140 gene nodes for the CD44+/CD24−/low cells (Fig 1A and Supplementary Fig. S1A) and 153 gene nodes for the MS-forming treatment-resistant cells (Supplementary Fig. S1B). After mapping all gene nodes to the drug database, a total of 21 drugs, including chloroquine, auranofin, and arsenic trioxide, were identified as candidate drugs which could target the CSC pathways. We chose to focus on chloroquine (CQ), which has been clinically used for several decades, displaying a safe toxicity profile, alone and in combination with paclitaxel.
Figure 1. Chloroquine targets breast CSCs of TNBC.
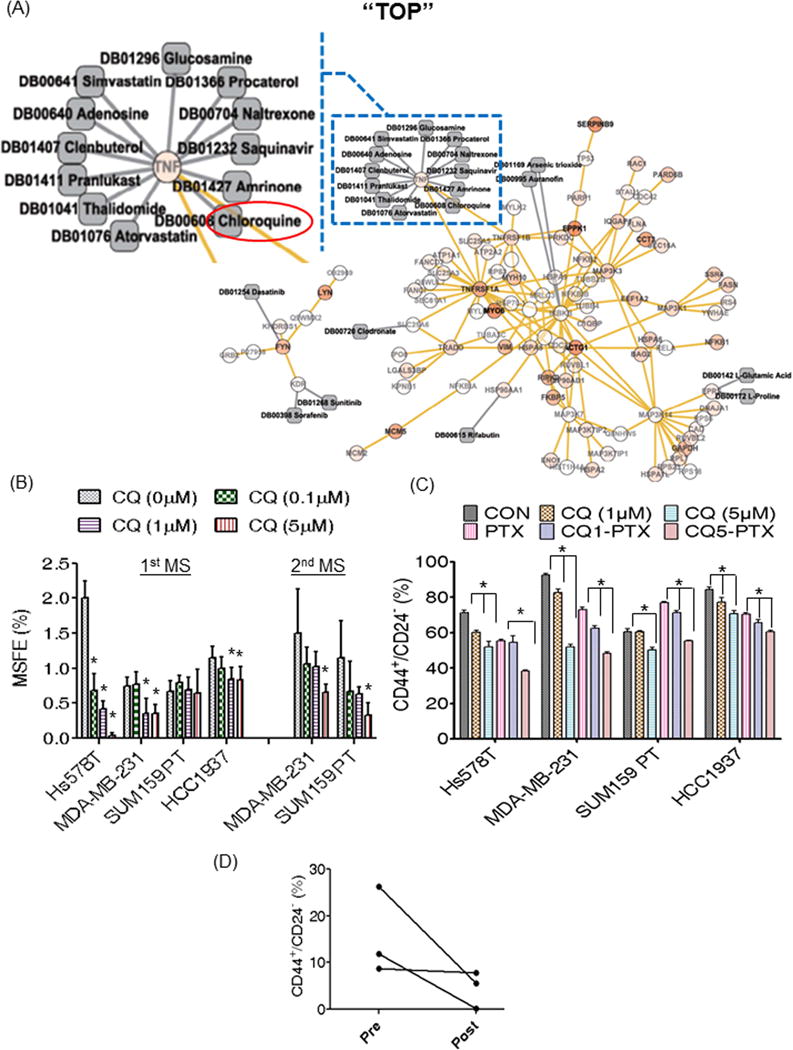
(A). Twenty-one FDA-approved drug targets on 7 signaling nodes in the network signaling pathway for CD44+/CD24−/low tumor cells. Circles denote gene nodes, yellow links are protein-protein interactions, grey squares are drugs, and grey links are drug-target interactions. The color of every gene node is determined by a statistical score, i.e. −log(P-value), where P-value is the student’s t test statistical value considering all of the probes’ value for the gene in the groups. The data scale is between 0 and 8. 0 is for no-color and 8 for dark red circle. A node in a blue rectangle is enlarged for better view. The red oval circle indicates chloroquine. The enlarged whole network is also presented in Supplementary Figure S1A. (B) CQ reduced primary MSFE of Hs578t, MDA-MB-231, and HCC1937 TNBCs and the secondary MSFE in MDA-MB-231 and SUM159PT cells in a dose-dependent manner. (C) CQ reduced the CD44+/CD24−/low CSC population alone or in combination with PTX. CQ1 and CQ5 indicates CQ at 1 μM or at 5 μM, respectively, while CQ1-PTX or CQ5-PTX indicates treatment with CQ at the corresponding doses in combination with PTX (5 nM). Groups treated with CQ alone were compared to control (B and C), and the combination treatment groups were compared to the PTX alone group (C). Con: control (DMSO), CQ: chloroquine, PTX: paclitaxel (in DMSO), and CQ-PTX: combination of chloroquine and paclitaxel. One-way ANOVA (Tukey) was used for statistical analysis. This figure represents the mean difference in suppression of MSFE or CD44+/CD24−/low CSC population with standard deviation. Asterisk indicates p<0.05. (D) CQ and PTX combination treatment reduced CD44+/CD24−/low CSCs in patients with drug resistant recurrent tumors. Pre indicates pre-treatment and post indicates post-treatment. The MS assay and FACS analysis for the CSCs were repeated at least three times with similar results. Representative results are shown.
CQ inhibits mammosphere formation and reduces CD44+/CD24−/low populations in TNBC cell lines
To determine whether CQ would have an effect on decreasing mammosphere forming efficiency (MSFE), we performed a dose response experiment for CQ in four different TNBC cell lines, Hs578t, MDA-MB-231, SUM159PT, and HCC1937 as shown in Fig. 1B. Even though sensitivity to CQ varied according to cell line, we found that CQ at 1 or 5 μM effectively decreased primary MSFE in Hs578t, MDA-MB-231, and HCC1937 TNBC cell lines (Fig. 1B), and also secondary MS formation in SUM159 and MDA-MB-231 cells (Fig. 1B) by specifically targeting the CD44+/CD24−/low populations (Supplementary Fig. S2A). Hs578t and HCC1937 cells did not form secondary MS under the same culture conditions. Similarly, we observed a significant dose-dependent reduction in CD44+/CD24−/low populations (15% to 50%) with CQ treatment alone or in combination with paclitaxel (PTX), correlating with the observed decrease in primary and secondary MSFE (Fig. 1C). Additionally, we found that CQ reduced breast CSCs identified by Aldehyde dehydrogenase1 (ALDH1) activity through ALDEFLUOR assay as described previously22. CQ alone showed significant reduction of ALDEFLUOR-positive cells in MDA-MB-231 (50-fold decrease) and SUM159PT (8-fold decrease) (Supplementary Fig. S2B).
CQ-PTX treatment reduced CD44+/CD24−/low population in patients
A clinical trial is currently underway to evaluate the efficacy of CQ in combination with PTX in women with treatment-refractory advanced or metastatic breast cancer. Consistent with in vitro results, the combination treatment of CQ and PTX reduced the CD44+/CD24−/low population by 5- to 6-fold in two patients after treatment cycles (Fig. 1D). However, a minimal reduction of the CSC population was observed in one patient. These results support the preclinical findings and confirm the potential for improved patient response resulting from the combination of CQ and taxane therapy.
Inhibition of autophagy by CQ sensitizes TNBC cells to Paclitaxel
We next investigated whether the reduction of CSCs by CQ could be correlated with inhibition of autophagy, thus sensitizing TNBCs to chemotherapy. Firstly, inhibition of autophagy was confirmed by observing accumulation of autophagosomes in Hs578t cells treated with CQ (1 μM) alone and in combination with PTX (5 nM) using TEM. Autophagosomes were not detected in either control or PTX-treated cells (Fig. 2A). Additionally, CQ induced puncta formation (green) and inhibited the formation of PTX-induced autophagolysosomes (yellow) in MDA-MB-468 cells, expressing GFP-tagged LC3B (Supplementary Fig. S3A). The inhibition of autophagy was further confirmed by detection of LC3B-II and up-regulated p62 in all cells treated with CQ alone or in combination with PTX (Fig. 2B). In PTX-treated cells, a marginal increase in LC3B-II along with a partial increase or decrease in p62 was observed (Fig. 2B), indicating autophagy induction. Enhanced antitumor effects of the combination treatment over PTX alone were confirmed by increased cleaved caspase-3 (Fig. 2B) and by enhanced apoptosis measured by Annexin V and/or Sytox-Blue positive cell populations (Supplementary Fig. S3B). Additionally, CQ alone increased cleaved caspase-3 in Hs578t and MDA-MB-231 cells (Fig 2B). Thus, these results suggest that CQ may be used in combination with chemotherapy in TNBC cells.
Figure 2. CQ inhibits PTX-induced autophagy and sensitizes TNBC cell lines to PTX.
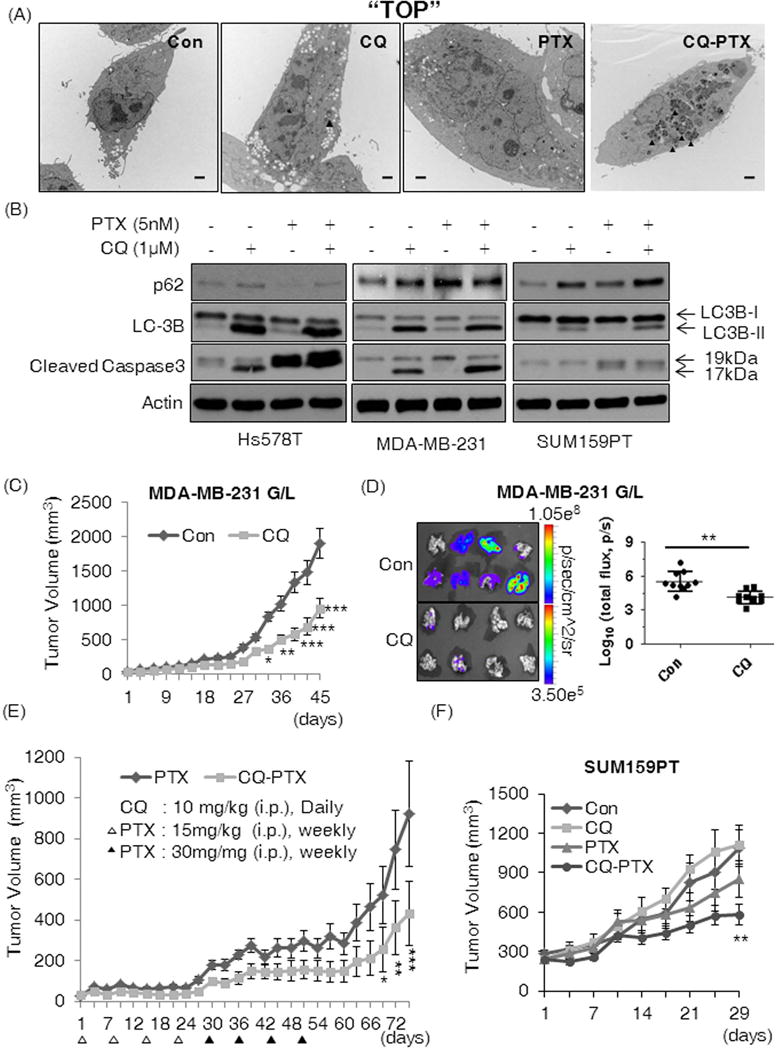
(A) TEM images of autophagosomes in Hs578t cells after 48 hours treatment with Con (DMSO), CQ (1 μM), PTX (5 nM) or combination of CQ and PTX. Solid black arrows indicate autophagosomes. The TEM experiment was performed once and the representative images are shown here. The black bars are 2 μm in length. (B) Western blotting results for p62, LC3B, and cleaved caspase 3 from lysates of Hs578t, MDA-MB-231, and SUM159PT cells after 48-hour treatments as indicated. We confirmed similar effects of CQ in independently repeated experiments. CQ attenuated (C) growth of orthotopic MDA-MB-231 G/L tumors and (D) inhibited spontaneous lung metastasis of the tumors; Con: PBS and CQ: 10 mg/kg i.p. daily (n=10 per group). Total photon counts were normalized by setting the minimum at 3.50 × 10⁵ and the maximum at 1.05 × 10⁸ (p/sec/cmˆ2/sr) and transformed by log10 to analyze the effects of CQ on metastasis and tumor burden in lungs. Two-tailed Student’s t-test was used for the statistical comparison. (E) CQ-PTX attenuated tumor recurrence (MDA-MB-231 G/L) compared to PTX aline. (F) The CQ-PTX combination therapy reduced the growth of orthotopic SUM159PT tumors (n=10). All mice received the scheduled dose of each drug as indicated in the Materials and Methods. Two-way ANOVA (Boneferroni post-tests) was used to compare tumor volumes in all animal experiments (C, E, and F). All control groups received PBS as the vehicle (*p<0.05, **p<0.01, ***p<0.001).
In vivo inhibition of tumor growth and lung metastasis by CQ
We observed a significant 50% (p<0.0001) in vivo growth inhibition in orthotopic MDA-MB-231 G/L tumors by CQ treatment alone compared to controls (Fig. 2C). Additionally, the CQ treatment prevented spontaneous lung metastasis from 90% in controls to 20% in treatment mice, with significant reduction of tumor burden in lungs (p<0.003) (Fig. 2D). We next compared the impact of CQ-PTX treatment against PTX alone in MDA-MB-231 G/L orthotopic tumor models. The combination treatment reduced tumor size by 50% compared to PTX alone (p<0.001) (Fig. 2E). Furthermore, we observed significantly slower tumor recurrence in CQ-PTX treated mice compared to PTX alone treatment arm; 20% of the mice in the CQ-PTX group showed complete regression of tumor during the treatment cycle with no recurrence observed. Moreover, an additional 20% of the mice in the CQ-PTX group showed consistent reduction in tumor size even after the last treatment, in contrast to continuous tumor growth observed in all mice in the PTX group (data not shown). The anti-tumor effects of CQ-PTX were also confirmed in the SUM159PT orthotopic xenograft model involving a four-week treatment of Control (PBS) CQ (10mg/kg, daily, i.p.), PTX (15mg/kg, twice per week, i.p.), or in combination. Consistently, the CQ-PTX combination treatment arm was the only group to show significant inhibition of tumor growth while CQ alone or PTX alone showed no statistical difference in tumor volume compared to controls (Fig. 2F). These results may suggest that CQ enhances the anti-tumor effects of PTX by decreasing the CSCs.
CQ reduces breast cancer stem cells in vivo
For cancer stem cell analysis, additional cohorts of mice bearing either MDA-MB-231 (n=7) or SUM159PT (n=5) orthotopic tumors were treated for two weeks with vehicle, CQ (10mg/kg, daily), PTX (15mg/kg, twice per week) or the combination, CQ-PTX. We confirmed the enhanced anticancer effects of CQ-PTX in both tumor cell lines compared to the control group or PTX alone (Fig. 3A and 3B). Additionally, we found that PTX significantly increased the Aldeflour+ CSCs by three-fold in MDA-MB-231 tumors (Fig. 3C) and the CD44+/CD24−/low CSCs by two-fold in SUM159PT models (Fig. 3D) compared to controls. We did not observe any significant change in the CSC population by CQ alone, but CQ in combination with PTX reduced the PTX-induced CSC population to control levels in both tumor cell lines (Fig. 3C and Fig 3D). We further investigated the tumorigenic potential of tumors by testing sphere forming ability. Interestingly, the PTX-induced CSC increase correlated well with the increased MSFE in both the primary and the secondary MS of MDA-MB-231 and SUM159PT tumors compared to the controls (Fig. 3E and 3F). The CQ-PTX combination treatment significantly inhibited the PTX-induced primary MSFEs of the two tumor cell lines comparable to control levels in the primary MS, and further reduced the MSFE more than four times lower than controls in the secondary MS for both MDA-MB-231 (Fig. 3E) and SUM159PT tumors (Fig. 3F). CQ did not alter the sphere forming ability compared to controls in the primary MS, but reduced the secondary MSFE by 4 fold in MDA-MB-231 tumors (Fig. 3E) and 2 fold in SUM159PT tumors (Fig. 3F). Finally, we confirmed the CSC targeting effects of CQ through a limiting dilution assay for MDA-MB-231 tumors using three dilutions; 75,000 (75k), 25,000 (25k), and 5,000 (5k) cells. CQ or CQ combination with PTX completely inhibited tumor formation for 6 weeks in all three dilutions of cells compared to controls or PTX (Fig. 3G). As anticipated, the PTX-mediated CSC increase also correlated well with higher tumor incidence rates at cell each dilution assay compared to controls; 100% vs 38% at 75k, 50% vs 13% at 25k, and 75% vs 38% at 5k dilutions (Fig. 3G). Also, by pairwise comparison, we confirmed that CQ significantly reduced the CSC frequencies in tumors compared to controls or the PTX treatment group (Fig. 3G). Together, these results strongly support the CSC-targeting effects of CQ in vivo.
Figure 3. CQ reduces the CSC population in vivo.
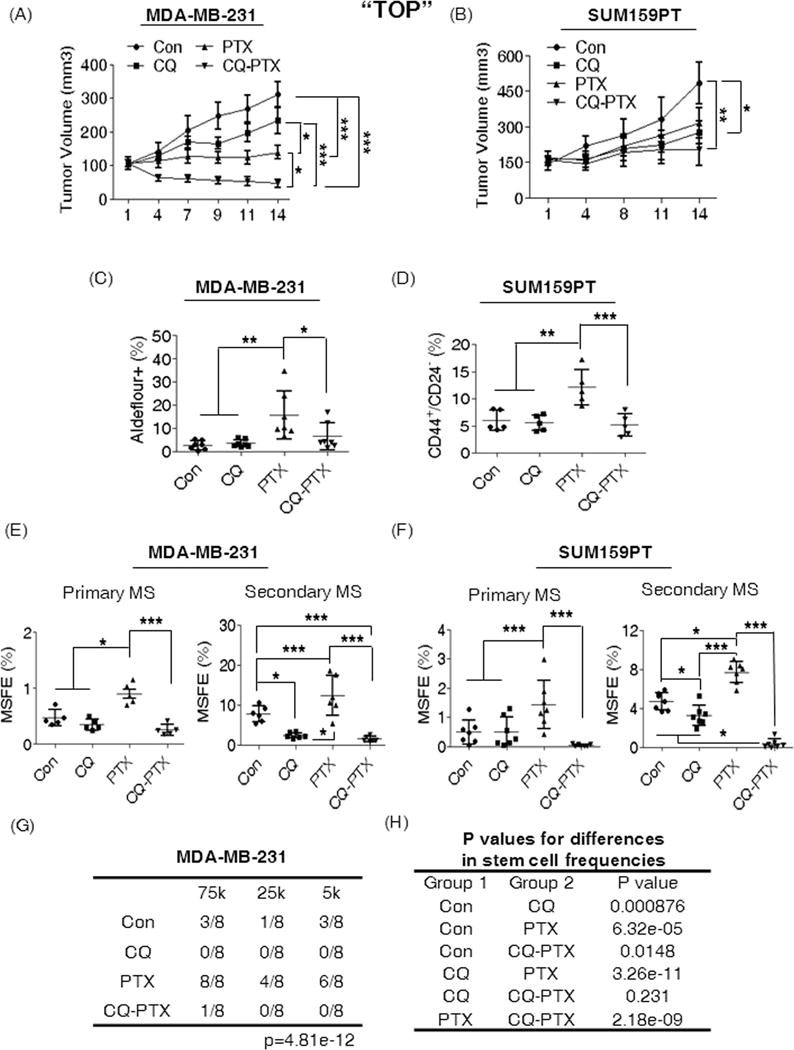
(A) and (B) Effects of short-term treatments on the growth of orthotopic MDA-MB-231 and SUM159PT tumors in athymic nude mice. Two-Way ANOVA (Boneferroni post-tests) was used for statistical analysis. CQ prevented PTX induced CSC enrichment as indicated by Aldefluore + population in MDA-MB-231 tumors (C) and the CD44+/CD24−/low population in SUM159PT tumors (D). CQ reduced the MSFE of MDA-MB-231 (E) and SUM159PT tumors (F). MS indicates mammosphere formation assay. One-Way ANOVA (Tukey) was used for statistical analysis. (G) Limiting dilution assay for testing the tumor initiation ability in Scid-beige mice bearing MDA-MB-231 tumors received with short term treatments (n=8 per group); 75k: 75,000, 25k: 25,000, and 5k: 5,000 tumor cells. (H) A pairwise comparison for CSC frequencies. P value indicates the significance of the difference on the CSC frequency of the compared two groups. For the statistical analysis, Extreme limiting dilution analysis45 was used. Con (PBS), CQ (10mg/kg, ip daily), PTX (15mg/kg, twice per week, ip), CQ-PTX, the combination. (*p<0.05, **p<0.01, ***p<0.001).
CQ inhibits Jak2-STAT3 signaling pathway in CSCs
As the Jak2/STAT3 signaling pathway is critical for maintenance of breast cancer stem cells5, we investigated the effects of CQ, PTX, and the combination on this signaling pathway. The phosphorylation of STAT3 (Tyr705) was compromised by CQ alone, PTX, or CQ-PTX in Hs578t and SUM159PT cells, while CQ-PTX was most effective at inhibiting phosphorylation (Fig. 4A). Analogously, we observed significant reduction of pSTAT3 by CQ or CQ-PTX compared to controls in MDA-MB-231 cells. However, PTX induced a substantially higher phosphorylation of STAT3 (Fig. 4A). The changes in STAT3 phosphorylation were correlated with the phosphorylation status of Jak2 in all three cell lines. Interestingly, we observed significant reduction of Jak2 expression by CQ-PTX in all three cell lines (Fig 4A). We next investigated the Jak2-STAT3 signaling pathway in sorted CD44+/CD24−/low CSC and non-CSC populations of SUM159PT cells when treated with either CQ, PTX, or in combination, CQ-PTX. We observed a reduction of Jak2 phosphorylation in CSCs by CQ, PTX, and CQ-PTX, with the most significant inhibition achieved with CQ-PTX compared to controls (Fig 4B). In non-CSCs, only the combination treatment inhibited Jak2 phosphorylation. However, we found substantial reduction in Jak2 following CQ-PTX treatment only in the CSCs (Fig 4B). Additionally, CQ inhibited pSTAT3-705, albeit, less significantly than CQ-PTX treatment, only in CSCs of SUM159PT, while PTX alone showed no effects (Fig. 4B). In non-CSCs, pSTAT3-705 was up-regulated by CQ, PTX, and CQ-PTX. Consistently, the combination treatment also reduced the phosphorylation of STAT3 at S727 in CSCs (Fig. 4B). Furthermore, CQ alone or in combination with PTX substantially inhibited the PI3K/Akt/mTOR pathway, an alternate pathway that can activate STAT3 in breast CSCs23, through activation of PTEN (Supplementary Fig. S4). These results suggest that CQ may affect CSCs by inhibiting activation of STAT3 and by reducing Jak2 expression.
Figure 4. CQ regulates the Jak2-STAT3 pathway in CSCs.
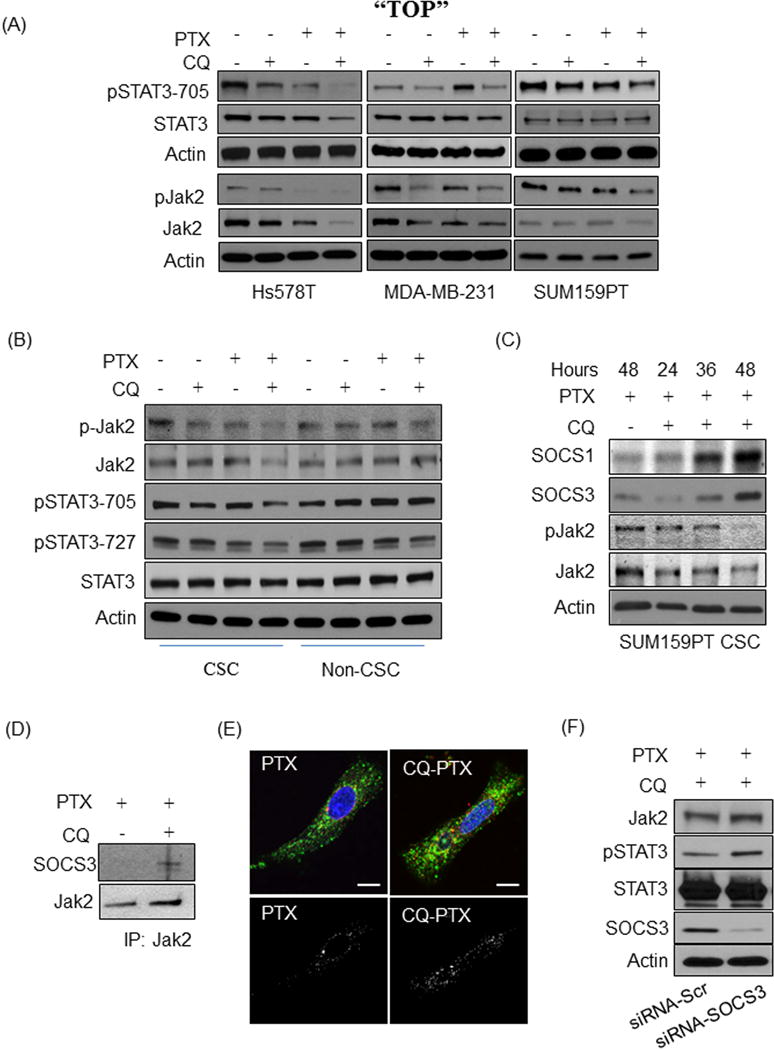
(A) Results of western blot assays for pSTAT3-705, STAT3, pJak2, Jak2, and Actin on lysates of Hs578t, MDA-MB-231, and SUM159PT cells treated for 48 hours with a 4-treatmet regimen; DMSO (Con) or CQ (1μ), PTX (5nM) in DMSO, or the combination. (B) Western blot analysis for the detection of pSTAT3-705, pSTAT3-727, STAT3, pJak2, Jak2, and Actin on lysates of sorted CD44+/CD24−/low CSCs or non-CSCs of SUM159PT cells. These cells were incubated in MC+ containing 2% FBS and treated with the 4-treatmet regimen for 48 hours. (C) Western blot analysis of SOCS1 and SOCS3 expression in SUM159PT CSCs after treatment of PTX or CQ-PTX for 24, 36, and 48 hours. (D) Immunoprecipitation of SOCS3 with Jak2 in SUM159PT CSCs treated with PTX (5 nM) or CQ (1 μM)-PTX (5 nM). Western blot for SOCS3 and Jak2 are shown. Normal IgG showed no non-specific bands at the expected molecular size (data not shown). (E) Confocal microscope images of SOCS3 co-localization with Jak2 in SUM159PT CSCs treated with PTX or CQ-PTX for 48 hours. Jak2 (red) and SOCS3 (green). Hoechst 33342 (100 ng/ml) stains for the nucleus. Co-localization of SOCS3 and Jak2 is depicted in the separate black-white cell images in which the white dots indicate the co-localization. All images were taken using an Olympus FV1000 confocal microscope with a 100x objective lens and 2.5x optical zoom. The white bars indicated 10μm in length. (F) Western blot assay of pSTAT3-705, STAT3, pJak2, Jak2, SOCS3, and Actin on lysates of SUM159PT CSCs in which SOCS3 was silenced prior to the 48 treatment with CQ-PTX. siRNA-Scr: siRNA with scrambled RNA sequences, siRNAi-SOCS3: siRNA with SOCS3 targeting RNA sequences. These are representative results of independent duplicate or triplicate experiments.
CQ-PTX induces the expression of suppressor of cytokine signaling (SOCS) families in CSCs
Since SOCS1 and SOCS3 are known to induce Jak2 degradation upon its activation24, 25, we investigated whether the SOCS family plays a role in CQ-mediated Jak2/STAT3 deregulation. Gene expression analysis by RT-PCR showed no alteration of Jak2 gene expression under any treatment (data not shown). In SUM159PT CSCs, a time-dependent increase in SOCS1 and SOCS3, and reciprocal decrease in pJak2 and Jak2, was found following CQ-PTX treatment compared to PTX alone at 48 hours (Fig. 4C). However, in an immunoprecipitation assay, SOCS3 was found associated with Jak2 and not SOCS1 in SUM159PT CSCs (Fig. 4D). Using immunofluorescence co-localization imaging, the increased interaction of Jak2 with SOCS3 was confirmed in SUM159PT CSCs treated with CQ-PTX in comparison to PTX alone (Fig. 4E). Finally, we were able to rescue Jak2 expression by silencing SOCS3 using siRNA in SUM159PT CSCs treated with CQ-PTX (Fig. 4F). Moreover, silencing SOCS3 expression increased Jak2 protein level in normal culture conditions, hinting at the Jak2 regulating nature of SOCS3 in SUM159PT CSCs (Supplementary Fig. S5). Taken together, these results confirm that CQ-PTX treatment resulted in the expression of SOCS1 and SOCS3 and enhanced interaction of SOCS3 with Jak2, causing reduction of Jak2 protein level in CSCs.
CQ suppressed the expression of DNA methyltransferase 1 in CSCs
The expression of SOCS1 and SOCS3 can be regulated by DNA methylation26, 27. To that end, we found that the CQ-PTX combination treatment significantly reduced DNMT1 in of Hs578t, SUM159PT, and MDA-MB-231 bulk tumors compared to controls or PTX alone treatment (Fig. 5A). Likewise, we also observed significantly reduced DNMT1 by CQ or CQ-PTX compared to controls and PTX alone respectively in CSCs and non-CSCs of SUM159PT, while PTX increased DNMT1 expression in both populations of cells (Fig. 5B). The negative effects of CQ-PTX on DNMT1 expression in CSCs of basal-like TNBCs HCC1937 and HCC38 (Fig. 5B) was further confirmed. The changes in DNMT1 protein levels induced by CQ or CQ-PTX significantly correlated with changes in global DNA methylation. In Hs578t and MDA-MB-231 cells, CQ alone induced hypomethylation by 50% (p<0.0001) and 8% (p<0.05), respectively (Fig. 5C). PTX also induced hypomethylation in Hs578t by 50% (p<0.0001), while no changes were observed in MDA-MB-231 cells. CQ-PTX induced the most significant hypomethylation in both cell lines compared to controls or to PTX. In SUM159PT bulk tumor cells, no changes in methylation were observed following CQ treatment, while PTX or CQ-PTX induced substantial hypermethylation (Supplementary Fig. S6). However, CQ induced global hypomethylation in CSCs of SUM159PT by 50% (p<0.001) while PTX induced hypermethylation (p<0.0001) compared to controls (Fig. 5C). CQ-PTX reduced global methylation by 10% relative to PTX treatment (p<0.05) (Fig. 5C). It is important to note that more than 85% in Hs578t and 97% of MDA-MB-231 cells were CD44+/CD24−/low. Thus, we confirmed that the increase in SOCS1 and SOCS3 expressions was due to the down-regulation of DNMT1 in SUM159PT CSCs (Fig. 5D). However, we found a 4-fold increase in SOCS3 mRNA alone in CSCs treated with CQ-PTX compared to PTX, while no difference in SOCS1 mRNA was detected (Fig. 5E). This result suggests that SOCS1 up-regulation might be an indirect effect of DNA hypomethylation. Consequently, we observed CQ-PTX induced hypomethylation in three different promoter regions of SOCS3 after CQ-PTX treatment in SUM159PT CSCs compared to PTX (Fig. 5F). We also confirmed the effects of CQ-PTX on DNMT1, pSTAT3, and Jak2 in vivo (Supplementary Fig. S7A and S7B). Taken together, our data suggests that CQ regulates the Jak2-STAT3 pathway to target CSCs through DNA methylation of SOCS3 in the presence of PTX.
Figure 5. CQ induced DNA hypomethylation by reducing DNMT1 expression.
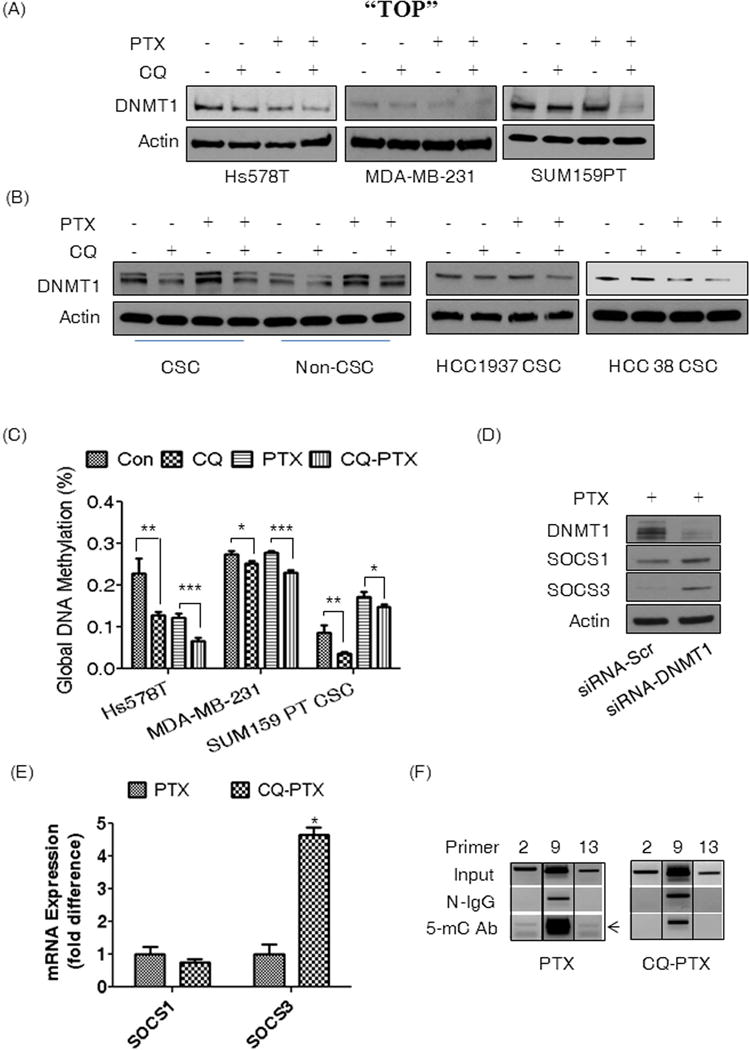
(A) Western blot analysis of DNMT1 from extracts of Hs578t, MDA-MB-231, and SUM159PT cells, and (B) extracts of CSCs or non-CSCs of SUM159PT and CSCs of HCC1937 and HCC38 cells. All cells were treated for 48 hours with the 4-treatment regimen; DMSO (Con) or CQ (1 μM), PTX (5 nM) in DMSO, or the combination. (C) Measurement of global DNA methylation using genomic DNA extracted from Hs578t and MDA-MB-231 cells and DNA from SUM159PT CSCs. All cells were treated with the 4-treatment regimen. One-way ANOVA (Tukey) was used for statistical analysis. (D) Western blot assay for DNMT1, SOCS1 and SOCS3, and Actin after silencing DNMT1 in PTX treated SUM159PT CSCs for 30 hours. (E) Expression of SOCS1 or SOCS3 transcripts in SUM159PT CSCs treated with either PTX (5 nM) or CQ (1 μM) and PTX (5 nM) for 48 hours. Student’s t-test was used for statistical analysis. (F) Images of DNA gel electrophoresis of SOCS3 promoter PCR to confirm CQ-induced DNA hypomethylation. SUM159PT CSCs were treated with either PTX or CQ-PTX for 48 hours before DNA extraction. Primer indicates the corresponding primer sets for PCR. Input indicates PCR reactions with the sonicated genomic DNA. N-IgG is the commercially available mouse normal IgG used for MeIP as a negative control. 5-mC Ab is the monoclonol antibody recognizing 5-methycytosine of DNA for MeDIP. The black arrow indicates the expected PCR products. Images were cropped from the original found in Supplementary Figure S8. All experiments were repeated at least 2 or 3 times with similar results, and the representative results were presented. (*p<0.05, **p<0.02, ***p<0.0001)
Jak2-STAT3 and DNMT1 synergistically regulate TNBC CSCs
Using siRNAs, we examined the impact of silencing Jak2, STAT3, and DNMT1, on TNBC CSCs. The silencing efficiency in Hs578t, MDA-MB-231, and SUM159PT cells was confirmed by detection of DNMT1, Jak2, and STAT3 using western blot assay (Fig. 6A). As shown in Figure 6B, silencing either of the genes resulted in reduction of the CD44+/CD24−/low population by 5–10% in Hs578t and MDA-MB-231 cells. The reduction of CSCs was more significant when two of the three genes were silenced simultaneously in Hs578t and MDA-MB-231 cells, resulting in an approximate 15% to 20% reduction of CSCs. However, the most significant reduction of CSCs was observed when all three genes were silenced simultaneously, resulting in roughly 25–30% reduction of CSCs (Fig. 6B). Contrary to the aforementioned cell lines, SUM159PT cells showed a significant 50% reduction of CSCs following silencing of a single gene, with effects enhanced through silencing of Jak2 or STAT3 with DNMT1. However, in SUM159PT, the most effective CSC reduction was achieved when all three genes were silenced simultaneously. An MS assay was then performed after silencing each gene using specific siRNA in all three cell lines. Contrary to the FACS analysis of the CD44+/CD24−/low CSCs, the silencing of DNMT1, Jak2, or STAT3 altered MSFE more dramatically, with roughly a 30% to 70% reduction of MSFE observed in MDA-MB-231 and SUM159PT cells compared to controls (Fig. 6C). In Hs578t cells, STAT3 silencing alone was effective at inhibiting MSFE by 70% (Fig. 6C). STAT3 silencing was more effective at reducing MSFE than either DNMT1 or Jak2 in all three cell lines. Interestingly, severely compromised MSFE was observed when any two of the three genes were silenced (Fig. 6C). Although there was additional reduction of MSFE by three-gene silencing compared to two-gene silencing, no significance was found except in SUM159PT cells (Fig. 6C). These results confirm that DNA methylation plays a critical role in maintenance of breast CSCs concomitantly with Jak2-STAT3 signaling.
Figure 6. Both DNMT1 and the Jak2-STAT3 pathway are critical for CSCs of TNBC.
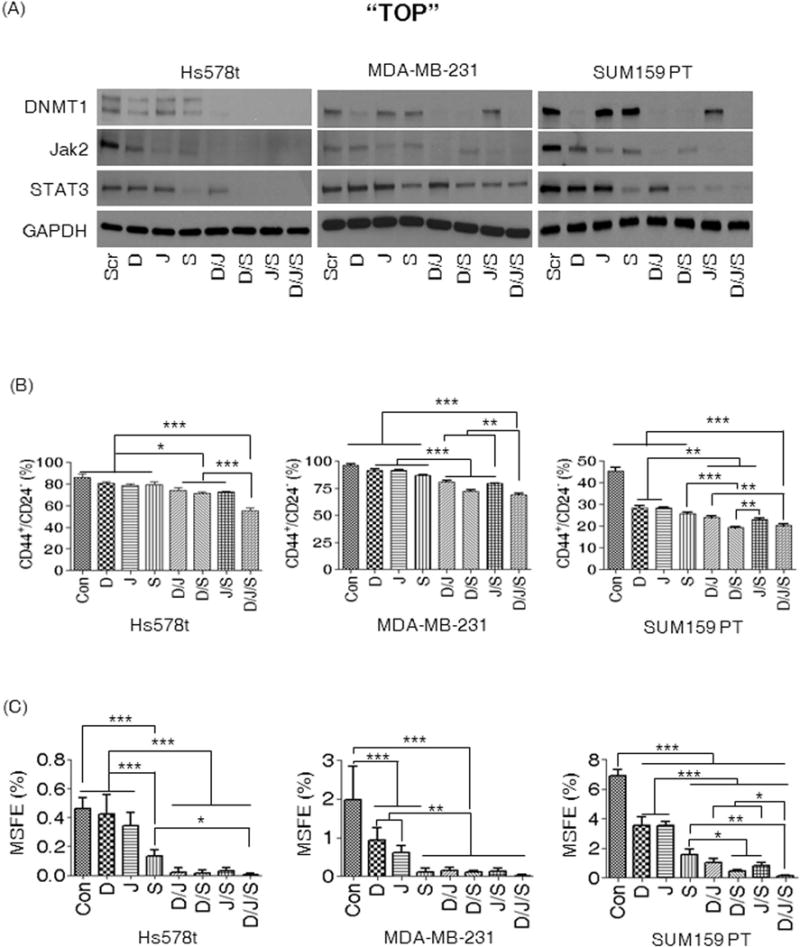
(A) Confirmation by western blot analysis in Hs578t, MDA-MB-231, and SUM159PT cells for DNMT1, Jak2, STAT3. GAPDH indicates the loading control. (B) FACS analysis of CD44+/CD24−/low CSCs after silencing using the indicated single or combination of corresponding RNAi. (C) Impact of gene silencing on MSFE. D indicates silencing of DNMT1, J for Jak2, S for STAT3, D/J for the silencing of DNMT1 and Jak2, D/S for DNMT1 and STAT3, J/S for Jak2 and STAT3, and D/J/S for the silencing of DNMT1, Jak2, and STAT3. Scr indicates RNAi of scrambled sequences and serves as control. One-Way ANOVA (Tukey) was used for statistical analysis. All experiments were repeated three times with similar results. The representative results are presented. (*p<0.05, **p<0.01, ***p<0.001).
CQ rewrites DNA methylation in MDA-MB-231 Cells
Changes in DNA methylation by MBD-enriched DNA from MDA-MB-231 cells was analyzed after 48 hour CQ treatment. Substantial differences were observed in the number and make-up of Model-based analysis of ChIP-seq (MACS) defined MDB-enriched peaks within the proximal promoter region (−5000 to +200) of protein coding genes (Fig 7A). Upon more detailed differentiation analysis of MACS defined MDB-enriched peaks between the CQ and control treatments (MAnorm28), the proximal promoter regions of 359 genes uniquely methylated in the control treatment compared to CQ and 136 exclusively methylated in the CQ treatment were identified. To assess any biological significance of these genes with affected proximal regulatory regions, we conducted functional enrichment analysis with GeneCodis329, 30. Roughly one-third of the genes with hypomethylated proximal promoters following CQ treatment were allocated into four functional groups (p≤9.06e-06); protein, nucleotide, ATP, and RNA binding functions (Figure 7B). The majority of the genes with hypermethylated proximal promoter regions in the CQ treatment group were predicted to have binding functions to zinc ion, protein, nucleotide, beta-catenin, metal ion, and single-stranded RNA (p≤7.83e-05) (Fig. 7C). Enriched genes are listed in Supplementary Table S2 and S3. Additionally, the uniquely methylated genes in controls were enriched only for one KEGG enriched pathway, protein processing in endoplasmic reticulum (p<0.0002), while genes for CQ were enriched for pathways in cancer (p=4.43e-06) and the Wnt signaling pathway (p<0.0003) (Fig. 7D). Thus, these results suggest that CQ can regulate CSCs by affecting multiple signaling pathways through DNA methylation via down-regulation of DNMT1, and through inhibition of the PI3K/Akt/mTOR and Jak2-STAT3 pathways (Fig. 7E).
Figure 7. CQ induces hypomethylation and resets the DNA methylome.
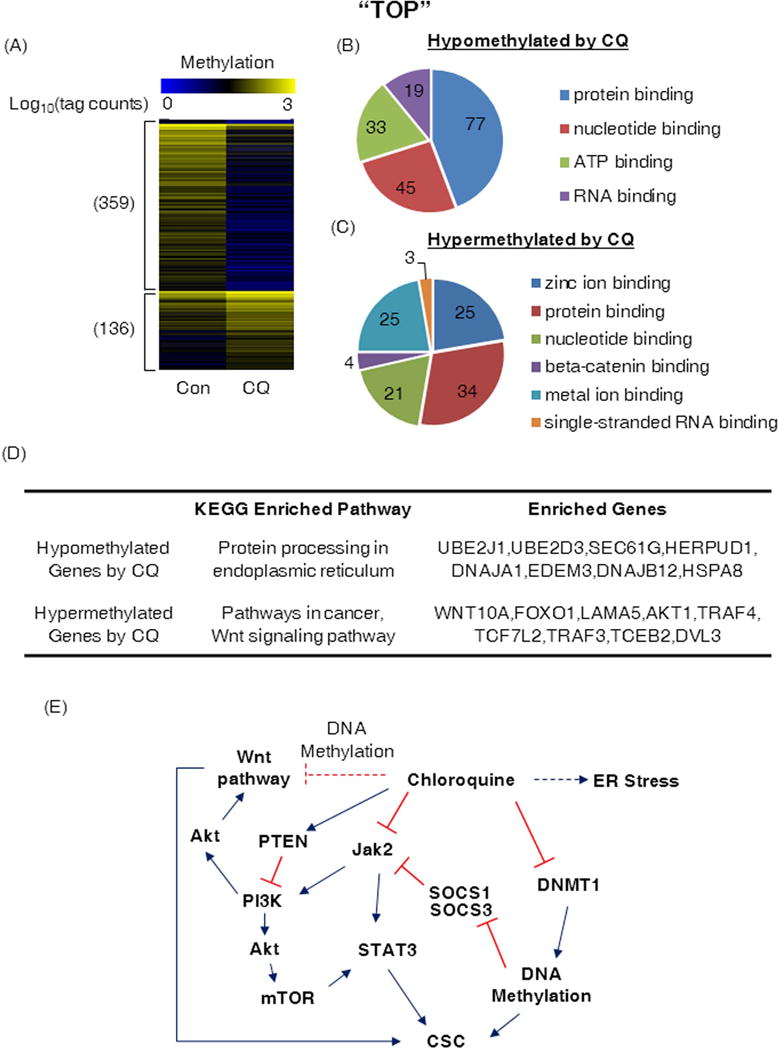
(A) A heatmap showing unique methylation status of the proximal promoter region (−5000 to +200) of protein coding genes in MDA-MB-231 cells treated for 48 hours with PBS (Con) or chloroquine (CQ, 1 μM). The numbers on the left of the heatmap indicate the total number of genes with the uniquely methylated promoters. Methylation degree increases from blue to yellow (log10 transformed tag counts). (B) and (C) Schematic diagrams illustrating results of the functional enrichment analysis with GeneCodis for the identified genes. The p values for the functional enrichment test were (B) p ≤ 9.06 × 10⁻⁶ and (C) p ≤ 7.83 × 10⁻⁵. (D) KEGG enriched pathway of genes that are hyper- or hypo-methylated by CQ in MDA-MB-231 cells. (E) A schematic diagram illustrating how CQ can affect TNBC CSCs. Red indicates inhibition and blue activation. The red dotted line indicates possible inhibition and the blue dotted line represents activation through DNA methylation.
Discussion
Chloroquine, an autophagy inhibitor, was named as a potential repositioned drug candidate for treatment against CSCs through in silico network analysis of gene signatures specific for drug resistant CD44+/CD24−/low cells derived from patient biopsies. Based on our observation of CSC enrichment following chemotherapy4, 31, autophagy was hypothesized as an underlying mechanism to maintain viable CSC populations in TNBC. This is further supported by previous studies, suggesting autophagy as a key regulator of breast CSCs11, 12. To this end, we demonstrated the anti-CSC activity of CQ through the reduction of MSFE and the CD44+/CD24−/low CSCs. This reduction of CSCs correlates well with the inhibition of PTX-induced autophagy and with increases in apoptosis. As CSCs have been implicated in metastasis and recurrence22, 32–34, we confirmed the anti-CSC effects of CQ in vivo through inhibition of tumor growth, prevention of spontaneous lung metastasis, and attenuation of tumor recurrence. The enhanced anti-tumor effects were accompanied with suppression of CSC enrichment following PTX treatment and significantly impaired tumor initiation ability in vivo. More importantly, we found a significant reduction of CD44+/CD24−/low CSC populations in patients who underwent clinical trials involving the combination therapy of CQ with taxanes. Thus, our data strongly supports the anti-CSC activity of CQ against CSCs in TNBC through autophagy inhibition.
The Jak2-STAT3 pathway was compromised by CQ alone or in combination with PTX. A significant inhibition of the Jak2 phosphorylation by CQ alone was observed in all cell lines examined. We suspect that CQ may induce endoplasmic reticulum (ER) stress which mediate inhibition of Jak2 phopsphorylation through inhibition of autophagy, down-regulation of the PI3K/Akt/mTOR pathway, and hypomethylation of ER stress related genes in MDA-MB-231 cells. Kimura et al.35, and Um et al.36 reported similar ER stress mediated inhibition of Jak2-STAT3 pathway. However, the inhibitory effects of CQ on Jak2-STAT3 were most profound following combination therapy, as demonstrated by a decrease in phosphorylation and expression of Jak2 in all cell lines examined. Moreover, the inhibitory effect on Jak2 expression was CSC-specific. These results are in agreement with previous reports on the essential role of the Jak2-STAT3 signaling pathway for growth and maintenance of CD44+/CD24−/low breast CSCs5, 23. Additionally, the decrease in Jak2 was accompanied with a reduction of DNMT1 expression that correlated well with the global DNA hypomethylation in CSCs. Similar to Jak2-STAT3, DNMT1 is an important gene expression regulator in normal stem cells as well as CSCs37, 38. In leukemia, haploinsufficiency of DNMT1 is known to impair leukemogenesis and self-renewal of leukemia stem cells39. Furthermore, the epigenetic role of STAT3 has been described for inhibition of tumor suppressor genes through interaction with DNMT140, 41. Thus, our findings suggest that CQ regulates CSCs through epigenetic regulation in addition to the inhibition of autophagy.
SOCS1 and SOCS3 have been identified as versatile negative regulators of the Jak2-STAT3 signaling pathway42–44. Along with down-regulation of Jak2, the combination treatment induced expression of SOCS1 and SOCS3, as well as interaction of SOCS3 with Jak2 in CSCs. Additionally, SOCS1 and SOCS3 expression was inversely proportional to the expression of DNMT1, while the opposite was observed following PTX treatment alone. SOCS1 and SOCS3 are known to interact with Jak2 and induce its degradation24, 25, 42–44. Moreover, the expression of SOCS1 and SOCS3 are tightly regulated by DNA methylation26, 27. Thus, we believe that CQ regulates the Jak2/STAT3 signaling pathway in CSCs through deregulation of DNA methylation mediated by loss of DNMT1 expression. In order to determine whether Jak2, STAT3, or DNMT1 was critical for CSC maintenance, sequential gene silencing was performed for all the three genes. Our findings indicate that simultaneous silencing of Jak2, STAT3, and DNMT was most effective in reducing CD44+/CD24−/low CSCs and significantly imapred the sphere forming ability. This study defines a possible mechanism of CQ for inhibition of CSCs through regulation of the Jak2/STAT3 and DNA methylation through DNMT1.
In summary, this is the first study that identifies a CQ-mediated decrease in CD44+/CD24−/low CSC due to inhibition of the Jak2-STAT3 signaling pathway through expression of SOCS1 and SOCS3, which in turn deregulates Jak2 expression. Moreover, this is the first study to demonstrate that inhibition of the Jak2-STAT3 pathway is associated with down-regulation of DNMT1 and subsequent global DNA hypomethylation. More importantly, these pre-clinical findings are reflected in a currently ongoing clinical trial involving CQ-PTX treatment, where significant reduction in CD44+/CD24−/low populations has been observed. Herein, we report that CQ reduces CSCs in TNBC by altering the Jak2-STAT3 pathway and DNMT1 expression in addition to autophagy inhibition. Subsequent analysis of CQ-mediated changes in epigenome and gene expression in combination with other epigenetic inhibitors, such as HDAC inhibitors, may enable refinements in strategies targeting TNBC CSC subpopulations.
Supplementary Material
Supplementary Figure 1. Signaling pathway networks and targeted drugs for CD44+/CD24−/low and MS-forming treatment-resistant tumor cells. Signaling pathway networks for (A) CD44+/CD24−/low tumor cells and (B) MS-forming treatment-resistant tumor cells with 21 FDA-approved drugs which target 7 signaling nodes in the networks. Circles are gene nodes, yellow links are protein-protein interactions, grey squares are drugs, and grey links are drug-target interactions. The color of every gene node is determined by a statistical score, i.e. −log(P-value), where P-value is the Student’s t test statistical value considering all of the probes’ value of the gene in the groups for A or B. The data scale is between 0 and 8. 0 is for no-color and 8 correspond to the dark red circle. The red oval circle indicates chloroquine (CQ).
Supplementary Figure 2. Chloroquine specifically targets CSCs. (A) CQ induces apoptosis in CD44+/CD24−/low CSC population of SUM159PT cells in MS culture. MS assay was performed with CQ (0, 1, or 5 μM) for 10 hours. Cells were trypsinized to single cells and stained with the following antibodies in 1x Annexin V binding buffer (Life Technologies); AnnexinV-Alexa488 (Life Technologies), CD44-APC (BD Bioscience), CD24-PeCy7 (BD Bioscience), and Sytox-Blue (Life Technologies). Side scatter and forward scatter were used to eliminate debris and doublets. Annexin V+ and Annexin V+/SYTOX-Blue+ populations were then gated for analysis of the CD44+/CD24−/low CSC population. The cells treated with CQ (0 μM) were used for the isotype staining (normal IgG-Alexa488, normal IgG-APC, and normal IgG-PeCy7), and the quadrant gate was established after isolation of debris and doublets. (B) CQ reduced ALDEFLUOR positive breast cancer stem cell. MDA-MB-231 and SUM159PT cells were treated with CQ for 48 hours at given concentration. ALDFLUORE positive gates were drawn based on DEAB-treated negative control cells that were all SYTOX-Blue negative. CQ decreased ALDEFLOUR positive CSCs from 24% to 0.56% in MDA-MB-231 cells and from 0.08% to 0.01% in SUM159PT cells.
Supplementary Figure 3. The combination treatment of CQ and PTX enhances cell death through inhibition of autophagy. (A) MDA-MB-468 cells stably transfected with LC3B-GFP expression vector were treated with vehicle (DMSO), CQ (1 μM), PTX (5 nM), and the combination for 24 hours. Live cells were then stained for active lysosomes using LysoTracker® Red DND-99. Nuclei were stained using Hoechst 34442 dye (100 ng/ml). For control, we observed scattered lysosomes and small occasional puncta formation of LC3B-GFP while CQ alone induced large puncta formation and decreased functional lysosomes. PTX alone induced fusion of lysosome and puncta indicated by yellow color while the combination treatment induced larger puncta formation with inhibition of the fusion between lysosomes and autophagosomes. All images were taken using an Olympus FV1000 confocal microscope with a100x objective lens and 2.5x optical zoom. The white bars indicate 10μm in length. (B) After treatment of the 4-treatment regimen, Hs578T, MDA-MB-231, and SUM159PT cells were analyzed for apoptosis using Annexin V antibody-FITC and SYTOX-Blue. CQ sensitized TNBCs to PTX within 48 hours as the combination treatment increased apoptosis significantly compared to controls or PTX alone (*p<0.05).
Supplementary Figure 4. CQ alone or in combination with PTX inhibits the PI3K/Akt/mTOR pathway by activating PTEN. SUM159PT cells were treated with Con (DMSO), CQ (3 μM), PTX (5 nM) and CQ-PTX combination for 48 hours. Western blot assays were performed to detect p-PTEN (Ser380), PTEN, p-mTOR (Ser2448), mTOR, p-Akt (Thr308) and p-Akt (Ser473), Akt, and Actin. The phosphorylation of Ser380 of PTEN inactivated phosphorylation. All others activated phosphorylation for mTOR and Akt. Due to differences in detection sensitivity, western blot assays were separately performed for Con and CQ samples from PTX and CQ-PTX samples. All antibodies were purchased from cell signaling Technology.
Supplementary Figure 5. Down-regulation of SOCS3 increased Jak2 expression levels in CSCs of SUM159PT cells. SUM159PT cells were transfected for 48 hours with control scrambled siRNA or siRNA against SOCS3. The down-regulation of SOCS3 increased Jak2 protein levels in CSCs of SUM159PT cells. siRNA-Scr : Scrambled siRNA, siRNA-SOCS3: siRNA against SOCS3.
Supplementary Figure 6. CQ does not affect DNA methylation in SUM159PT bulk tumors. SUM159PT cells were treated with Con (DMSO), CQ (1 μM), PTX (5 nM), and CQ-PTX for 48 hours. After DNA extraction, global DNA methylation was measured. CQ had no effects on DNA methylation. However, PTX induced significant DNA methylation regardless of the co-treatment of CQ. One-Way ANOVA (Tukey) was performed for statistical analysis (*p<0.05).
Supplementary Figure 7. CQ-PTX reduced expression of DNMT1 and Jak2 in vivo. (A) SUM159PT tumor tissues from the 4-week treatment experiment were stained against DNMT1 and Jak2. For the negative control, normal lung and kidney tissues were used for DNMT1 and Jak2 respectively. For the negative control, tissues were stained with secondary antibodies alone without primary antibody staining. Images were taken using a Nikon eclipse 90i microscope mounted with a DS-Fi1 bright field camera (Nikon Instruments INC., Melville, NY). All images were taken using a 20x objective lens under the same light exposure condition and a bundled software. The black bars indicate 100μm in length. (B) Western blot assay of DNMT1, Jak2, p62, p-STAT3 (Tyr705), STAT3, cleaved PARP, and actin from tumor tissue lysates. The numbers from 1 to 10 indicate individual xenograft tumors in each treatment group.
Supplementary Figure 8. CQ induces hypomethylation in SOCS3 gene. DNA methylation was analyzed using custom designed 13 PCR primer sets and the MeDIP-enriched DNA from SUM159PT CSCs, treated with PTX (5 nM) or CQ (1 μM)-PTX (5 nM). Input indicates that total fragmented genomic DNA was used for the PCR template to serve as a positive control. N-IgG indicates normal IgG which does not detect methylated DNA and serves as the IgG negative control. 5-mC Ab indicates the antibody recognizing 5-methylcytosine in DNA and was used to enrich methylated DNA. Primer negative control denotes PCR reaction with primers without templates to differentiate specific PCR from non-specific primer dimer PCR. The blue arrows indicate primers and the red designates PCR-specific products. The red rectangular boxes shows differentially methylated sites on the proximal promoter regions of SOCS3 genes in given conditions.
F and R indicate forward and reverse sequences, respectively.
Acknowledgments
This work was supported by NIH/NCI grants R01 CA138197, U54 CA149196, Golfers against Cancer, Breast Cancer Research Foundation, Causes for a Cure, Team Tiara, Emily W. Herrman Cancer Research Laboratory, and Komen for Cure KG 081694. We declare that none of the authors have any financial interest related to this work.
Footnotes
Dong Soon Choi and Elvin Blanco: study conception, design, collection, assembly, analysis, interpretation of data, and manuscript writing.
Yoo-Shin Kim: collection and/or assembly, and analysis of data and manuscript writing.
Angel A. Rodriguez: provision of study material and patients.
Hong Zhao: assembly and analysis of data and manuscript writing.
Tim Hui-Ming Huang and Chun-Liang Chen: collection of sequencing data
Guangxu Jin: assembly of data.
Melissa Landis: data analysis and interpretation of clinical data.
Lacey A. Burey, Qian, Wei, and Helen H. Wong: collection and assembly of data.
Bhuvanesh Dave: data analysis
Mauro Ferrari and Stephen TC Wong : administrative support and final approval of manuscript.
Jenny Chang: data analysis and interpretation of data, manuscript writing, financial support, administrative support, final approval of manuscript.
Disclosure of potential conflict of interest:
The authors declare no potential conflicts of interest.
References
- 1.Foulkes WD, Smith IE, Reis-Filho JS. Triple-negative breast cancer. The New England journal of medicine. 2010;363:1938–1948. doi: 10.1056/NEJMra1001389. [DOI] [PubMed] [Google Scholar]
- 2.Dent R, Trudeau M, Pritchard KI, et al. Triple-negative breast cancer: clinical features and patterns of recurrence. Clin Cancer Res. 2007;13:4429–4434. doi: 10.1158/1078-0432.CCR-06-3045. [DOI] [PubMed] [Google Scholar]
- 3.Idowu MO, Kmieciak M, Dumur C, et al. CD44(+)/CD24(−/low) cancer stem/progenitor cells are more abundant in triple-negative invasive breast carcinoma phenotype and are associated with poor outcome. Human pathology. 2012 doi: 10.1016/j.humpath.2011.05.005. [DOI] [PubMed] [Google Scholar]
- 4.Creighton CJ, Li X, Landis M, et al. Residual breast cancers after conventional therapy display mesenchymal as well as tumor-initiating features. Proceedings of the National Academy of Sciences of the United States of America. 2009;106:13820–13825. doi: 10.1073/pnas.0905718106. [DOI] [PMC free article] [PubMed] [Google Scholar]
- 5.Marotta LL, Almendro V, Marusyk A, et al. The JAK2/STAT3 signaling pathway is required for growth of CD44(+)CD24(−) stem cell-like breast cancer cells in human tumors. The Journal of clinical investigation. 2011;121:2723–2735. doi: 10.1172/JCI44745. [DOI] [PMC free article] [PubMed] [Google Scholar]
- 6.Gupta PB, Onder TT, Jiang G, et al. Identification of selective inhibitors of cancer stem cells by high-throughput screening. Cell. 2009;138:645–659. doi: 10.1016/j.cell.2009.06.034. [DOI] [PMC free article] [PubMed] [Google Scholar]
- 7.Janku F, McConkey DJ, Hong DS, et al. Autophagy as a target for anticancer therapy. Nature reviews. 2011;8:528–539. doi: 10.1038/nrclinonc.2011.71. [DOI] [PubMed] [Google Scholar]
- 8.Kenific CM, Thorburn A, Debnath J. Autophagy and metastasis: another double-edged sword. Current opinion in cell biology. 2010;22:241–245. doi: 10.1016/j.ceb.2009.10.008. [DOI] [PMC free article] [PubMed] [Google Scholar]
- 9.Martinez-Outschoorn UE, Lin Z, Ko YH, et al. Understanding the metabolic basis of drug resistance: therapeutic induction of the Warburg effect kills cancer cells. Cell cycle (Georgetown, Tex. 2011;10:2521–2528. doi: 10.4161/cc.10.15.16584. [DOI] [PMC free article] [PubMed] [Google Scholar]
- 10.Sanchez CG, Penfornis P, Oskowitz AZ, et al. Activation of autophagy in mesenchymal stem cells provides tumor stromal support. Carcinogenesis. 2011;32:964–972. doi: 10.1093/carcin/bgr029. [DOI] [PMC free article] [PubMed] [Google Scholar]
- 11.Cufi S, Vazquez-Martin A, Oliveras-Ferraros C, et al. Autophagy positively regulates the CD44(+) CD24(−/low) breast cancer stem-like phenotype. Cell cycle (Georgetown, Tex. 2011;10:3871–3885. doi: 10.4161/cc.10.22.17976. [DOI] [PubMed] [Google Scholar]
- 12.Gong C, Bauvy C, Tonelli G, et al. Beclin 1 and autophagy are required for the tumorigenicity of breast cancer stem-like/progenitor cells. Oncogene. 2012 doi: 10.1038/onc.2012.252. [DOI] [PMC free article] [PubMed] [Google Scholar]
- 13.Sotelo J, Briceno E, Lopez-Gonzalez MA. Adding chloroquine to conventional treatment for glioblastoma multiforme: a randomized, double-blind, placebo-controlled trial. Annals of internal medicine. 2006;144:337–343. doi: 10.7326/0003-4819-144-5-200603070-00008. [DOI] [PubMed] [Google Scholar]
- 14.Bellodi C, Lidonnici MR, Hamilton A, et al. Targeting autophagy potentiates tyrosine kinase inhibitor-induced cell death in Philadelphia chromosome-positive cells, including primary CML stem cells. The Journal of clinical investigation. 2009;119:1109–1123. doi: 10.1172/JCI35660. [DOI] [PMC free article] [PubMed] [Google Scholar]
- 15.Jin G, Fu C, Zhao H, et al. A novel method of transcriptional response analysis to facilitate drug repositioning for cancer therapy. Cancer Res. 2012;72:33–44. doi: 10.1158/0008-5472.CAN-11-2333. [DOI] [PMC free article] [PubMed] [Google Scholar]
- 16.Zhao H, Jin G, Cui K, et al. Novel modeling of cancer cell signaling pathways enables systematic drug repositioning for distinct breast cancer metastases. Cancer research. 2013;73:6149–6163. doi: 10.1158/0008-5472.CAN-12-4617. [DOI] [PMC free article] [PubMed] [Google Scholar]
- 17.Schott AF, Landis MD, Dontu G, et al. Preclinical and clinical studies of gamma secretase inhibitors with docetaxel on human breast tumors. Clin Cancer Res. 2013;19:1512–1524. doi: 10.1158/1078-0432.CCR-11-3326. [DOI] [PMC free article] [PubMed] [Google Scholar]
- 18.Kim JH, Choi DS, Lee OH, et al. Antiangiogenic antitumor activities of IGFBP-3 are mediated by IGF-independent suppression of Erk1/2 activation and Egr-1-mediated transcriptional events. Blood. 2011;118:2622–2631. doi: 10.1182/blood-2010-08-299784. [DOI] [PMC free article] [PubMed] [Google Scholar]
- 19.Rozen S, Skaletsky H. Primer3 on the WWW for general users and for biologist programmers. Methods in molecular biology (Clifton, N J. 2000;132:365–386. doi: 10.1385/1-59259-192-2:365. [DOI] [PubMed] [Google Scholar]
- 20.Langmead B, Trapnell C, Pop M, et al. Ultrafast and memory-efficient alignment of short DNA sequences to the human genome. Genome biology. 2009;10:R25. doi: 10.1186/gb-2009-10-3-r25. [DOI] [PMC free article] [PubMed] [Google Scholar]
- 21.Feng J, Liu T, Qin B, et al. Identifying ChIP-seq enrichment using MACS. Nature protocols. 2012;7:1728–1740. doi: 10.1038/nprot.2012.101. [DOI] [PMC free article] [PubMed] [Google Scholar]
- 22.Charafe-Jauffret E, Ginestier C, Iovino F, et al. Breast cancer cell lines contain functional cancer stem cells with metastatic capacity and a distinct molecular signature. Cancer research. 2009;69:1302–1313. doi: 10.1158/0008-5472.CAN-08-2741. [DOI] [PMC free article] [PubMed] [Google Scholar]
- 23.Zhou J, Wulfkuhle J, Zhang H, et al. Activation of the PTEN/mTOR/STAT3 pathway in breast cancer stem-like cells is required for viability and maintenance. Proceedings of the National Academy of Sciences of the United States of America. 2007;104:16158–16163. doi: 10.1073/pnas.0702596104. [DOI] [PMC free article] [PubMed] [Google Scholar]
- 24.Ungureanu D, Saharinen P, Junttila I, et al. Regulation of Jak2 through the ubiquitin-proteasome pathway involves phosphorylation of Jak2 on Y1007 and interaction with SOCS-1. Molecular and cellular biology. 2002;22:3316–3326. doi: 10.1128/MCB.22.10.3316-3326.2002. [DOI] [PMC free article] [PubMed] [Google Scholar]
- 25.Kershaw NJ, Murphy JM, Liau NP, et al. SOCS3 binds specific receptor-JAK complexes to control cytokine signaling by direct kinase inhibition. Nature structural & molecular biology. 2012 doi: 10.1038/nsmb.2519. [DOI] [PMC free article] [PubMed] [Google Scholar]
- 26.Yoshikawa H, Matsubara K, Qian GS, et al. SOCS-1, a negative regulator of the JAK/STAT pathway, is silenced by methylation in human hepatocellular carcinoma and shows growth-suppression activity. Nature genetics. 2001;28:29–35. doi: 10.1038/ng0501-29. [DOI] [PubMed] [Google Scholar]
- 27.He B, You L, Uematsu K, et al. SOCS-3 is frequently silenced by hypermethylation and suppresses cell growth in human lung cancer. Proceedings of the National Academy of Sciences of the United States of America. 2003;100:14133–14138. doi: 10.1073/pnas.2232790100. [DOI] [PMC free article] [PubMed] [Google Scholar]
- 28.Shao Z, Zhang Y, Yuan GC, et al. MAnorm: a robust model for quantitative comparison of ChIP-Seq data sets. Genome biology. 2012;13:R16. doi: 10.1186/gb-2012-13-3-r16. [DOI] [PMC free article] [PubMed] [Google Scholar]
- 29.Tabas-Madrid D, Nogales-Cadenas R, Pascual-Montano A. GeneCodis3: a non-redundant and modular enrichment analysis tool for functional genomics. Nucleic acids research. 2012;40:W478–483. doi: 10.1093/nar/gks402. [DOI] [PMC free article] [PubMed] [Google Scholar]
- 30.Nogales-Cadenas R, Carmona-Saez P, Vazquez M, et al. GeneCodis: interpreting gene lists through enrichment analysis and integration of diverse biological information. Nucleic acids research. 2009;37:W317–322. doi: 10.1093/nar/gkp416. [DOI] [PMC free article] [PubMed] [Google Scholar]
- 31.Li X, Lewis MT, Huang J, et al. Intrinsic resistance of tumorigenic breast cancer cells to chemotherapy. Journal of the National Cancer Institute. 2008;100:672–679. doi: 10.1093/jnci/djn123. [DOI] [PubMed] [Google Scholar]
- 32.Sheridan C, Kishimoto H, Fuchs RK, et al. CD44+/CD24− breast cancer cells exhibit enhanced invasive properties: an early step necessary for metastasis. Breast Cancer Res. 2006;8:R59. doi: 10.1186/bcr1610. [DOI] [PMC free article] [PubMed] [Google Scholar]
- 33.Liu H, Patel MR, Prescher JA, et al. Cancer stem cells from human breast tumors are involved in spontaneous metastases in orthotopic mouse models. Proceedings of the National Academy of Sciences of the United States of America. 2010;107:18115–18120. doi: 10.1073/pnas.1006732107. [DOI] [PMC free article] [PubMed] [Google Scholar]
- 34.Merlos-Suarez A, Barriga FM, Jung P, et al. The intestinal stem cell signature identifies colorectal cancer stem cells and predicts disease relapse. Cell stem cell. 8:511–524. doi: 10.1016/j.stem.2011.02.020. [DOI] [PubMed] [Google Scholar]
- 35.Kimura K, Yamada T, Matsumoto M, et al. Endoplasmic reticulum stress inhibits STAT3-dependent suppression of hepatic gluconeogenesis via dephosphorylation and deacetylation. Diabetes. 2011;61:61–73. doi: 10.2337/db10-1684. [DOI] [PMC free article] [PubMed] [Google Scholar]
- 36.Um HJ, Min KJ, Kim DE, et al. Withaferin A inhibits JAK/STAT3 signaling and induces apoptosis of human renal carcinoma Caki cells. Biochemical and biophysical research communications. 2012;427:24–29. doi: 10.1016/j.bbrc.2012.08.133. [DOI] [PubMed] [Google Scholar]
- 37.Gereige LM, Mikkola HK. DNA methylation is a guardian of stem cell self-renewal and multipotency. Nature genetics. 2009;41:1164–1166. doi: 10.1038/ng1109-1164. [DOI] [PubMed] [Google Scholar]
- 38.Mathews LA, Crea F, Farrar WL. Epigenetic gene regulation in stem cells and correlation to cancer. Differentiation; research in biological diversity. 2009;78:1–17. doi: 10.1016/j.diff.2009.04.002. [DOI] [PMC free article] [PubMed] [Google Scholar]
- 39.Trowbridge JJ, Sinha AU, Zhu N, et al. Haploinsufficiency of Dnmt1 impairs leukemia stem cell function through derepression of bivalent chromatin domains. Genes & development. 2012;26:344–349. doi: 10.1101/gad.184341.111. [DOI] [PMC free article] [PubMed] [Google Scholar]
- 40.Lee H, Zhang P, Herrmann A, et al. Acetylated STAT3 is crucial for methylation of tumor-suppressor gene promoters and inhibition by resveratrol results in demethylation. Proceedings of the National Academy of Sciences of the United States of America. 2012;109:7765–7769. doi: 10.1073/pnas.1205132109. [DOI] [PMC free article] [PubMed] [Google Scholar]
- 41.Zhang Q, Wang HY, Marzec M, et al. STAT3- and DNA methyltransferase 1-mediated epigenetic silencing of SHP-1 tyrosine phosphatase tumor suppressor gene in malignant T lymphocytes. Proceedings of the National Academy of Sciences of the United States of America. 2005;102:6948–6953. doi: 10.1073/pnas.0501959102. [DOI] [PMC free article] [PubMed] [Google Scholar]
- 42.Alexander WS, Starr R, Metcalf D, et al. Suppressors of cytokine signaling (SOCS): negative regulators of signal transduction. Journal of leukocyte biology. 1999;66:588–592. doi: 10.1002/jlb.66.4.588. [DOI] [PubMed] [Google Scholar]
- 43.Elliott J, Johnston JA. SOCS: role in inflammation, allergy and homeostasis. Trends in immunology. 2004;25:434–440. doi: 10.1016/j.it.2004.05.012. [DOI] [PubMed] [Google Scholar]
- 44.Babon JJ, Nicola NA. The biology and mechanism of action of suppressor of cytokine signaling 3. Growth factors (Chur, Switzerland) 2012;30:207–219. doi: 10.3109/08977194.2012.687375. [DOI] [PMC free article] [PubMed] [Google Scholar]
- 45.Hu Y, Smyth GK. ELDA: extreme limiting dilution analysis for comparing depleted and enriched populations in stem cell and other assays. Journal of immunological methods. 2009;347:70–78. doi: 10.1016/j.jim.2009.06.008. [DOI] [PubMed] [Google Scholar]
Associated Data
This section collects any data citations, data availability statements, or supplementary materials included in this article.
Supplementary Materials
Supplementary Figure 1. Signaling pathway networks and targeted drugs for CD44+/CD24−/low and MS-forming treatment-resistant tumor cells. Signaling pathway networks for (A) CD44+/CD24−/low tumor cells and (B) MS-forming treatment-resistant tumor cells with 21 FDA-approved drugs which target 7 signaling nodes in the networks. Circles are gene nodes, yellow links are protein-protein interactions, grey squares are drugs, and grey links are drug-target interactions. The color of every gene node is determined by a statistical score, i.e. −log(P-value), where P-value is the Student’s t test statistical value considering all of the probes’ value of the gene in the groups for A or B. The data scale is between 0 and 8. 0 is for no-color and 8 correspond to the dark red circle. The red oval circle indicates chloroquine (CQ).
Supplementary Figure 2. Chloroquine specifically targets CSCs. (A) CQ induces apoptosis in CD44+/CD24−/low CSC population of SUM159PT cells in MS culture. MS assay was performed with CQ (0, 1, or 5 μM) for 10 hours. Cells were trypsinized to single cells and stained with the following antibodies in 1x Annexin V binding buffer (Life Technologies); AnnexinV-Alexa488 (Life Technologies), CD44-APC (BD Bioscience), CD24-PeCy7 (BD Bioscience), and Sytox-Blue (Life Technologies). Side scatter and forward scatter were used to eliminate debris and doublets. Annexin V+ and Annexin V+/SYTOX-Blue+ populations were then gated for analysis of the CD44+/CD24−/low CSC population. The cells treated with CQ (0 μM) were used for the isotype staining (normal IgG-Alexa488, normal IgG-APC, and normal IgG-PeCy7), and the quadrant gate was established after isolation of debris and doublets. (B) CQ reduced ALDEFLUOR positive breast cancer stem cell. MDA-MB-231 and SUM159PT cells were treated with CQ for 48 hours at given concentration. ALDFLUORE positive gates were drawn based on DEAB-treated negative control cells that were all SYTOX-Blue negative. CQ decreased ALDEFLOUR positive CSCs from 24% to 0.56% in MDA-MB-231 cells and from 0.08% to 0.01% in SUM159PT cells.
Supplementary Figure 3. The combination treatment of CQ and PTX enhances cell death through inhibition of autophagy. (A) MDA-MB-468 cells stably transfected with LC3B-GFP expression vector were treated with vehicle (DMSO), CQ (1 μM), PTX (5 nM), and the combination for 24 hours. Live cells were then stained for active lysosomes using LysoTracker® Red DND-99. Nuclei were stained using Hoechst 34442 dye (100 ng/ml). For control, we observed scattered lysosomes and small occasional puncta formation of LC3B-GFP while CQ alone induced large puncta formation and decreased functional lysosomes. PTX alone induced fusion of lysosome and puncta indicated by yellow color while the combination treatment induced larger puncta formation with inhibition of the fusion between lysosomes and autophagosomes. All images were taken using an Olympus FV1000 confocal microscope with a100x objective lens and 2.5x optical zoom. The white bars indicate 10μm in length. (B) After treatment of the 4-treatment regimen, Hs578T, MDA-MB-231, and SUM159PT cells were analyzed for apoptosis using Annexin V antibody-FITC and SYTOX-Blue. CQ sensitized TNBCs to PTX within 48 hours as the combination treatment increased apoptosis significantly compared to controls or PTX alone (*p<0.05).
Supplementary Figure 4. CQ alone or in combination with PTX inhibits the PI3K/Akt/mTOR pathway by activating PTEN. SUM159PT cells were treated with Con (DMSO), CQ (3 μM), PTX (5 nM) and CQ-PTX combination for 48 hours. Western blot assays were performed to detect p-PTEN (Ser380), PTEN, p-mTOR (Ser2448), mTOR, p-Akt (Thr308) and p-Akt (Ser473), Akt, and Actin. The phosphorylation of Ser380 of PTEN inactivated phosphorylation. All others activated phosphorylation for mTOR and Akt. Due to differences in detection sensitivity, western blot assays were separately performed for Con and CQ samples from PTX and CQ-PTX samples. All antibodies were purchased from cell signaling Technology.
Supplementary Figure 5. Down-regulation of SOCS3 increased Jak2 expression levels in CSCs of SUM159PT cells. SUM159PT cells were transfected for 48 hours with control scrambled siRNA or siRNA against SOCS3. The down-regulation of SOCS3 increased Jak2 protein levels in CSCs of SUM159PT cells. siRNA-Scr : Scrambled siRNA, siRNA-SOCS3: siRNA against SOCS3.
Supplementary Figure 6. CQ does not affect DNA methylation in SUM159PT bulk tumors. SUM159PT cells were treated with Con (DMSO), CQ (1 μM), PTX (5 nM), and CQ-PTX for 48 hours. After DNA extraction, global DNA methylation was measured. CQ had no effects on DNA methylation. However, PTX induced significant DNA methylation regardless of the co-treatment of CQ. One-Way ANOVA (Tukey) was performed for statistical analysis (*p<0.05).
Supplementary Figure 7. CQ-PTX reduced expression of DNMT1 and Jak2 in vivo. (A) SUM159PT tumor tissues from the 4-week treatment experiment were stained against DNMT1 and Jak2. For the negative control, normal lung and kidney tissues were used for DNMT1 and Jak2 respectively. For the negative control, tissues were stained with secondary antibodies alone without primary antibody staining. Images were taken using a Nikon eclipse 90i microscope mounted with a DS-Fi1 bright field camera (Nikon Instruments INC., Melville, NY). All images were taken using a 20x objective lens under the same light exposure condition and a bundled software. The black bars indicate 100μm in length. (B) Western blot assay of DNMT1, Jak2, p62, p-STAT3 (Tyr705), STAT3, cleaved PARP, and actin from tumor tissue lysates. The numbers from 1 to 10 indicate individual xenograft tumors in each treatment group.
Supplementary Figure 8. CQ induces hypomethylation in SOCS3 gene. DNA methylation was analyzed using custom designed 13 PCR primer sets and the MeDIP-enriched DNA from SUM159PT CSCs, treated with PTX (5 nM) or CQ (1 μM)-PTX (5 nM). Input indicates that total fragmented genomic DNA was used for the PCR template to serve as a positive control. N-IgG indicates normal IgG which does not detect methylated DNA and serves as the IgG negative control. 5-mC Ab indicates the antibody recognizing 5-methylcytosine in DNA and was used to enrich methylated DNA. Primer negative control denotes PCR reaction with primers without templates to differentiate specific PCR from non-specific primer dimer PCR. The blue arrows indicate primers and the red designates PCR-specific products. The red rectangular boxes shows differentially methylated sites on the proximal promoter regions of SOCS3 genes in given conditions.
F and R indicate forward and reverse sequences, respectively.