

Abstract
Sulcal pits, the locally deepest points in sulci of the highly convoluted and variable cerebral cortex, are found to be spatially consistent across human adult individuals. It is suggested that sulcal pits are genetically controlled and have close relationships with functional areas. To date, the existing imaging studies of sulcal pits are mainly focused on adult brains, yet little is known about the spatial distribution and temporal development of sulcal pits in the first 2 years of life, which is the most dynamic and critical period of postnatal brain development. Studying sulcal pits during this period would greatly enrich our limited understandings of the origins and developmental trajectories of sulcal pits, and also provide important insights into many neurodevelopmental disorders associated with abnormal cortical foldings. In this paper, by using surface-based morphometry, for the first time, we systemically investigated the spatial distribution and temporal development of sulcal pits in major cortical sulci from 73 healthy infants, each with longitudinal 3T MR scans at term birth, 1 year, and 2 years of age. Our results suggest that the spatially consistent distributions of sulcal pits in major sulci across individuals have already existed at term birth and this spatial distribution pattern keeps relatively stable in the first 2 years of life, despite that the cerebral cortex expands dramatically and the sulcal depth increases considerably during this period. Specially, the depth of sulcal pits increases regionally heterogeneously, with more rapid growth in the high-order association cortex, including the prefrontal and temporal cortices, than the sensorimotor cortex in the first 2 years of life. Meanwhile, our results also suggest that there exist hemispheric asymmetries of the spatial distributions of sulcal pits in several cortical regions, such as the central, superior temporal and postcentral sulci, consistently from birth to 2 years of age, which likely has close relationship with the lateralization of brain functions of these regions. This study provides detailed insights into the spatial distribution and temporal development of deep sulcal landmarks in infants.
Keywords: Early brain development, sulcal pits, deep sulcal landmarks, longitudinal development, cortical folding, cortical surface
1. Introduction
The human cerebral cortex is highly convoluted and variable across adult individuals (Li et al., 2009; Ono et al., 1990). Sulcal pits are the locally deepest points along sulcal bottom lines in the cerebral cortex (Lohmann et al., 2008). During the human brain development, the deepest parts of primary sulci are thought as the first places to develop in an embryo’s brain and then change least as the cortex grows (Lohmann et al., 2008). Quantitative MR imaging studies provide strong evidences that the deepest parts of sulci are more genetically controlled than the superficial parts (Le Goualher et al., 1999; Lohmann et al., 1999; McKay et al., 2013). Abundant studies also indicate that there are particularly spatial relationships between the deepest parts of sulci and functional areas (Lohmann et al., 2008; Piao et al., 2004; Rakic, 1988, 2004; Smart and McSherry, 1986; Welker, 1990).
Accordingly, sulcal pits have drawn increasing attentions in neuroimaging studies in the past few years (Im et al., 2010; Im et al., 2013; Lohmann et al., 2008; McKay et al., 2013). Lohmann et al. first examined sulcal pits in volumetric MR images and observed that the spatial distribution of sulcal pits in major sulci was strikingly regular across adult individuals, despite their highly variable cortex foldings (Lohmann et al., 2008). Then, Im et al. proposed a more reliable sulcal pits extraction approach on cortical surfaces reconstructed from MR images (Im et al., 2010; Im et al., 2013). In this method, a watershed algorithm based on the sulcal depth was used to partition the cortical surface into many basins, and then the deepest point in each basin was identified as the sulcal pit, after pruning basins with shallow sulcal depths or small sizes. The results in (Im et al., 2010) confirmed the observations in (Lohmann et al., 2008), and further revealed the hemispheric asymmetries of sulcal pits. According to these studies, sulcal pits in major cortical sulci were considered as reliable anatomical landmarks and some of them could be potentially helpful for the challenging problem of inter-subject brain MR image registration (Li et al., 2010; Lohmann et al., 2008). Im et al. (Im et al., 2013) further investigated the relationships between the presence of sulcal pits and intelligence, and found that, in the left posterior inferior frontal sulcus and the right posterior inferior temporal sulcus, the number of sulcal pits of young adults with high IQ was significantly different from that of young adults with average IQ. McKay et al. (McKay et al., 2013) specifically studied the central sulcus in adults and found that most adult individuals had two peaks in the sulcal depth position profiles, close to the hand and mouth regions, where the peak genetic heritability of the sulcal depth occurred. By tracking the cortical surface development of 4 neonates between birth and four weeks of age (Lefevre et al., 2009), Lefèvre et al. found that the cortical surfaces grew in a radial manner from some growth seeds. They suggested that the concepts of growth seeds, sulcal roots (Regis et al., 2005) and sulcal pits might be merged into one kind of entity that could be stable across individuals.
However, to our knowledge, most existing imaging studies of sulcal pits were mainly focused on adult brains, while little is known about the spatial distribution and temporal development of sulcal pits in the normal infants from birth to 2 years of age. Note that the first 2 years of life is the most dynamic and critical period of the postnatal brain structural and functional development (Knickmeyer et al., 2008; Li et al., 2014c; Lyall et al., 2014; Nie et al., 2012b; Nie et al., 2013b), with the cortical surface area expansion 1.8 times in the first year and 1.2 times in the second year (Li et al., 2013), although major cortical sulci are already present at term birth (Chi et al., 1977; Dubois et al., 2008; Hill et al., 2010a). Increasing evidences also suggest that many neurodevelopmental disorders are likely the results of abnormal brain development during this critical period of rapid cortex growth (Gilmore et al., 2012). Thus, studying sulcal pits during this period would greatly increase our currently limited understanding of the developmental trajectories of sulcal pits and also provide important insights into the neurodevelopmental disorders associated with abnormal cortical foldings. In this paper, by using the cortical surface based morphometry, for the first time, we systematically study the spatial distribution of sulcal pits and their temporal development from 73 healthy infants, each with 3 longitudinal MR scans at term birth, 1 year, and 2 years of age. Our results suggest that the spatially consistent distributions of sulcal pits in major sulci across subjects have already existed at term birth. Meanwhile, though the cortex expands dramatically and the sulcal depth increases considerably, the spatial distributions of major sulcal pits keep relatively stable in the first 2 years. Importantly, the depth of sulcal pits exhibits a regionally heterogeneous growth, with more rapid growth in the high-order association cortex, including the prefrontal and temporal cortices, than the sensorimotor cortex in the first 2 years of lift. Moreover, our results reveal certain hemispheric asymmetries in infants.
2. Materials and Methods
Subjects
This study was approved by the Institutional Review Board of the University of North Carolina (UNC) School of Medicine. The UNC hospitals recruited pregnant mothers during their second trimesters of pregnancy, with the informed consents obtained from both parents. Subjects were excluded if the fetal ultrasound was abnormal or the mother had major medical diseases or psychotic illness. The infants in the study cohort did not have any congenital anomaly, metabolic disease or focal lesion. Before scanning, the infants were fed, swaddled, and fitted with ear protection, and none of them was sedated (Gilmore et al., 2012; Li et al., 2013; Shi et al., 2011).
MR images were longitudinally acquired for all 73 healthy infants at 0, 1 and 2 years of age. Specifically, the study group consisted of 31 singletons (including 20 males and 11 females) and 42 twins (including 22 males and 20 females). For the twins, there were 7 monozygotic twin pairs, 10 dizygotic twin pairs and 8 “single” twins (Gilmore et al., 2012). The mean gestational age at birth for all the 73 infants was 37.9±1.6 weeks. The mean age at each scanning time point is provided in Table 1. No gender difference of ages at scanning was found at any of the three time points. This dataset has been used in prior studies of the development of the cortical gray matter volume (Gilmore et al., 2012), the expansion of the cortical surface area (Li et al., 2013), and the hemispheric asymmetries of the cerebral cortex (Li et al., 2014b) in infants.
Table 1.
The mean ages at the MR scanning of the 73 infants at 0, 1 and 2 years of age, as well as 64 young adults.
| 0 year (days) | 1 year (days) | 2 years (days) | Adults (years) | |
|---|---|---|---|---|
| Male | 27.3±13.1 | 390.0±21.6 | 765.4±37.4 | 18.7±1.4 |
| Female | 23.0±6.1 | 396.6±22.4 | 748.2±37.4 | 18.9±1.4 |
| All | 25.5±10.8 | 392.8±22.1 | 758.1±38.1 | 18.9±1.4 |
To closely compare sulcal pits in infants to those in adults, we also studied a cohort of 64 healthy young adults, including 29 males and 35 females. Yong adult data were obtained from a subset of the Pediatric MRI Data Repository (Release 4.0) created for the NIH MRI Study of Normal Brain Development (Evans, 2006), a multi-site project aimed at providing a normative database to characterize healthy brain maturation in relation to behavior (Nie et al., 2013a). The average age of these young adults was 18.9±1.4 years.
MR Image Acquisition
For infants, MR images were acquired by using a Siemens head-only 3T scanner with a circular polarized head coil. For T1-weighted images, 160 sagittal slices were acquired with the three-dimensional magnetization-prepared rapid gradient echo (MPRAGE) sequence: TR = 1900 ms, TE = 4.38 ms, inversion time = 1100 ms, flip angle = 7°, and resolution = 1×1×1 mm3. For T2-weighted images, 70 transverse slices were acquired with turbo spin-echo (TSE) sequences: TR = 7380 ms, TE = 119 ms, flip angle = 150°, and resolution = 1.25×1.25×1.95 mm3 (Gilmore et al., 2012; Shi et al., 2011). The T2-weighted image was linearly aligned onto its counterpart of T1-weighted image and then resampled to the resolution of 1×1×1 mm3.
For young adults, a three-dimensional T1-weighted Spoiled Gradient Recalled (SPGR) echo sequence from 1.5T scanners was obtained on each participant, with 1 mm isotropic data acquired sagittally from the entire head. Slice thickness of 1.5 mm was allowed for GE scanners due to their limit of 124 slices. Total acquisition time was about 25 min and was often repeated when indicated by the scanner-side quality control process. More details on image acquisition can be found in (Evans, 2006).
Image Preprocessing
All MR images were preprocessed by the following pipeline. First, skull, cerebellum and brain stem were automatically removed (Shi et al., 2012). Second, intensity inhomogeneity was corrected using N3 method (Sled et al., 1998). Third, each image was rigidly aligned to the age-matched brain atlas (Shi et al., 2011). Fourth, tissue segmentation of MR images was performed by using a longitudinally-guided coupled level-sets method (Wang et al., 2013a; Wang et al., 2013b). Fifth, non-cortical structures were automatically masked and filled, and each brain was further separated into left and right hemispheres. More details on image preprocessing can be found in (Li et al., 2014b; Li et al., 2014c).
Cortical Surface Reconstruction and Registration
For each hemisphere of each image, a topologically-correct and geometrically-accurate cortical surface was reconstructed using a deformable surface method (Li et al., 2014a; Li et al., 2012). Herein, we adopted the inner cortical surface (white-gray matter interface) for sulcal pits analysis, in order to closely compare with the existing results on adult brains (Im et al., 2010; Im et al., 2013; Lohmann et al., 2008). To analyze the hemispheric asymmetries of sulcal pits, the inner cortical surface of the right hemisphere was mirror-flipped to its corresponding left hemisphere along the midsagittal plane (Li et al., 2014b). Each inner cortical surface was then smoothed, inflated, and mapped to a standard sphere (Fischl et al., 1999). To establish both inter-subject and left-right unbiased cortical correspondences, all spherical cortical surfaces of the left hemisphere and mirror-flipped right hemisphere at the same age were nonlinearly aligned to the age-matched, left-right unbiased surface atlases (Li et al., 2014b) by using Spherical Demons (Yeo et al., 2010). To establish longitudinal cortical correspondences, the spherical cortical surfaces at birth were aligned onto the corresponding spherical cortical surfaces at 1 year of age, and then the spherical cortical surfaces at 1 year of age were aligned onto the corresponding spherical cortical surfaces at 2 years of age, using Spherical Demons (Yeo et al., 2010). All cortical surface reconstruction and alignment results were visually checked to ensure reasonable accuracy.
Sulcal Pits Extraction
For each vertex on the cortical surface, the sulcal depth, defined as the distance from the vertex to the closest point in the cerebral hull surface, was computed using the method in (Li et al., 2014b). Then, a watershed algorithm was applied to the sulcal depth map on the surface mesh for extracting sulcal pits, as in (Im et al., 2010). Specifically, 1) a vertex with the currently largest sulcal depth was first picked out; 2) if none of its one-ring neighbor was labeled, this vertex was then selected as a sulcal pit and assigned with a new label; if it had a labeled neighbor, this vertex was assigned with the same label as its labeled neighbor; if it had at least 2 neighbors with different labels, this vertex was assigned with the label of the closest neighbor; 3) the steps 1 and 2 were repeated until the sulcal depth of the currently picked vertex was less than a predefined threshold T, as we are only interested in deep sulcal pits. To avoid the over extraction of sulcal pits, three threshold parameters (area A, distance D and ridge height R) were also introduced, as in (Im et al., 2010). Specifically, area A was used to exclude those sulcal pits in very small basins. Distance D was used to prevent two sulcal pits from being too close to each other. And ridge height R was the sulcal depth difference between a candidate sulcal pit and the ridge point of neighboring basins, as explained in Figure 1, and was used to check whether a candidate sulcal pit was significantly different from its neighboring sulcal pits. For a candidate sulcal pit, if it failed to pass the threshold A (area) or D (distance), and also failed to pass the threshold R (ridge height), it will not be included as a sulcal pit; otherwise, this candidate sulcal pit will be kept as a sulcal pit.
Figure 1.
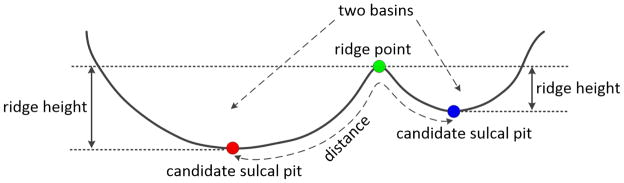
A 2D schematic illustration of the ridge height R, defined as the sulcal depth difference between a ridge point (green point) and a candidate sulcal pit (red or blue point).
For the adult brains with relatively stable brain size across individuals, these threshold parameters could be set as fixed values for all subjects (Im et al., 2010). However, in developing infants, the variations of the brain size across different subjects at different ages are quite large, thus using fixed values for these parameters is not suitable for infant studies. To find suitable parameters for these thresholds, we performed exhaustive searching from a range of each parameter based on the randomly-selected 10 infants with manually-labeled “ground truth” of sulcal pits. Specifically, we first performed the watershed algorithm to over extract sulcal pits at 0, 1 and 2 years of age, and manually removed those false sulcal pits. Then, for each surface, an exhaustive searching from a range of each parameter was performed to find a group of optimal parameters that led to the fewest false positive and false negative sulcal pits, compared with those manually defined results. We found that the optimal results were obtained by setting D as 10 rings neighborhood on the resampled cortical surface with 168,324 vertices and R as 2.5 mm. However, the optimal parameters for A and T varied significantly across different cortical surfaces. Therefore, we further investigated the relationships between A and the total area of the cortical surface. By performing a linear regression, we found that the optimal A has the following approximate relationship with the total area S of the cortical surface:
| (1) |
Similarly, we found that the optimal T has the following approximate relationship with the maximum sulcal depth M of the cortical surface:
| (2) |
Therefore, in all our following analysis, we fixed the parameters D as 10 rings and R as 2.5 mm, while computed the parameters A and T adaptively for each infant cortical surface based on Eqs. (1) and (2), respectively. More information on defining the “ground truth” and parameter selection can be found in Supplementary Materials.
Figure 2 showed the sulcal pits extraction results on the cortical surfaces of the left hemispheres of a representative infant at 0, 1, and 2 years of age. The sulcal pits were represented by white points and the cortical surfaces were color-coded by the sulcal depth. As we can see, the cortical surface grew dynamically and the sulcal depth increased considerably, especially in the first year of life. Due to the convoluted cortical folding, it is difficult to observe the sulcal pits in some deep sulci. For better inspection, sulcal pits were also mapped onto the partially inflated cortical surfaces, as shown in the second, fourth and sixth rows of Figure 2. As we can see, though the infant cortical surface developed dramatically in the first two years of life, the spatial distribution of deep sulcal pits in major sulci was temporally relatively consistent. For example, as can be observed in the third and fourth rows, there consistently existed two sulcal pits in the central sulcus and their relative positions were nearly unchanged in the first 2 years, though the central sulcus became much longer and deeper.
Figure 2.

Sulcal pits extraction results on the left hemisphere of a representative infant at 0, 1 and 2 years of age. In the first, third and fifth rows, the sulcal pits represented by white points are overlaid on the cortical surfaces, color-coded by the sulcal depth (mm). For better inspection, in the second, fourth and sixth rows, the sulcal pits represented by red points are mapped onto the partially inflated cortical surfaces.
Computing Sulcal Pits Concentration Regions and Frequencies
To examine the spatial distributions of sulcal pits across individuals at each age, all the sulcal pits from 73 infants were mapped onto the age-matched inflated surface atlases. Each infant contained sulcal pits in both minor and major sulci, and those sulcal pits in minor sulci were highly variable across individuals and often turned out to be the isolated points when mapped onto the surface atlas. Therefore, a clustering algorithm was adopted to remove those minor and variable sulcal pits. As most of major sulcal pits across subjects were spatially-close and concentrated together, a relatively intuitive clustering algorithm was adopted and worked reasonably well. Specifically, 1) for a sulcal pit that had not been classified to any cluster, a new cluster C was created, and all the vertices in its two-ring neighborhood without being visited previously were pushed into a queue Q. 2) A vertex was popped from Q; if this vertex was a sulcal pit, it was added to the cluster C, and all vertices in its two-ring neighborhood (without being visited before) were pushed into Q. 3) The process in step 2 was repeated until the queue Q was empty. 4) The steps from 1 to 3 were repeated until all sulcal pits had been classified. 5) If the number of sulcal pits in a cluster was no more than 7 (≈10% of 73 subjects), this cluster was removed.
After sulcal pits clustering, we further extracted the concentration regions on the cortical surface based on the spatial distribution of sulcal pits, and computed the frequency of sulcal pits appearing in each concentration region, according to the following 5 steps.
Based on the sulcal pits clustering result, each vertex in an infant cortical surface was assigned a density value. Specifically, if a vertex was a sulcal pit and its corresponding vertex in the surface atlas was in a cluster, the density value was set as 1; otherwise, the density value was set to as 0.
All infant cortical surfaces from 0 to 2 years of age were mapped onto the surface atlas at 1 year of age, and the density value of each vertex in this atlas surface was calculated as the sum of the density values of the corresponding vertices from all the cortical surfaces at 0, 1 and 2 years of age.
-
The density map was further smoothed by 20 iterations using an anisotropic smoothing method that smoothed the density map along the orientations of sulci, based on the normal direction information. Note that, as the density map was computed from 73 subjects, the density values were sparsely distributed in sulci. Therefore, without smoothing, it would lead to many small regions when using the watershed method in the next step. Specifically, the anisotropic smoothing of the density values was formulated as:
(3) At the vertex i, d(i, t) is the density value at the iteration t, p(i) is the 3D coordinate position of vertex i, and n(i) and n(j) are the respective normal directions. S(n(i)·n(j)) is defined as: if n(i) ·n(j)>0, S(n(i) ·n(j))= n(i) ·n(j); otherwise, S(n(i) · n(j))=0. N(i) is the N-ring neighborhood of the vertex i. Herein, we experimentally adopted N=3 in our results.
A watershed method, which stopped when the density value was less than 0.04, was performed on the smoothed density map to partition the surface atlas at 1 year of age into regions. Then these regions were mapped back onto the surface atlases of 0 and 2 years of age. Results of concentration regions with respect to different settings of parameters can be found in Supplementary Materials.
The frequency of sulcal pits appearing in each concentration region was computed. Specifically, if a sulcal pit in an infant surface was mapped into a region in the corresponding age-matched surface atlas, the frequency of this region was increased by one. If two or more sulcal pits from an infant cortical surface were mapped into the same region, only one sulcal pit was counted. Finally, the frequency was normalized by the number of subjects.
3. Results
Spatial Distributions of Sulcal Pits
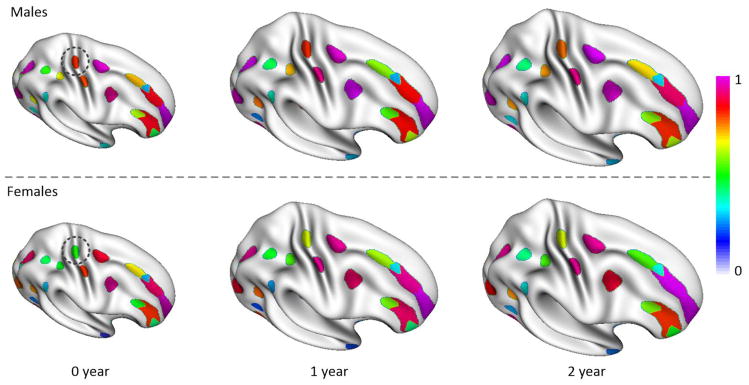
We extracted sulcal pits from the cortical surfaces of all 73 infants at birth, 1 and 2 years of age. To examine the spatial distribution of sulcal pits across individuals at each age, all the sulcal pits from 73 infants were mapped onto the age-matched inflated surface atlas, as shown in Figure 3. Specifically, the sulcal pits extracted from all 73 infant scans at birth were mapped onto the surface atlas at birth, as shown in the first column of Figure 3. Similarly, the sulcal pits extracted from all the scans at 1 year (2 year) of age were mapped onto the corresponding surface atlas at 1 year (2 year) of age, as shown in the second (third) column of Figure 3. As can be seen, the sulcal pits of the infant population were consistently concentrated in some specified regions from 0 to 2 years of age. This pattern was particularly pronounced in major sulci, such as the central sulcus, precentral sulcus, postcentral sulcus, superior temporal sulcus, and parieto-occipital sulcus. For example, in the central sulcus, we identified two distinct clusters of sulcal pits on both left and right hemispheres at birth. During the dynamic cortex development from 0 to 2 years of age, the relative positions of concentration regions kept almost unchanged. These results suggest the existence of spatially-consistent distributions of sulcal pits in major sulci across subjects at term birth, and these spatial distribution patterns are relatively stable during the dynamic cortex development in the first 2 years of life. In addition, individual’s average change of sulcal pit number was 3.67±0.13 in the first year and 1.30±0.67 in the second year. The change of individuals’ sulcal pit number was very small, and was likely caused by the development of minor sulci or noises in the surface-processing pipeline. To closely compare the distributions of sulcal pits in infants with those in adults, we also applied our method to the cortical surfaces of 64 young adults. As shown in the fourth column of Figure 3, the spatial distributions of sulcal pits in major sulci of adults were highly consistent with those of infants, though more sulcal pits in minor sulci existed in adults. For more discussions on difference between infants and adults, please see the Supplementary Materials.
Figure 3.

Spatial distributions of sulcal pits on both left and right hemispheres from 73 infants at 0, 1, 2 years of age and also 64 young adults. All the sulcal pits (red points) were mapped onto the age-matched, partially-inflated cortical surface atlases.
To better examine the hemispheric asymmetries of the sulcal pits, we mapped the sulcal pits of right hemispheres onto the left hemispheric surface atlases, as shown in Figure 4. The sulcal pits of left hemispheres were represented by red points, while the sulcal pits of right hemispheres were represented by green points. In most cortical regions, the spatial distributions of sulcal pits were relatively symmetric. However, several regions exhibited strong asymmetries of the sulcal pits distribution. For example, in the central sulcus, sulcal pits in the left hemisphere were more superior in position, compared with those in the right hemisphere. In the superior temporal sulcus, the sulcal pit cluster close to the temporal pole was more anterior in the right hemisphere than in the left hemisphere. In contrast, the sulcal pit cluster close to the Heschl’s gyrus (primary auditory cortex) in the left hemisphere was more anterior than that in the right hemisphere. In addition, a sulcal pit cluster at the superior part of the postcentral sulcus existed in the left hemisphere, but it didn’t appear in the right hemisphere. These asymmetric patterns were generally quite stable from birth to 2 years of age. Certain longitudinal changes were also observed. For example, the number of sulcal pits in the left superior temporal sulcus was much larger than that in the right hemisphere at 2 years of age, compared to birth and 1 year of age. Note that left-right cortical hemispheric correspondences were established by alignment all spherical surfaces of left hemispheres and mirror-flipped right hemispheres onto the left-right unbiased and age-matched spherical surface atlases (Li et al., 2014b), based on the cortical folding geometries of average convexity and mean curvature, using Spherical demons. Therefore, left-right hemispheric correspondences were largely unbiased to any hemisphere. Thus, the positional asymmetries of sulcal pits on the surface atlases largely reflected their left-right positional differences relative to the sulci.
Figure 4.

Hemispheric asymmetries of the spatial distributions of sulcal pits at birth, 1 and 2 years of age. The red points are the sulcal pits from left hemispheres, while the green points are the sulcal pits from right hemispheres, but mapped onto the left hemisphere surface atlases.
Concentration Regions of Sulcal Pits
Based on the spatial distributions of sulcal pits, we further partitioned the cortical surface as a set of concentration regions of sulcal pits, as shown in Figure 5, where each region was assigned an anatomical label. Both left and right hemispheres had 54 concentration regions of sulcal pits, and most of the concentration regions in the two hemispheres were one-to-one mapped. Also, most major sulci contained 2 to 4 concentration regions. One notable exception was that the cingulate sulcus, which was quite long and variable across individuals, contained 7 concentration regions in the left hemisphere and 6 concentration regions in the right hemisphere. Some short sulci only contained one concentration region, such as the lateral occipital sulcus, olfactory sulcus, subparietal sulcus and parieto-occipital sulcus. As each infant twin pair shared certain genetic information, which might affect the similarity of their sulcal morphologies, we repeated our experiments by removing one subject for each twin pair and achieved similar results (Figure S9, Supplementary Material).
Figure 5.
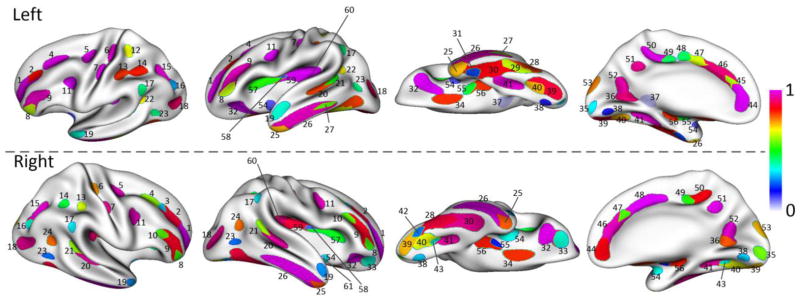
The concentration regions of the sulcal pits color-coded by their frequencies, overlaid on the partially inflated surface atlas at 1 year of age. The label for each of 61 concentration regions is assigned as follows: (1~4) superior frontal sulcus a, b, c and d; (5) junction between superior frontal sulcus and precentral sulcus; (6~7) central sulcus a and b; (8~10) inferior frontal sulcus a, b and c; (11) junction between precentral sulcus and inferior frontal sulcus; (12~13) postcentral sulcus a and b; (14~16) intraparietal sulcus a, b and c; (17) junction between intraparietal sulcus and superior temporal sulcus; (18) lateral occipital sulcus; (19~22) superior temporal sulcus a, b, c and d; (23~24) anterior occipital sulcus a and b; (25~27) inferior temporal sulcus a, b and c; (28~31) occipito-temporal sulcus a, b, c and d; (32~33) orbital sulcus a and b; (34) olfactory sulcus; (35~37) calcarine sulcus a, b and c; (38~43) collateral sulcus a, b, c, d, e and f; (44~50) cingulate sulcus a, b, c, d, e, f and g; (51) subparietal sulcus; (52) parieto-occipital sulcus; (53) junction between parieto-occipital sulcus and calcarine sulcus; (54~61) circular insular sulcus a, b, c, d, e, f, g and h. Note that, although most concentration regions are symmetric in two hemispheres, some concentration regions only appear in one hemisphere.
To inspect the temporal changes of the frequency of sulcal pits appearing in each concentration region, Figure 6 provided the frequency maps at birth, 1 and 2 years of age. As can be seen, although the frequency maps across ages were not strictly the same, high frequency regions were consistently found in major sulci, such as the central, precentral, postcentral, superior temporal, superior frontal, cingulate, parieto-occipital and calcarine sulci at all three ages. The frequency map was generally stable during the dynamic cortex development in the first 2 years, with some regions showing gradual increases. To make a close comparison with adults, we also provided the frequency maps of 64 adults in Figure S10 of Supplementary Materials, where high frequency regions were also found in major sulci.
Figure 6.

The frequency maps of sulcal pits appearing in concentration regions of 73 infants at birth, 1 and 2 years of age. The frequency map is generally stable during the cortex development in the first 2 years.
Several notable hemispheric asymmetries can be observed in the concentration regions of sulcal pits. For example, in the central sulcus, the frequency of the concentration region in its superior part (concentration region 6) on the left hemisphere was much higher than that on the right hemisphere consistently from birth to 2 years of age. Similarly, in the postcentral sulcus, the frequency of the concentration region in its middle part (concentration region 13) on the left hemisphere was also larger than that on the right hemisphere consistently from birth to 2 years of age. Moreover, in the postcentral sulcus, there existed a concentration region of sulcal pits in its superior part (concentration region 12) on the left hemisphere, but no corresponding region on the right hemisphere, which was also observed in adults (Figure S10, Supplementary Materials). In the superior temporal sulcus, there were four concentration regions of sulcal pits (concentration regions 19, 20, 21 and 22) on the left hemisphere, but only three concentration regions on the right hemisphere (concentration regions 19, 20 and 21). In the left superior temporal sulcus, the frequency of the concentration region was highly consistent at birth, 1 and 2 years of age; while in the right superior temporal sulcus the frequency of the concentration region 21 decreased from birth to 1 year of age, and meanwhile the frequency of its neighboring concentration region 20 increased. This may suggest that the sulcal pits in the right superior temporal sulcus shifted towards the anterior part along the sulcus. In addition, the frequency of the concentration region on the left temporal pole was consistently larger than that on the right temporal pole during the first 2 years.
We also investigated the growth of the mean depth of the sulcal pits in each concentration region in the first 2 years of life, as shown in Figure 7. The mean depths of concentration regions increased dramatically in the first year and moderately in the second year, with regionally heterogeneous growth patterns. In the first year, the superior frontal sulcus (concentration regions 1 and 2), inferior frontal sulcus (concentration regions 8 and 9), superior temporal sulcus (concentration regions 19 and 20) and inferior temporal sulcus (concentration regions 25 and 26) exhibited high growth of the mean depth of sulcal pits. The central sulcus (concentration regions 6 and 7), calcarine sulcus (concentration region 36), and insular cortex exhibited low growth of the mean depth of sulcal pits. In the second year, concentration regions on the lateral surface exhibited larger growth than those on the medial surface.
Figure 7.

The increasing percentage of the mean depth of sulcal pits in each concentration region from 0 to 1, 1 to 2, and 0 to 2 years of age.
Gender Differences of Sulcal Pits
Gender differences of sulcal pits during the first 2 years were also investigated. For each infant, we computed the mean depths for all sulcal pits at birth, 1 and 2 years of age, as shown in Figure 8. Table 2 further provided the mean values and standard deviations of mean depths of the sulcal pits of the infant population from 0 to 2 years of age. By including the age as a confounding factor, the mean depth of sulcal pits in males was consistently larger than that of females at 0, 1 and 2 years of age, with the p-values consistently smaller than 0.05. However, by including both the age and total brain volume (TBV) as confounding factors, no significant difference between males and females was found in the mean depth of sulcal pits. Figure 9 shows that the mean depth of sulcal pits and the TBV are approximately linearly correlated (r>0.96), suggesting that the gender difference of the mean depth of sulcal pits are primarily induced by their brain volume differences.
Figure 8.
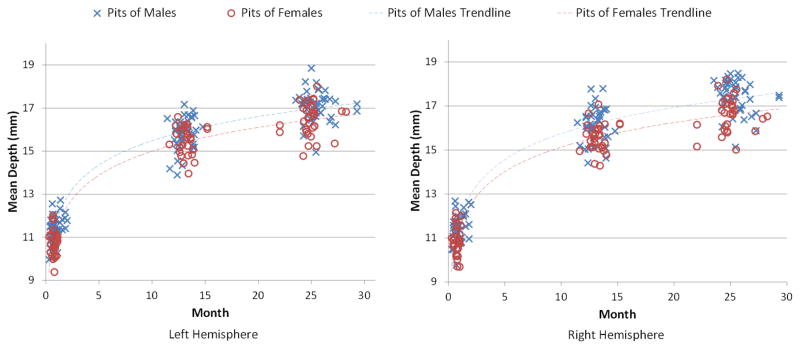
The distributions of the mean depths of sulcal pits of 73 infants at 0, 1 and 2 years of age.
Table 2.
The mean depth (mm) of sulcal pits of the whole cortical surface.
| Mean Depth (mm) | 0 year | 1 year | 2 years | |||
|---|---|---|---|---|---|---|
| Males | Females | Males | Females | Males | Females | |
| Left | 11.37±0.63 | 10.76±0.59 | 15.83±0.72 | 15.47±0.66 | 17.11±0.69 | 16.47±0.76 |
| Right | 11.40±0.65 | 10.89±0.63 | 16.14±0.77 | 15.55±0.62 | 17.45±0.75 | 16.65±0.77 |
Figure 9.
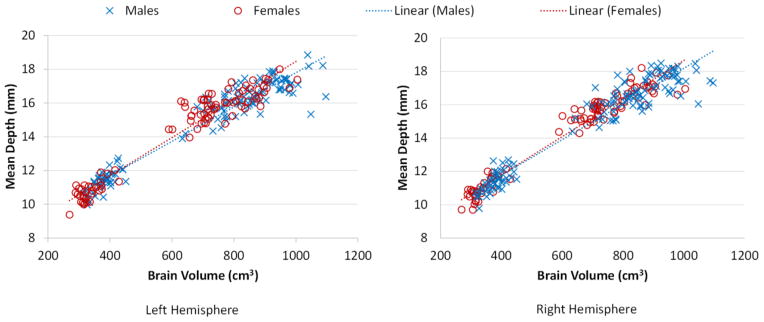
The distributions of the mean depths of sulcal pits of 73 infants with respect to their total brain volumes (r>0.96).
Gender differences were also found on the hemispheric asymmetries of mean depth of sulcal pits. For males, the mean depth of sulcal pits in the right hemisphere was significantly larger than that in the left hemisphere at 1 and 2 years of age (p ≪ 0.05), but not at birth. For females, no significant hemispheric asymmetry of the mean depths of sulcal pits was observed at birth, 1 and 2 years of age. Table 3 further showed the growth percentages of the mean depths of sulcal pits from 0 to 2 years of age. As we can see, the mean depth of sulcal pits increased dramatically in the first 2 years. Specifically, the mean depth of males increased 40.74±9.08% in the first year and 8.27±3.80% in the second year, while the values of females increased 43.72±8.70% in the first year and 6.81±3.50% in the second year.
Table 3.
The growth percentage of the mean depths of sulcal pits of the whole cortical surface.
| Growth Percentage (%) | 0~1 year | 1~2 year | 0~2 year | |||
|---|---|---|---|---|---|---|
| Males | Females | Males | Females | Males | Females | |
| Left | 39.61±8.59 | 44.10±8.24 | 8.18±4.08 | 6.50±2.85 | 50.84±7.56 | 53.42±8.87 |
| Right | 41.86±9.52 | 43.45±9.26 | 8.28±3.55 | 7.12±4.07 | 53.48±9.67 | 53.40±9.14 |
We also computed the normalized mean depth of sulcal pits, which was defined as the ratio between the mean depth of sulcal pits and the mean depth of the whole cortical surface, as shown in Figure 10 and Table 4. The temporal change of the normalized mean depth reflected the relationship between the development of sulcal pits and the development of the cortex. In the first year, the normalized mean depth of sulcal pits decreased dramatically, suggesting that the depth increase of sulcal pits was smaller than that of the whole cortex. This is likely related to the fact that major sulci become longer and new minor sulci emerge and develop, leading to more convoluted areas. In the second year, the normalized mean depth of sulcal pits kept almost unchanged. By regressing out both age and TBV, there was no significant difference in the normalized mean depth of sulcal pits between males and females at term birth, 1 year and 2 years of age.
Figure 10.
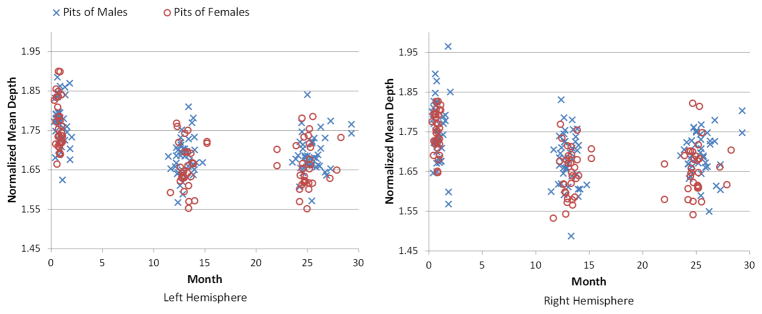
The distributions of the normalized mean depths of sulcal pits of 73 infants at 0, 1 and 2 years of age.
Table 4.
The normalized mean depth of sulcal pits of the whole cortical surface.
| Normalized Mean Depth | 0 year | 1 year | 2 years | |||
|---|---|---|---|---|---|---|
| Males | Females | Males | Females | Males | Females | |
| Left | 1.77±0.06 | 1.76±0.06 | 1.68±0.05 | 1.66±0.06 | 1.69±0.05 | 1.66±0.06 |
| Right | 1.75±0.08 | 1.75±0.05 | 1.67±0.07 | 1.65±0.06 | 1.69±0.05 | 1.66±0.07 |
Meanwhile, we also investigated the frequency of the concentration regions of sulcal pits for males and females separately, and found no strong gender differences in almost all sulcal regions. However, we found one instance of pronounced gender difference in the central sulcus on the right hemisphere, as shown in Figure 11. As can be seen, in the superior part of the central sulcus, the frequency of the concentration region of sulcal pits of males was consistently higher than that of females in 0, 1 and 2 years of age.
Figure 11.
Frequency of concentration regions of sulcal pits on the right hemisphere for males and females separately at 0, 1 and 2 years of age.
4. Discussion
Spatial Distribution and Temporal Development of Sulcal Pits in Infants
For the first time, we find that sulcal pits in major sulci across infant subjects are spatially highly-consistent and clustered in certain cortical regions at term birth. Moreover, the spatial distributions of sulcal pits are temporally relatively stable in the first 2 years, despite the dynamic cortical surface expansion and sulcal depth increase during this stage. Our results in infants are consistent with our results in young adults and also the previous studies in adults (Im et al., 2010; Lohmann et al., 2008), where sulcal pits in major sulci are found spatially consistent across subjects. Taken together, the spatially consistent distributions of sulcal pits are largely established at term birth, and are kept stable during postnatal brain development. These results also support the findings that major cortical foldings are well established (Chi et al., 1977; Hill et al., 2010a) at term birth, and well preserved during postnatal brain development (Li et al., 2013).
We identify 54 concentration regions of sulcal pits in each hemisphere, though the concentration regions in the left and right hemispheres are not strictly one-to-one mapped. Concentration regions in major sulci show high frequency, such as the central sulcus, precentral sulcus, superior frontal sulcus, inferior frontal sulcus, intra-parietal sulcus, superior temporal sulcus, parieto-occipital sulcus and cingulate sulcus. In the previous study of adults (Im et al., 2010), 48 concentration regions on the left hemisphere and 47 concentration regions in the right hemisphere are found. For most concentration regions, our results in infants are generally consistent with our results in young adults and also the results in (Im et al., 2010). For examples, in both studies, most major sulci contain 2 to 4 concentration regions, and the cingulate sulcus has more than 4 concentration regions. The different numbers of concentration regions between our results and (Im et al., 2010) are likely due to the methodology differences and age range differences of subjects. For example, there are 2 concentration regions in the central sulcus in both our infant and adult results, approximately corresponding to the positions of sulcal roots in (Cachia et al., 2003), but 3 concentration regions in the previous study of adults (Im et al., 2010). In fact, the frequency of the extra concentration region in (Im et al., 2010) is quite low (less than 30%), and this region is also reported as the central sylvian sulcus in (Perrot et al., 2011). Note that our results are consistent with the findings that there are two primitive folds in the central sulcus (Cachia et al., 2003; Lefevre et al., 2009; Lohmann et al., 2008; McKay et al., 2013; Operto et al., 2012; Regis et al., 2005).
The depth of sulcal pits exhibits regionally heterogeneous development, with high growth in the high-order association cortex, including prefrontal cortex and temporal cortex, and low growth in the central sulcus (the boundary between primary motor cortex and somatosensory cortex) in the first 2 years. In the previous studies of cortical surface area expansion in infants, the prefrontal cortex and temporal cortex exhibit high expansion, while the central sulcus exhibits low expansion (Li et al., 2013). The high growth of the depth of sulcal pits in the association cortex likely leads to the high expansion of cortical surface area in these regions. Evolutionary high-expansion of cortical surface area between macaque and human is also found in the prefrontal and temporal cortices (Hill et al., 2010b). The association cortex corresponds to phylogenetically late-developing regions that are essential to the human-specific cognitive functions such as reasoning and language (Goldman-Rakic, 1988; Mueller et al., 2013). Our results also suggest that the association cortex is relatively immature in structure compared to the sensorimotor cortex at term birth.
Hemispheric Asymmetries of Sulcal Pits in Infants
We found 4 concentration regions in the left superior temporal sulcus (STS) and 3 concentration regions in the right STS, which are consistent with the results in adults (Im et al., 2010). In addition, in the STS, the sulcal pits cluster close to the temporal pole was found to be more anterior in the right hemisphere than that in the left hemisphere. In both infants and adults, hemispheric structural asymmetries have been found in STS. For example, both sulcal depth and cortical surface area in the right STS are larger than those on the left STS (Glasel et al., 2011; Hill et al., 2010a; Li et al., 2014b; Van Essen, 2005; Van Essen et al., 2012). These asymmetries may be related to the fact that the STS appears 1 or 2 weeks earlier in the right hemisphere than in the left hemisphere in fetuses (Chi et al., 1977; Habas et al., 2012). STS has also been reported to relate to the functional asymmetry (Emmorey et al., 2003; Good et al., 2001; Penhune et al., 1996; Sowell et al., 2002). Language function, one of the most famous functional asymmetries, is reported to be associated with the lateralization to the left superior temporal gyrus (Balsamo et al., 2002; Binder et al., 1997; Bleich-Cohen et al., 2009; Karbe et al., 1995; Tzourio et al., 1998). Thus, it has been suggested that the hemispheric asymmetry of sulcal pits in STS may be related to the language function lateralization (Im et al., 2010).
In our results, as all left and right hemispheres were aligned based on the cortical folding, the position asymmetries of sulcal pits largely reflect the left-right positional difference relative to the sulci. We have provided Figures S11-S12 in Supplementary Materials to illustrate absolute positional asymmetries of sulcal pits. The infant cortical surfaces exhibit the most prominent vertex position asymmetries around the supramarginal gyrus (SMG), with the left SMG being significantly inferior and posterior to the right SMG (Li et al., 2014a), which likely leads to the absolute positional asymmetries of sulcal pits in the superior temporal sulcus.
The postcentral sulcus has two concentration regions in the left hemisphere, but only one concentration region in the right hemisphere in both infants and young adults. Meanwhile, the frequency of concentration regions in the postcentral sulcus in the left hemisphere is consistently higher than that in the right hemisphere from birth to 2 years of age, consistent with the results in adults (Im et al., 2010). The cortical surface area of the postcentral gyrus (somatosensory cortex) in the left hemisphere has been found significantly larger than that in the right hemisphere in both infants (Li et al., 2014b) and adults (Jung et al., 2003), suggesting that the asymmetries of sulcal pits in the postcentral sulcus may be related to the lateralization of the cortical surface area.
In the central sulcus, as shown in Figure 4, sulcal pits in the left hemisphere were more superior in position, compared with those in the right hemisphere. This observation is consistent with the asymmetry of the hand knob localization reported in (Sun et al., 2012). Moreover, the frequency of the concentration region 6 in the left central sulcus is consistently higher than that in the right central sulcus from birth to 2 years of age. This asymmetry might be related to the fact that the left central sulcus tends to have double knobs while the right sulcus tends to have a single knob (Sun et al., 2012); it could also be related to the right-deeper-than-left sulcal depth asymmetry in the superior part of the central sulcus in infants (Li et al., 2014b).
Gender Differences of Sulcal Pits in Infants
The mean depth of sulcal pits in males is consistently larger than that of females from birth to 2 years of age, which is largely induced by the gender difference of the brain volume. According to the allometry, larger brains exhibit more extensive cortical folding, with regionally heterogeneous correlation patterns (Germanaud et al., 2012; Li et al., 2014c; Toro et al., 2008). Therefore, there might exist gender difference of the mean depth of sulcal pits in some specific regions, which will be investigated in our further work. In the superior part of the central sulcus and the inferior part of the postcentral sulcus, the frequency of concentration region of sulcal pits in males is consistently higher than that of females at 0, 1 and 2 years of age. These results suggest that gender differences on sulcal pits have already existed at birth and are kept during postnatal cortex development. Moreover, the hemispheric asymmetry of the mean depth of sulcal pits increases with the age in males, but with no such significant hemispheric asymmetry found in females. This is consistent with the previous study of the depth of the central sulcus (Cykowski et al., 2008), which reported that the age correlation of depth asymmetries in the central sulcus is only significant in males.
Technical Issues
Cortical surface registration was performed by Spherical Demons, which used the average convexity for rough alignment and then the mean curvature for final fine alignment. The average convexity recorded the accumulated movement for each vertex during surface inflation, reflecting the large-scale geometry of the cortical folding. Therefore, cortical surface registration was not forced to explicitly align sulcal pits. Due to the highly variable cortical folding across individuals, cortical surface registration typically aims to align those consistent major cortical foldings, with the smoothness constraint in the deformation field. Although we could force the alignments of minor and variable cortical folding by relaxing the smoothness constraint, thus leading to more clustered sulcal pits in those regions, the cortical correspondences in those variable folding regions would be actually less reliable and meaningful. The cingulate sulcus is very long, containing many variable sulcal pits, and also has many minor and variable sulci inside or around it. Thus, the surface registration was not forced to perfectly align those variable sulcal pits, leading to possibly inconsistent results in cingulate sulcus.
Limitations
Although we have revealed many important aspects on the sulcal pits in infants, the underlying biological mechanisms and changes are still largely unclear. Since the cortical connectivity by axon fibers in white matter is thought to be the major driving force of forming the convoluted cortical folding (Nie et al., 2012a; Van Essen, 1997), it would provide more insights into the infant cortex development by jointly studying the development of cortical sulcal pits and white matter fibers (derived from diffusion weighted MR images). Another limitation is that, although we have observed some relationships between sulcal pits and functional areas, not all the phenomenon of the sulcal pits, such as hemispherical asymmetries and gender differences, can be biologically well explained. Further studies using the functional MR images of infants are needed to better understand the biological meanings behind.
5. Conclusion
For the first time, we systematically studied the spatial distribution, longitudinal development, hemispheric asymmetries, and gender differences of major cortical sulcal pits in 73 healthy infants at birth, 1 and 2 years of age. We have revealed several important aspects on sulcal pits in infant brains. First, sulcal pits in major sulci are spatially consistent across individuals at term birth. Second, the spatially consistent distributions of sulcal pits are temporally relatively stable during the dynamic cortex development in the first 2 years of life. Third, the depth of sulcal pits in the association cortex grows more rapidly than that in the sensorimotor cortex in the first 2 years of life. Fourth, hemispheric asymmetries of the spatial distribution of sulcal pits exist in several cortical regions, such as the central, postcentral, and superior temporal sulci, likely related to the lateralization of brain functions of these areas. Fifth, consistently deeper sulcal pits in males than in females from birth to 2 years of age is largely induced by their brain volume differences. These findings greatly increase our limited understandings on the sulcal pits development in infants. In our future work, we will also investigate the sulcal pits differences between healthy infants and infants at high-risk for neurodevelopmental disorders, to provide important insights into the neurodevelopment disorders associated with abnormal cortical foldings. Meanwhile, since the sulcal pits in major sulci are spatially consistent and temporally stable, some of them could be potentially used as reliable anatomical landmarks for guiding both longitudinal and cross-sectional brain MR image registration.
Supplementary Material
Acknowledgments
Funding
National Institutes of Health (EB006733, EB008374, EB009634, MH088520, NS055754, HD053000, AG041721 and MH070890).
Footnotes
Publisher's Disclaimer: This is a PDF file of an unedited manuscript that has been accepted for publication. As a service to our customers we are providing this early version of the manuscript. The manuscript will undergo copyediting, typesetting, and review of the resulting proof before it is published in its final citable form. Please note that during the production process errors may be discovered which could affect the content, and all legal disclaimers that apply to the journal pertain.
References
- Balsamo LM, Xu B, Grandin CB, Petrella JR, Braniecki SH, Elliott TK, Gaillard WD. A functional magnetic resonance imaging study of left hemisphere language dominance in children. Arch Neurol. 2002;59:1168–1174. doi: 10.1001/archneur.59.7.1168. [DOI] [PubMed] [Google Scholar]
- Binder JR, Frost JA, Hammeke TA, Cox RW, Rao SM, Prieto T. Human brain language areas identified by functional magnetic resonance imaging. J Neurosci. 1997;17:353–362. doi: 10.1523/JNEUROSCI.17-01-00353.1997. [DOI] [PMC free article] [PubMed] [Google Scholar]
- Bleich-Cohen M, Hendler T, Kotler M, Strous RD. Reduced language lateralization in first-episode schizophrenia: an fMRI index of functional asymmetry. Psychiatry Res. 2009;171:82–93. doi: 10.1016/j.pscychresns.2008.03.002. [DOI] [PubMed] [Google Scholar]
- Cachia A, Mangin JF, Riviere D, Kherif F, Boddaert N, Andrade A, Papadopoulos-Orfanos D, Poline JB, Bloch I, Zilbovicius M, Sonigo P, Brunelle F, Regis J. A primal sketch of the cortex mean curvature: a morphogenesis based approach to study the variability of the folding patterns. IEEE Trans Med Imaging. 2003;22:754–765. doi: 10.1109/TMI.2003.814781. [DOI] [PubMed] [Google Scholar]
- Chi JG, Dooling EC, Gilles FH. Gyral development of the human brain. Ann Neurol. 1977;1:86–93. doi: 10.1002/ana.410010109. [DOI] [PubMed] [Google Scholar]
- Cykowski MD, Colulon O, Kochunov PV, Amunts K, Lancaster JI, Laird AR, Glahn DC, Fox PT. The central sulcus: an observer-independent characterization of sulcal landmarks and depth asymmetry. Cereb Cortex. 2008;18:1999–2009. doi: 10.1093/cercor/bhm224. [DOI] [PMC free article] [PubMed] [Google Scholar]
- Dubois J, Benders M, Cachia A, Lazeyras F, Ha-Vinh Leuchter R, Sizonenko SV, Borradori-Tolsa C, Mangin JF, Huppi PS. Mapping the early cortical folding process in the preterm newborn brain. Cereb Cortex. 2008;18:1444–1454. doi: 10.1093/cercor/bhm180. [DOI] [PubMed] [Google Scholar]
- Emmorey K, Allen JS, Bruss J, Schenker N, Damasio H. A morphometric analysis of auditory brain regions in congenitally deaf adults. Proc Natl Acad Sci U S A. 2003;100:10049–10054. doi: 10.1073/pnas.1730169100. [DOI] [PMC free article] [PubMed] [Google Scholar]
- Evans AC. The NIH MRI study of normal brain development. Neuroimage. 2006;30:184–202. doi: 10.1016/j.neuroimage.2005.09.068. [DOI] [PubMed] [Google Scholar]
- Fischl B, Sereno MI, Dale AM. Cortical surface-based analysis. II: Inflation, flattening, and a surface-based coordinate system. Neuroimage. 1999;9:195–207. doi: 10.1006/nimg.1998.0396. [DOI] [PubMed] [Google Scholar]
- Germanaud D, Lefevre J, Toro R, Fischer C, Dubois J, Hertz-Pannier L, Mangin JF. Larger is twistier: Spectral analysis of gyrification (SPANGY) applied to adult brain size polymorphism. Neuroimage. 2012;63:1257–1272. doi: 10.1016/j.neuroimage.2012.07.053. [DOI] [PubMed] [Google Scholar]
- Gilmore JH, Shi F, Woolson SL, Knickmeyer RC, Short SJ, Lin W, Zhu H, Hamer RM, Styner M, Shen D. Longitudinal development of cortical and subcortical gray matter from birth to 2 years. Cereb Cortex. 2012;22:2478–2485. doi: 10.1093/cercor/bhr327. [DOI] [PMC free article] [PubMed] [Google Scholar]
- Glasel H, Leroy F, Dubois J, Hertz-Pannier L, Mangin JF, Dehaene-Lambertz G. A robust cerebral asymmetry in the infant brain: the rightward superior temporal sulcus. Neuroimage. 2011;58:716–723. doi: 10.1016/j.neuroimage.2011.06.016. [DOI] [PubMed] [Google Scholar]
- Goldman-Rakic PS. Topography of cognition: parallel distributed networks in primate association cortex. Annu Rev Neurosci. 1988;11:137–156. doi: 10.1146/annurev.ne.11.030188.001033. [DOI] [PubMed] [Google Scholar]
- Good CD, Johnsrude I, Ashburner J, Henson RN, Friston KJ, Frackowiak RS. Cerebral asymmetry and the effects of sex and handedness on brain structure: a voxel-based morphometric analysis of 465 normal adult human brains. Neuroimage. 2001;14:685–700. doi: 10.1006/nimg.2001.0857. [DOI] [PubMed] [Google Scholar]
- Habas PA, Scott JA, Roosta A, Rajagopalan V, Kim K, Rousseau F, Barkovich AJ, Glenn OA, Studholme C. Early folding patterns and asymmetries of the normal human brain detected from in utero MRI. Cereb Cortex. 2012;22:13–25. doi: 10.1093/cercor/bhr053. [DOI] [PMC free article] [PubMed] [Google Scholar]
- Hill J, Dierker D, Neil J, Inder T, Knutsen A, Harwell J, Coalson T, Van Essen D. A surface-based analysis of hemispheric asymmetries and folding of cerebral cortex in term-born human infants. J Neurosci. 2010a;30:2268–2276. doi: 10.1523/JNEUROSCI.4682-09.2010. [DOI] [PMC free article] [PubMed] [Google Scholar]
- Hill J, Inder T, Neil J, Dierker D, Harwell J, Van Essen D. Similar patterns of cortical expansion during human development and evolution. Proc Natl Acad Sci U S A. 2010b;107:13135–13140. doi: 10.1073/pnas.1001229107. [DOI] [PMC free article] [PubMed] [Google Scholar]
- Im K, Jo HJ, Mangin JF, Evans AC, Kim SI, Lee JM. Spatial distribution of deep sulcal landmarks and hemispherical asymmetry on the cortical surface. Cereb Cortex. 2010;20:602–611. doi: 10.1093/cercor/bhp127. [DOI] [PubMed] [Google Scholar]
- Im K, Lee JM, Jeon S, Kim JH, Seo SW, Na DL, Grant PE. Reliable identification of deep sulcal pits: the effects of scan session, scanner, and surface extraction tool. PLoS One. 2013;8:e53678. doi: 10.1371/journal.pone.0053678. [DOI] [PMC free article] [PubMed] [Google Scholar]
- Jung P, Baumgartner U, Bauermann T, Magerl W, Gawehn J, Stoeter P, Treede RD. Asymmetry in the human primary somatosensory cortex and handedness. Neuroimage. 2003;19:913–923. doi: 10.1016/s1053-8119(03)00164-2. [DOI] [PubMed] [Google Scholar]
- Karbe H, Wurker M, Herholz K, Ghaemi M, Pietrzyk U, Kessler J, Heiss WD. Planum temporale and Brodmann’s area 22. Magnetic resonance imaging and high-resolution positron emission tomography demonstrate functional left-right asymmetry. Arch Neurol. 1995;52:869–874. doi: 10.1001/archneur.1995.00540330047013. [DOI] [PubMed] [Google Scholar]
- Knickmeyer RC, Gouttard S, Kang C, Evans D, Wilber K, Smith JK, Hamer RM, Lin W, Gerig G, Gilmore JH. A structural MRI study of human brain development from birth to 2 years. J Neurosci. 2008;28:12176–12182. doi: 10.1523/JNEUROSCI.3479-08.2008. [DOI] [PMC free article] [PubMed] [Google Scholar]
- Le Goualher G, Procyk E, Collins DL, Venugopal R, Barillot C, Evans AC. Automated extraction and variability analysis of sulcal neuroanatomy. IEEE Trans Med Imaging. 1999;18:206–217. doi: 10.1109/42.764891. [DOI] [PubMed] [Google Scholar]
- Lefevre J, Leroy F, Khan S, Dubois J, Huppi PS, Baillet S, Mangin JF. Identification of growth seeds in the neonate brain through surfacic Helmholtz decomposition. Inf Process Med Imaging. 2009;21:252–263. doi: 10.1007/978-3-642-02498-6_21. [DOI] [PubMed] [Google Scholar]
- Li G, Guo L, Nie J, Liu T. Automatic cortical sulcal parcellation based on surface principal direction flow field tracking. Neuroimage. 2009;46:923–937. doi: 10.1016/j.neuroimage.2009.03.039. [DOI] [PMC free article] [PubMed] [Google Scholar]
- Li G, Guo L, Nie J, Liu T. An automated pipeline for cortical sulcal fundi extraction. Med Image Anal. 2010;14:343–359. doi: 10.1016/j.media.2010.01.005. [DOI] [PMC free article] [PubMed] [Google Scholar]
- Li G, Nie J, Wang L, Shi F, Gilmore JH, Lin W, Shen D. Measuring the dynamic longitudinal cortex development in infants by reconstruction of temporally consistent cortical surfaces. Neuroimage. 2014a;90:266–279. doi: 10.1016/j.neuroimage.2013.12.038. [DOI] [PMC free article] [PubMed] [Google Scholar]
- Li G, Nie J, Wang L, Shi F, Lin W, Gilmore JH, Shen D. Mapping region-specific longitudinal cortical surface expansion from birth to 2 years of age. Cereb Cortex. 2013;23:2724–2733. doi: 10.1093/cercor/bhs265. [DOI] [PMC free article] [PubMed] [Google Scholar]
- Li G, Nie J, Wang L, Shi F, Lyall AE, Lin W, Gilmore JH, Shen D. Mapping longitudinal hemispheric structural asymmetries of the human cerebral cortex from birth to 2 years of age. Cereb Cortex. 2014b;24:1289–1300. doi: 10.1093/cercor/bhs413. [DOI] [PMC free article] [PubMed] [Google Scholar]
- Li G, Nie J, Wu G, Wang Y, Shen D. Consistent reconstruction of cortical surfaces from longitudinal brain MR images. Neuroimage. 2012;59:3805–3820. doi: 10.1016/j.neuroimage.2011.11.012. [DOI] [PMC free article] [PubMed] [Google Scholar]
- Li G, Wang L, Shi F, Lyall AE, Lin W, Gilmore JH, Shen D. Mapping longitudinal development of local cortical gyrification in infants from birth to 2 years of age. J Neurosci. 2014c;34:4228–4238. doi: 10.1523/JNEUROSCI.3976-13.2014. [DOI] [PMC free article] [PubMed] [Google Scholar]
- Lohmann G, von Cramon DY, Colchester AC. Deep sulcal landmarks provide an organizing framework for human cortical folding. Cereb Cortex. 2008;18:1415–1420. doi: 10.1093/cercor/bhm174. [DOI] [PubMed] [Google Scholar]
- Lohmann G, von Cramon DY, Steinmetz H. Sulcal variability of twins. Cereb Cortex. 1999;9:754–763. doi: 10.1093/cercor/9.7.754. [DOI] [PubMed] [Google Scholar]
- Lyall AE, Shi F, Geng X, Woolson S, Li G, Wang L, Hamer RM, Shen D, Gilmore JH. Dynamic Development of Regional Cortical Thickness and Surface Area in Early Childhood. Cereb Cortex. 2014 doi: 10.1093/cercor/bhu027. [DOI] [PMC free article] [PubMed] [Google Scholar]
- McKay DR, Kochunov P, Cykowski MD, Kent JW, Jr, Laird AR, Lancaster JL, Blangero J, Glahn DC, Fox PT. Sulcal depth-position profile is a genetically mediated neuroscientific trait: description and characterization in the central sulcus. J Neurosci. 2013;33:15618–15625. doi: 10.1523/JNEUROSCI.1616-13.2013. [DOI] [PMC free article] [PubMed] [Google Scholar]
- Mueller S, Wang D, Fox MD, Yeo BT, Sepulcre J, Sabuncu MR, Shafee R, Lu J, Liu H. Individual variability in functional connectivity architecture of the human brain. Neuron. 2013;77:586–595. doi: 10.1016/j.neuron.2012.12.028. [DOI] [PMC free article] [PubMed] [Google Scholar]
- Nie J, Guo L, Li K, Wang Y, Chen G, Li L, Chen H, Deng F, Jiang X, Zhang T, Huang L, Faraco C, Zhang D, Guo C, Yap PT, Hu X, Li G, Lv J, Yuan Y, Zhu D, Han J, Sabatinelli D, Zhao Q, Miller LS, Xu B, Shen P, Platt S, Shen D, Liu T. Axonal fiber terminations concentrate on gyri. Cereb Cortex. 2012a;22:2831–2839. doi: 10.1093/cercor/bhr361. [DOI] [PMC free article] [PubMed] [Google Scholar]
- Nie J, Li G, Shen D. Development of cortical anatomical properties from early childhood to early adulthood. Neuroimage. 2013a;76:216–224. doi: 10.1016/j.neuroimage.2013.03.021. [DOI] [PMC free article] [PubMed] [Google Scholar]
- Nie J, Li G, Wang L, Gilmore JH, Lin W, Shen D. A computational growth model for measuring dynamic cortical development in the first year of life. Cereb Cortex. 2012b;22:2272–2284. doi: 10.1093/cercor/bhr293. [DOI] [PMC free article] [PubMed] [Google Scholar]
- Nie J, Li G, Wang L, Shi F, Lin W, Gilmore JH, Shen D. Longitudinal development of cortical thickness, folding, and fiber density networks in the first 2 years of life. Hum Brain Mapp. 2013b doi: 10.1002/hbm.22432. [DOI] [PMC free article] [PubMed] [Google Scholar]
- Ono M, Kubick S, Abernathey C. Atlas of the Cerebral Sulci. Thieme Medical Publishers Ltd; 1990. [Google Scholar]
- Operto G, Auzias G, Le Troter A, Perrot M, Riviere D, Dubois J, Huppi P, Coulon O, Mang J. Structural group analysis of cortical curvature and depth patterns in the developing brain. Biomedical Imaging (ISBI); 2012; 9th IEEE International Symposium on; 2012. pp. 422–425. [Google Scholar]
- Penhune VB, Zatorre RJ, MacDonald JD, Evans AC. Interhemispheric anatomical differences in human primary auditory cortex: probabilistic mapping and volume measurement from magnetic resonance scans. Cereb Cortex. 1996;6:661–672. doi: 10.1093/cercor/6.5.661. [DOI] [PubMed] [Google Scholar]
- Perrot M, Riviere D, Mangin JF. Cortical sulci recognition and spatial normalization. Med Image Anal. 2011;15:529–550. doi: 10.1016/j.media.2011.02.008. [DOI] [PubMed] [Google Scholar]
- Piao X, Hill RS, Bodell A, Chang BS, Basel-Vanagaite L, Straussberg R, Dobyns WB, Qasrawi B, Winter RM, Innes AM, Voit T, Ross ME, Michaud JL, Descarie JC, Barkovich AJ, Walsh CA. G protein-coupled receptor-dependent development of human frontal cortex. Science. 2004;303:2033–2036. doi: 10.1126/science.1092780. [DOI] [PubMed] [Google Scholar]
- Rakic P. Specification of Cerebral Cortical Areas. Science. 1988;241:170–176. doi: 10.1126/science.3291116. [DOI] [PubMed] [Google Scholar]
- Rakic P. Neuroscience. Genetic control of cortical convolutions. Science. 2004;303:1983–1984. doi: 10.1126/science.1096414. [DOI] [PubMed] [Google Scholar]
- Regis J, Mangin JF, Ochiai T, Frouin V, Riviere D, Cachia A, Tamura M, Samson Y. “Sulcal root” generic model: a hypothesis to overcome the variability of the human cortex folding patterns. Neurol Med Chir (Tokyo) 2005;45:1–17. doi: 10.2176/nmc.45.1. [DOI] [PubMed] [Google Scholar]
- Shi F, Wang L, Dai Y, Gilmore JH, Lin W, Shen D. LABEL: Pediatric brain extraction using learning-based meta-algorithm. Neuroimage. 2012;62:1975–1986. doi: 10.1016/j.neuroimage.2012.05.042. [DOI] [PMC free article] [PubMed] [Google Scholar]
- Shi F, Yap PT, Wu G, Jia H, Gilmore JH, Lin W, Shen D. Infant brain atlases from neonates to 1- and 2-year-olds. PLoS One. 2011;6:e18746. doi: 10.1371/journal.pone.0018746. [DOI] [PMC free article] [PubMed] [Google Scholar]
- Sled JG, Zijdenbos AP, Evans AC. A nonparametric method for automatic correction of intensity nonuniformity in MRI data. IEEE Trans Med Imaging. 1998;17:87–97. doi: 10.1109/42.668698. [DOI] [PubMed] [Google Scholar]
- Smart IH, McSherry GM. Gyrus formation in the cerebral cortex in the ferret. I. Description of the external changes. J Anat. 1986;146:141–152. [PMC free article] [PubMed] [Google Scholar]
- Sowell ER, Thompson PM, Peterson BS, Mattson SN, Welcome SE, Henkenius AL, Riley EP, Jernigan TL, Toga AW. Mapping cortical gray matter asymmetry patterns in adolescents with heavy prenatal alcohol exposure. Neuroimage. 2002;17:1807–1819. doi: 10.1006/nimg.2002.1328. [DOI] [PubMed] [Google Scholar]
- Sun ZY, Kloppel S, Riviere D, Perrot M, Frackowiak R, Siebner H, Mangin JF. The effect of handedness on the shape of the central sulcus. Neuroimage. 2012;60:332–339. doi: 10.1016/j.neuroimage.2011.12.050. [DOI] [PubMed] [Google Scholar]
- Toro R, Perron M, Pike B, Richer L, Veillette S, Pausova Z, Paus T. Brain size and folding of the human cerebral cortex. Cereb Cortex. 2008;18:2352–2357. doi: 10.1093/cercor/bhm261. [DOI] [PubMed] [Google Scholar]
- Tzourio N, Crivello F, Mellet E, Nkanga-Ngila B, Mazoyer B. Functional anatomy of dominance for speech comprehension in left handers vs right handers. Neuroimage. 1998;8:1–16. doi: 10.1006/nimg.1998.0343. [DOI] [PubMed] [Google Scholar]
- Van Essen DC. A tension-based theory of morphogenesis and compact wiring in the central nervous system. Nature. 1997;385:313–318. doi: 10.1038/385313a0. [DOI] [PubMed] [Google Scholar]
- Van Essen DC. A Population-Average, Landmark- and Surface-based (PALS) atlas of human cerebral cortex. Neuroimage. 2005;28:635–662. doi: 10.1016/j.neuroimage.2005.06.058. [DOI] [PubMed] [Google Scholar]
- Van Essen DC, Glasser MF, Dierker DL, Harwell J, Coalson T. Parcellations and hemispheric asymmetries of human cerebral cortex analyzed on surface-based atlases. Cereb Cortex. 2012;22:2241–2262. doi: 10.1093/cercor/bhr291. [DOI] [PMC free article] [PubMed] [Google Scholar]
- Wang L, Shi F, Li G, Gao Y, Lin W, Gilmore JH, Shen D. Segmentation of neonatal brain MR images using patch-driven level sets. Neuroimage. 2013a;84C:141–158. doi: 10.1016/j.neuroimage.2013.08.008. [DOI] [PMC free article] [PubMed] [Google Scholar]
- Wang L, Shi F, Yap PT, Lin W, Gilmore JH, Shen D. Longitudinally guided level sets for consistent tissue segmentation of neonates. Hum Brain Mapp. 2013b;34:956–972. doi: 10.1002/hbm.21486. [DOI] [PMC free article] [PubMed] [Google Scholar]
- Welker W. Why does cerebral cortex fissure and fold? A review of determinants of gyri and sulci. Cereb Cortex. 1990;8:3–136. [Google Scholar]
- Yeo BT, Sabuncu MR, Vercauteren T, Ayache N, Fischl B, Golland P. Spherical demons: fast diffeomorphic landmark-free surface registration. IEEE Trans Med Imaging. 2010;29:650–668. doi: 10.1109/TMI.2009.2030797. [DOI] [PMC free article] [PubMed] [Google Scholar]
Associated Data
This section collects any data citations, data availability statements, or supplementary materials included in this article.