

Abstract
Induced Foxp3+ T-regulatory cells (iTreg) are essential to gastrointestinal immune homeostasis and loss of the ability to develop iTregs may lead to autoimmune colitis. We previously showed a role for Sirtuin-1 (Sirt1) in control of Treg function and hypothesized that targeting of Sirt1 might enhance iTreg development and thereby represent a potential therapy for inflammatory bowel disease (IBD). We adoptively transferred CD4+CD25−Foxp3− T effector (TE) cells from wild-type (C57BL/6) or fl-Sirt1/CD4cre mice into B6/Rag1−/− mice and monitored the mice until they lost 10-15% of their weight. Adoptive transfer of TE cells lacking Sirt1 to B6/Rag1−/− mice resulted in a 2.8-fold increase in iTreg formation compared to mice receiving wild-type TE cells and correlated with attenuated colitis and reduced weight loss (1.04±1.4% vs. 13.97±2.2%, respectively, p<0.001). In a second model of IBD, we used pharmacologic Sirt1 targeting of mice receiving multiple cycles of dextran sodium sulfate (DSS) in their drinking water, alternated with fresh water. Likewise, wild-type mice receiving cyclic DSS and a Sirt1 inhibitor, EX-527, had reduced weight loss (5.8±5.9% vs. 13.2±6.9%, p=0.03) and increased iTreg formation compared to controls. Sirt1 appears a promising target for pharmacologic therapy of IBD as a result of promoting iTreg development.
Keywords: Inflammatory bowel disease, Th1-mediated colitis, DSS colitis, iTreg
Introduction
Intestinal immune homeostasis must encompass effective defense against pathogens but tolerance to antigens from food and commensals. Therefore, the gastrointestinal tract maintains a highly active and specialized immune system capable of activation or attenuation in response to specific antigens.1, 2 T-regulatory (Treg) cells are central to intestinal immune tolerance and are considered a potential therapeutic target in inflammatory bowel disease (IBD).2, 3 Tregs developing in the thymus are known as natural Treg (nTreg), whereas those developing from conventional T cells are termed induced Treg (iTreg) cells.4 Both nTreg and iTreg are characterized by expression of the transcription factor Forkhead box P3 (Foxp3) which is essential to their suppressive function.5, 6 Humans with mutations in the Foxp3 gene suffer from autoimmune diseases such as colitis, underlining the importance of Treg for intestinal homeostasis.7 However, many patients suffering from IBD have increased rather than decreased numbers of Foxp3+ Treg,8, 9 leading to the suggestion that it is not the overall number of Foxp3+ Treg, but the formation of iTregs that is essential to intestinal immune homeostasis, similar to their role in oral tolerance.2, 10 Josefowicz et al. found that mice lacking the Foxp3 enhancer CNS1, which are unable to develop iTregs but have normal nTreg development and function, exhibit pronounced inflammation at mucosal sites such as the gastrointestinal and respiratory tracts.11 Furthermore, mice that lack the TGFβ-Smad response element within the CNS1 region have normal Treg development except within the gastrointestinal tract.12 These data support a model in which iTreg formation is central to intestinal homeostasis. Therefore, therapies that promote iTreg formation might be of therapeutic benefit in IBD.
We have previously shown that targeting Sirtuin-1 (Sirt1) by genetic deletion or pharmacologic inhibition led to increased Treg suppressive function in vitro and in vivo and prolonged allograft survival.13, 14 Sirt1 is a NAD-dependent class III histone/protein deacetylase highly conserved across eukaryotic species which regulates important processes in cell physiology by catalyzing ε-acetyl-lysine deacetylation of histones (facilitating chromatin condensation) and multiple non-histone proteins.15 Among those non-histone proteins is Foxp3. Blocking Sirt1 increases Foxp3 acetylation, thereby increasing Treg function.13, 16-18 However, the effects of Sirt1 targeting on nTreg vs. iTreg remain uncertain. Since adoptive transfer models of colitis with immunodeficient (B6/Rag1−/−) mice provide a good opportunity to discern the effects of thymic vs. induced Tregs in vivo, we studied whether Sirt1 targeting could be specifically beneficial for iTregs and therefore of therapeutic interest for inflammatory diseases of the gastrointestinal tract.
Results
Loss of Sirt1 promotes Foxp3+ iTreg formation and attenuates autoimmune colitis
We injected i.v. 5 × 10⁵ highly purified TE cells, isolated from WT or fl-Sirt1/CD4cre mice, into twelve-week-old B6/Rag1−/− mice and assessed the development of colitis. B6/Rag1−/− mice adoptively transferred with TE cells lacking Sirt1 had significantly less weight loss than mice receiving WT Treg cells (Fig. 1a and 1b). We observed this pattern persistently over four independent experiments with a total of 34 mice. Similarly, adoptive transfer of TE cells into 6-week-old B6/Rag1−/− mice led to disruption of somatic growth if the TE cells originated from WT mice, but not from fl-Sirt1/CD4cre mice (n=10, Suppl. fig. S1). B6/Rag1−/− mice receiving fl-Sirt1CD4cre TE developed less splenomegaly than WT TE recipients (Fig. 1c, d). Consistent with weight loss and splenomegaly, WT TE recipients developed much more severe colitis upon histology in comparison with fl-Sirt1/CD4cre TE recipients (Fig. 1e–g).
Figure 1.
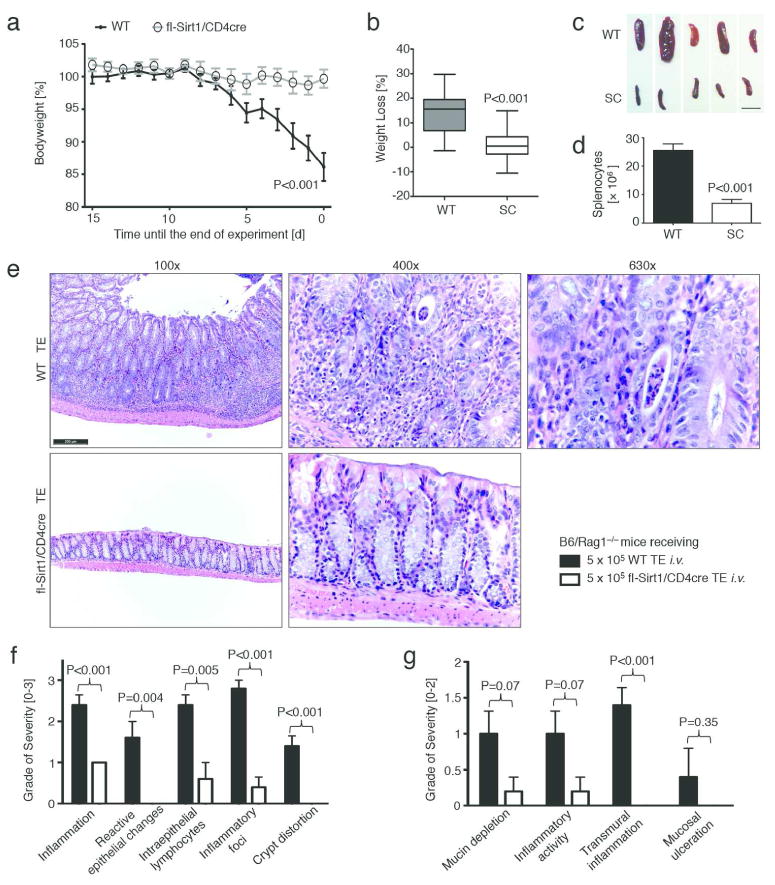
T effector cells lacking Sirt1 cause less autoimmune colitis. Twelve weeks old B6/Rag1−/− mice were adoptively transferred with 5 × 10⁵ CD4+CD25− (<1.1% Foxp3+) T effector cells (TE) i.v. of either C57Bl/6 wild type (WT) or fl-Sirt1/CD4cre (SC) origin and followed until autoimmune colitis developed. Data pooled from four independent experimental setups (n=34 mice). (a, b) B6/Rag1−/− mice injected with SC TE developed less disease and weight loss. (a) Weight curves, normalized to the end point of each of the three independent experiments. (b) Percent weight loss as boxplots (whiskers: 5th-95th percentile). (c) Smaller spleen size in fl-Sirt1/CD4cre TE injected B6/Rag1−/− mice. Scale bar indicates 1 cm. (d) B6/Rag1−/− mice receiving WT TE showed a higher spleenocyte count than fl-Sirt1/CD4cre TE recipients. (e) Colonic specimens from B6/Rag1−/− mice receiving WT TE show significant colitis including marked crypt architectural distortion (100x original magnification) with neutrophilic infiltration of the lamina propria, crypt epithelium (“cryptitis”) and glandular lumina (“crypt abscess”, see 630x original magnification). In contrast, adoptive transfer of TE lacking Sirt1 produced much less signs of colitis. H&E staining; scale bar indicates 200 μm. (f, g) Pooled data from blinded histologic analysis demonstrate less colitis pathology in mice adoptively transferred with fl-Sirt1/CD4cre TE (n=10).
We used immunohistochemistry of CD3 expression to assess T cell infiltration within colon sections, We found that B6/Rag1−/− mice adoptively transferred with WT TE had significantly more infiltrating T cells in the colonic mucosa than fl-Sirt1/CD4cre recipients (Fig. 2a, b). Furthermore, we noted decreased CD4, IL–6 and IL–17 mRNA expression in colon samples from B6/Rag1−/− mice whose adoptively transferred TE were lacking Sirt1 (Fig. 2c-e). Hence, absence of Sirt1 resulted in less T cell infiltration into colonic tissues.
Figure 2.
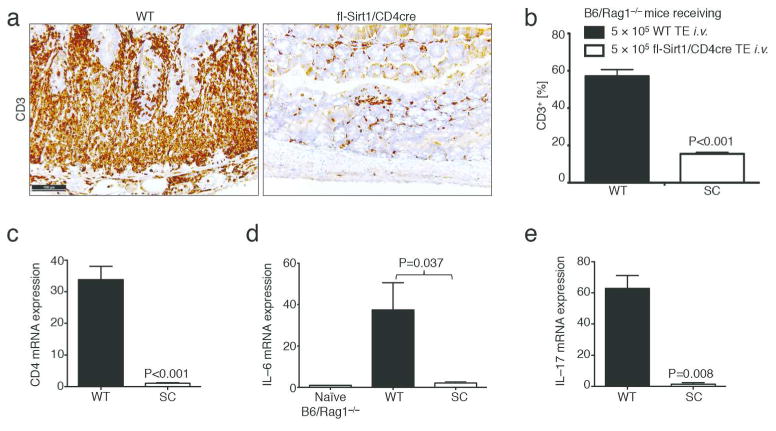
Lack of Sirt1 in T cells leads to decreased T cell infiltration into the colonic mucosa. (a, b) Immunohistochemistry of CD3 showing decreased T cell infiltration in Rag1−/− mice adoptively transferred with fl-Sirt1/CD4cre (SC) versus WT T effector cells, respectively (experimental conditions as in Figure 1). (b) Pooled histologic data from automated slide quantification (n=10). (c–e) mRNA expression profiles from colonic tissue indicates increased CD4, IL–6 and IL–17 mRNA expression in B6/Rag1−/− recipients of WT compared to SC TE (n=8).
Given previous data on the role of Sirt1 in Treg stability13, 16, we assessed the numbers of Foxp3+ Treg cells within mesenteric lymph nodes and spleens. We found that B6/Rag1−/− recipients of fl-Sirt1/CD4cre TE had more Foxp3+ Tregs as recipients of WT TE cells, for both spleens and mesenteric lymph nodes (Fig. 3a and b, left panels). The presence of these Treg cells raised several questions: Are Treg observed at the end of the study de-novo induced from naïve T cells? Furthermore, how can the differences in inflammatory responses be explained? Is the increased number of Tregs, their lack of Sirt1, or, differences in TE function (due to the lack of Sirt1) responsible for the alleviation of colitis?
Figure 3.
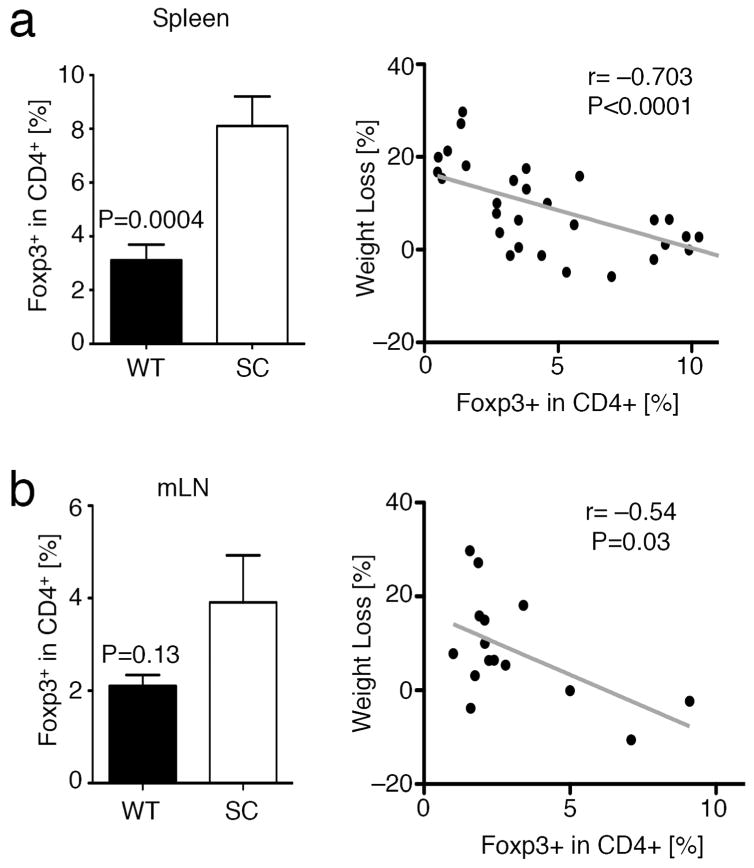
T effector cells lacking Sirt1 are more susceptible to Foxp3+Treg induction in vivo. Pooled analysis of flow cytometry data of experiments from Figure 1. (a) Splenocytes from B6/Rag1−/− mice adoptively transferred with fl-Sirt1/CD4cre (SC) TE exhibited an increased fraction of induced Treg (left panel). Weight loss negatively correlated with iTreg conversion (right panel). (b) Similarly, mesenteric lymph nodes (mLN) from B6/Rag1−/− mice receiving SC TE tended to have increased Foxp3+ iTreg (left panel), which is negatively correlated with weight loss (right panel).
To ensure that the Foxp3+ Treg observed at the end of the experiment were de-novo iTreg and not already committed Treg originating from the injection of splenocytes, we depleted CD25+ cells from the injected cells with a modified cell separation protocol and achieved equal 99% Foxp3− purity in both WT and fl-Sirt1/CD4cre TE (Suppl. fig. S2). Furthermore, to exclude possible overgrowth of nTreg in the fl-Sirt1/CD4cre TE treated mice, we assessed cell proliferation through Ki-67 expression in Foxp3+ Treg at the end of the experiment, which was equal between WT and fl-Sirt1/CD4cre TE injected mice (Suppl. fig. S3). Therefore, it seems plausible that the observed Foxp3+Treg at the end of the experiment are iTreg, and that fl-Sirt1/CD4cre TE may have a tendency to convert more easily to become iTreg cells.
While increased iTreg formation may explain the better disease outcome we observed in Rag1–/– mice receiving fl-Sirt1/CD4cre TE, it is also possible to speculate that fl–Sirt1/CD4cre TE cells are inherently less able to cause disease. The degree of splenomegaly, inflammation, and numbers of TE cells on histology suggested that adoptively transferred TE cells lacking Sirt1 may be less inflammatory by their phenotype or were better regulated by Tregs. With regard to TE cell function, we have extensively studied the phenotype of fl-Sirt1/CD4cre TE in vivo and in vitro in our previous work, and did not observe any differences in their proliferation or cellular activation.13 To assess if fl-Sirt1/CD4cre TE cells are more susceptible to Treg suppression than WT TE cells, we conducted Treg suppression assays, comparing WT and fl-Sirt1/CD4cre TE cell suppression by WT Tregs. We found that WT and fl-Sirt1/CD4cre TE cells can both be suppressed by Tregs and that there was a trend for fl-Sirt1/CD4cre TE to be slightly more resistant to Treg suppression (Fig. 4a). Next, we tested cytokine production by freshly isolated CD4+CD25− TE activated with phorbol 12-myristate 13-acetate (PMA) and ionomycin. We noted that in vitro production of IFN–γ was very similar for both cell populations, though trending higher for fl-Sirt1/CD4cre TE (Fig. 4b). Conversely, IL–2 production was decreased in fl-Sirt1/CD4cre TE in comparison with WT TE cells (Fig. 4c). In a previous Parent–to–F1 experiment, we did not notice any difference in cytokine production in vivo.13 Overall, our data do not indicate that fl-Sirt1/CD4cre TE cells are more susceptible to Treg mediated suppression, though they do have decreased IL–2 production upon stimulation in vitro when compared to WT cells.
Figure 4.
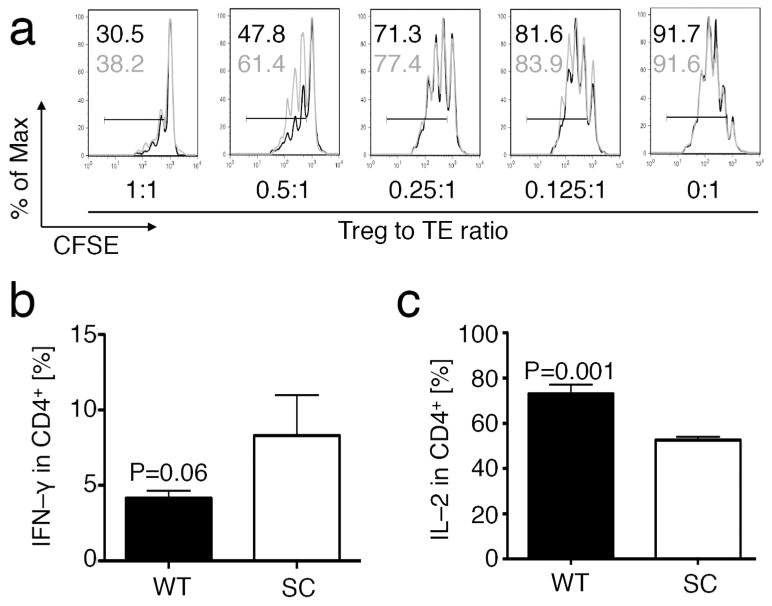
Sirt1 and T effector function. (a) Comparison of CFSE labeled WT (black) or fl-Sirt1/CD4cre (grey) TE (CD4+CD25−) to be suppressed by WT Tregs in vitro, showing near equal susceptibility. TE proliferation indicated by percentage for both WT (black) and fl-Sirt1/CD4cre (grey). Percent of maximum (% of Max) shows normalization of overlaid data and represents number of cells in each bin divided by the number of cells in the bin that contains the largest number of cells. (b, c) WT and fl-Sirt1/CD4cre (SC) TE were stimulated with PMA/ionomycin to elicit cytokine production, showing a trend towards higher IFN–γ (b), and decreased IL–2 production (c). Data are representative of three independent experiments.
Given that the phenotypic differences between fl-Sirt1/CD4cre and WT TE cells were minimal, we focused our attention on increased iTreg formation in fl-Sirt1/CD4cre TE recipients. The number of iTregs, evaluated in each individual mouse correlated inversely with weight loss (Fig. 3a and b, right panel). This, combined with our previous data on relatively similar TE function between fl-Sirt1/CD4cre and WT TE, but differences in iTregs levels in correlation with different colitis severity, led us to hypothesize that the difference in disease outcomes is predominately iTreg mediated.
Tregs are known as bystander suppressors since they can inhibit the activity of virtually any immune cell through cell-cell contacts or remotely by cytokine production.19 We therefore assessed cellular activation and proliferation in non-Treg and host non-T cells, using Ki-67 expression as a readout. Ki-67 is a proliferation marker which is present during all active phases of the cell cycle but is absent in resting cells at the G0 phase.20 Through combination with other flow cytometry parameters, it is possible to judge proliferation of injected TE that remained Foxp3− as well as in host cells. Host cells can be identified by gating on CD4−, taking advantage of the fact that B6/Rag1−/− mice lack their own CD4 cells while injected cells were >99% CD4+ purified (Suppl. fig. S2). We observed that both Foxp3−TE and CD4− host cells expressed less Ki–67 in B6/Rag1−/− recipients that received fl-Sirt1/CD4cre vs. WT TE cells (Fig. 5a and b). The presence of Ki–67 in both injected CD4+Foxp3− (Fig. 5c) and CD4−(Fig. 5d) host cells also correlated with individual weight loss. Together, our data show that in an adoptive transfer model of colitis, TE cells lacking Sirt1 convert more easily to iTreg and that enhanced iTreg conversion correlated with a reduction in weight loss and less cellular proliferation by Foxp3− TE and host non-T cells.
Figure 5.

T effector and host cells are less proliferative in B6/Rag1−/− recipients of fl-Sirt1/CD4cre TE. Pooled analysis of flow cytometry data of experiments from Figure 1. (a, b) Among adoptively transferred (a) TE that remained Foxp3 negative, as well as host (b) CD4− cells, Ki–67 expression was reduced in B6/Rag1−/− mice receiving SC TE. (c, d) Ki–67 in Foxp3−TE (c) and host cells (d) positively correlated with weight loss.
We further assessed the host B6/Rag1−/− immune cells in our colitis model. We found that B6/Rag1−/− mice adoptively transferred with WT TE had more granulocytes and monocytes in their spleens (Fig. 6a) and this was positively correlated with weight loss (Fig. 6b). Given the increased presence of neutrophil infiltrates in the colonic mucosa (Fig. 1e–g), we further refined our analysis to specifically granulocytes and macrophages within the mesenteric lymph nodes. We found increased macrophage (Fig. 6c) and granulocyte (Fig. 6d) populations in WT TE recipients. Thus, we noted evidence of a less pronounced inflammatory response by host B6/Rag1−/− immune cells in mice adoptively transferred with fl-Sirt1/CD4cre TE and enhanced iTreg formation in vivo.
Figure 6.
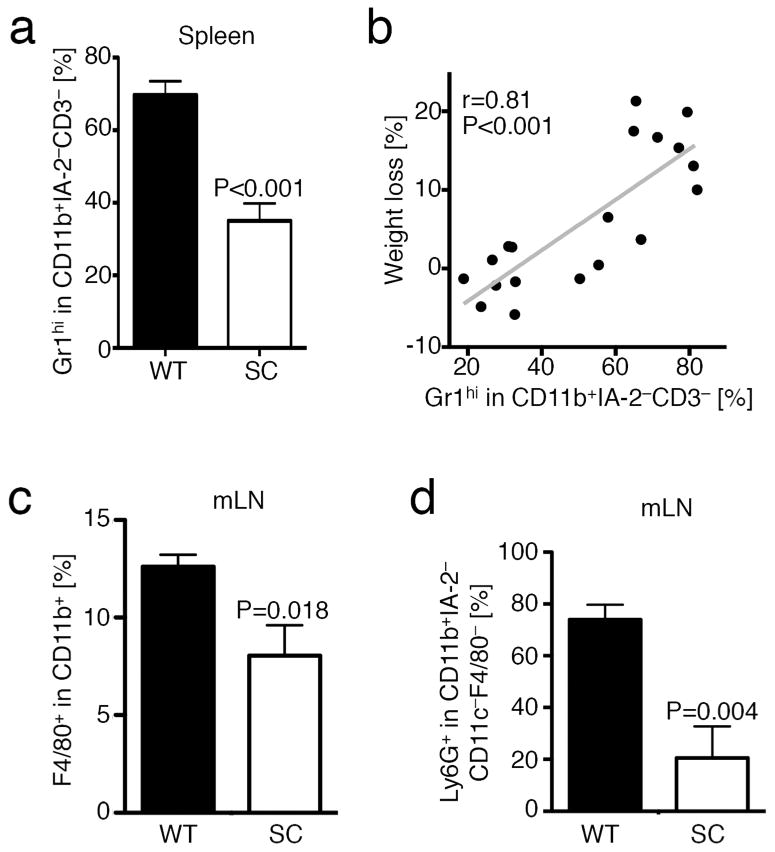
Lack of Sirt1 in T cells limits recruitment of granulocytes and macrophages. Pooled analysis of flow cytometry data of experiments from Figure 1. (a) Flow cytometry showing decreased CD11b+Gr1hi granulocytes in B6/Rag1−/− mice adoptively transferred with fl-Sirt1/CD4cre (SC) compared WT T effector cells (n=19). (b) Presence of these cells positively correlated with weight loss (n=19). (c) F4/80+ macrophages and (d) Ly6G+ granulocytes were decreased in mesenteric lymph nodes of B6/Rag1−/− mice adoptively transferred with fl-Sirt1/CD4cre compared WT T effector cells (n=10).
Phenotype of iTregs developing during colitis differs from that of nTregs
We next characterized the iTreg observed in our B6/Rag1−/− adoptive TE transfer autoimmune colitis model, and specifically, which known (thymic) Treg-associated markers were also expressed by iTregs. We stained splenocytes for CTLA4, CD39, CD127 and CD103 and evaluated their expression in each mouse in conjunction with weight loss. CD39 and CTLA4 expression was increased in WT vs. Sirt1/CD4cre iTregs (Fig. 7a and b) and neither correlated with weight data (not shown). WT TE also had significantly upregulated CTLA4 expression (Fig. 7b), and CTLA4 expression in TE strongly correlated with their proliferation (% of Ki67+ in TE: r=0.898, p=0.001) and with weight loss (r=0.920, p=0.004). These data suggest that in this colitis model, CTLA4 upregulation served as a marker of activated TE cells rather than as a marker of suppressive Treg cells. We also noted a strong upregulation of CD39 among the injected TE cells that remained Foxp3−, especially within WT TE cells (Fig. 7c), and that CD39 expression correlated with more severe weight loss (r=0.572, p=0.041). Collectively, these data suggest that CTLA4 and CD39 cannot serve as “classical” Treg-associated markers when evaluated in colitis.
Figure 7.
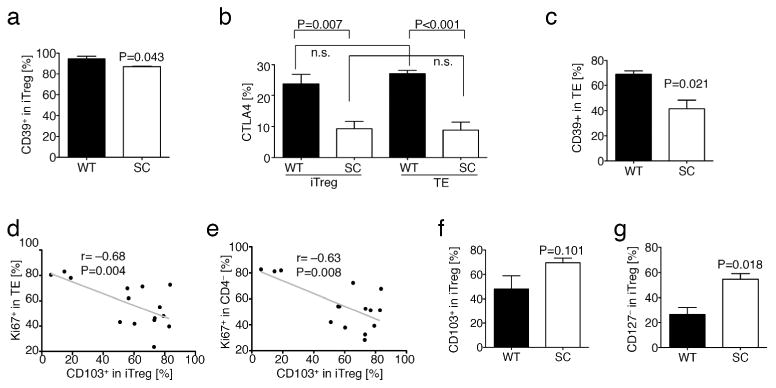
Induced Foxp3+Treg lacking Sirt1 are characterized by reduced CD127 expression and better suppression of TE and host cells. Pooled analysis of flow cytometry data of experiments from Figure 1. (a) iTreg (CD4+Foxp3+) from WT and fl-Sirt1/CD4cre (SC) express near similar levels of CD39. (b) CTLA4 expression is lower in SC TE (CD4+Foxp3−) as well as iTreg, but overall related to cell activation and proliferation rather than being a Treg selective marker. (c) CD39 expression is decreased in SC TE. (d, e) Ki-67 expression in Foxp3− TE (d) and CD4− host cells (e) negatively correlated with CD103+ expression in iTreg. (f) CD103 expression on iTreg shows a trend towards higher expression in B6/Rag1−/− mice injected with fl-Sirt1/CD4cre TE. (g) CD127− iTreg are more prevalent in fl-Sirt1/CD4cre TE adoptively transferred B6/Rag1−/− mice.
In contrast, expression of CD103 and loss of CD127 proved more useful. CD103 expression by the iTreg population was inversely correlated with divisions of both injected TE cells and host B6/Rag1−/− cells (Ki-67 in CD4+Foxp3− or CD4− cells), respectively (Fig. 7d and e), suggesting that this marker could be relevant to iTreg trafficking and/or function. Accordingly, Ki-67 expression was significantly lower in CD4+Foxp3− TE cells and in host CD4− cells of mice receiving Sirt1/CD4cre TE cells versus WT TE cells (Fig. 5a and b), indicating less proliferation of TE and host cells in recipients of fl-Sirt1/CD4cre TE. CD103 expression in iTregs also tended to be higher in Sirt1/CD4cre TE recipient group, but this difference did not reach statistical significance (Fig. 7f). We observed unusually high CD127 expression in CD4+Foxp3+ cells, possibly reflecting the inflammatory conditions in the colitis model. Of note, high CD127 expression in iTreg correlated with increased weight loss (p=0.415, p=0.039), and the CD127− subset of Sirt1/CD4cre iTregs was twice that of WT iTregs (Fig. 7g). Lastly, we sought to characterize the gut homing markers CCR9 and integrin α4β7 in iTregs isolated from spleens and mesenteric lymph nodes. Unfortunately, due to mild colitis in fl-Sirt1/CD4cre recipient mice, the cellularity of mesenteric lymph nodes was very low, precluding reliable evaluation of iTreg phenotype in that group. However, we compared splenic iTregs and found that fl-Sirt1/CD4cre iTregs had lower α4β7 expression, but tended to express more CCR9 (Suppl. fig. S4). Of note, naïve fl-Sirt1/CD4cre mice did not have any differences in CD4 TE or Treg cell expression of these markers in their spleens or mesenteric lymph nodes, as compared to naïve WT mice. However, baseline CD103 expression was significantly increased in Tregs of mesenteric and somatic lymph nodes of fl-Sirt1/CD4cre mice (Suppl. fig. S5). Taken together, in this colitis model, CTLA4+ and CD39+ are present on activated TE as well as iTreg cells, and therefore cannot serve as Treg-associated markers, whereas CD127− and potentially CD103+ iTregs are associated with decreased TE and host cell proliferation- and decreased weight loss.
Loss of Sirt1 in thymic–derived nTregs does not affect rescue from autoimmune colitis
Since our data indicated that lack of Sirt1 in TE might predispose them to increased iTreg formation and better outcomes in autoimmune colitis, we considered whether thymic–derived nTreg lacking Sirt1 might exhibit the same advantage. Given that most Tregs in the spleens of young mice are thought to consist of thymic–derived nTregs, we tested whether splenic Tregs were as effective as iTregs in promoting resolution of colitis. We injected WT TE cells i.v. into B6/Rag1−/− mice to induce colitis, and waited for the development of diarrhea and 5–15% weight loss. We then randomized mice into two groups, and injected them with FACS-sorted >95% pure YFP+Foxp3+ Treg from fl-Sirt1/Foxp3cre or control Foxp3cre mice. Based on our previous work with fl-Sirt1/Foxp3cre mice,13, 14 we expected that Sirt1−/− nTregs would have greater suppressive function than WT Tregs. We therefore transferred a sub-optimal number of nTregs (3 × 10⁵) to ensure that treatment with control Treg would be of limited success, so that we could distinguish differential effects of fl-Sirt1/Foxp3cre Treg therapy. As expected, fl-Sirt1/Foxp3cre nTreg showed superior preservation of their Foxp3 expression compared to controls (Fig. 8a), consistent with our previous results.14 However, this did not translate into any better outcome as both treatment groups had comparable weights (Fig. 8b), colon lengths (Fig. 8c), and cytokine production by CD4+ TE cells activated with PMA/ionomycin (Fig. 8d). Taken together, these results show that the lack of Sirt1 does not make splenic Treg (presumably mostly nTreg) more suppressive in our autoimmune colitis Treg rescue model.
Figure 8.

Rescue with thymic fl-Sirt1/Foxp3cre Treg is not superior to Foxp3cre Treg control. B6/Rag1−/− mice injected i.v. with 5 × 10⁵ 99% pure CD4+Foxp3− WT TE developed colitis with weight loss after 5 days. Mice with 5-15% weight loss were adoptively transferred i.v. with 3 × 10⁵ YFP-sorted Treg freshly isolated from spleens of either fl-Sirt1/Foxp3cre or Foxp3cre control mice. Data pooled from two independent experiments with 4 mice/group. (a) CD4+YFP+ Treg are higher in fl-Sirt1/Foxp3cre than Foxp3cre control Treg treated mice, suggestive of better Foxp3+ preservation. (b) Injection of thymic Treg led to a transient improvement in weight with either treatment. (c) Colon specimens indicate equal length (pooled data). (d) CD4+ TE reconstituted from B6/Rag1−/− mice react with equal cytokine production to PMA/ionomycin stimulation.
Sirt1 inhibition is effective at ameliorating DSS colitis in immunocompetent mice
Given our findings in the B6/Rag1−/− adoptive transfer colitis models, we decided to test if these results were translatable into a model closer to potential clinical application. We therefore studied the effects of Sirt1 targeting by pharmacologic inhibition, rather than gene deletion, and used immunocompetent C57BL/6 mice to prevent possibly confounding effects arising from the homeostatic proliferation of adoptively transferred cells in immunodeficient mice. We chose to use a chronic colitis model involving multiple repetitive cycles of 5% DSS interchanged with normal drinking water, designed to asses Th1 based immunopatholgy.21 We found that mice treated with the Sirt1 inhibitor EX-527 (1 mg/kg/d, i.p.) had less weight loss and rectal bleeding, as well as smaller spleen sizes, than mice receiving vehicle alone (Fig. 9a–d). Furthermore, histologic examination of colon samples showed decreased inflammation in the Sirt1 inhibitor-treated group (Fig. 9e– g). Among non-T cells, we found that vehicle control treated animals had more granulocytes and monocytes in their spleens (Fig. 9h), showing a trend towards a positive correlation with weight loss (Fig. 9i). Similar to the adoptive transfer colitis using TE cells lacking Sirt1, inhibition of Sirt1 increased the number of Foxp3+ Treg cells (Fig. 10a). Given the interrelated pathways of iTreg and Th17 T cell development and the importance for both cell types in the pathogenesis of autoimmune colitis,22 we tested if Sirt1 inhibition affected IL-6 or IL-17 production. We did not detect significant differences in IL-6 and IL-17 protein levels in samples from mice receiving Sirt1 inhibitor vs. DMSO (Fig. 10b and c). Collectively, our data show that Sirt1 inhibitor treatment can alleviate disease severity in a chronic model of colitis in immunocompetent mice, and consistent with the effects of Sirt1 deletion in adoptive transfer models, can promote iTreg formation and ameliorate the development of colitis.
Figure 9.
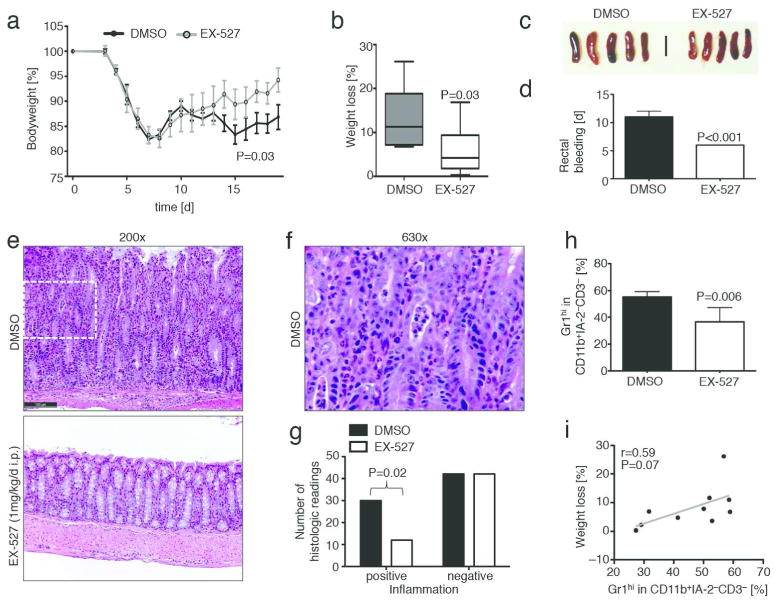
Sirt1 inhibition limits severity of DSS induced colitis and leads to attenuated inflammation. (a) C57Bl/6 mice received three 5d cycles of 5% DSS challenges followed by a brief 2-3 d recovery. Animals received either the Sirt1 inhibitor EX-527 (1 mg/kg/d i.p.) or DMSO vehicle control (n=18). (b) Limited weight loss was noted in EX-527 treated mice. (c) Spleen sizes appeared slightly enlarged in the control DMSO group. (d) EX-527 treated mice had less rectal bleeding. (e–g): Upon histologic analysis, control animals demonstrate features of severe colitis including (e) marked crypt architectural distortion with neutrophilic infiltration of the lamina propria, crypt epithelium (“cryptitis”), and glandular lumina (“crypt abscess”). Inflammatory changes were ameliorated with addition of a Sirt1 inhibitor (EX-527). (f): Magnification of area indicated by dashed frame in DMSO treatement group colon specimen from (e). (g) Pooled data from blinded histologic analysis suggest that Sirt1 inhibitor treated animals had a lower degree of inflammation, intraepithelial lymphocytes (IEL), and inflammatory activity. H&E staining; scale bar indicates 100 μm. (h) Flow cytometry showing decreased CD11b+Gr1hi granulocytes and monocytes in EX-527 recipients (n=10). (i) Trend towards positive correlation between CD11b+Gr1hi cells and weight loss.
Figure 10.
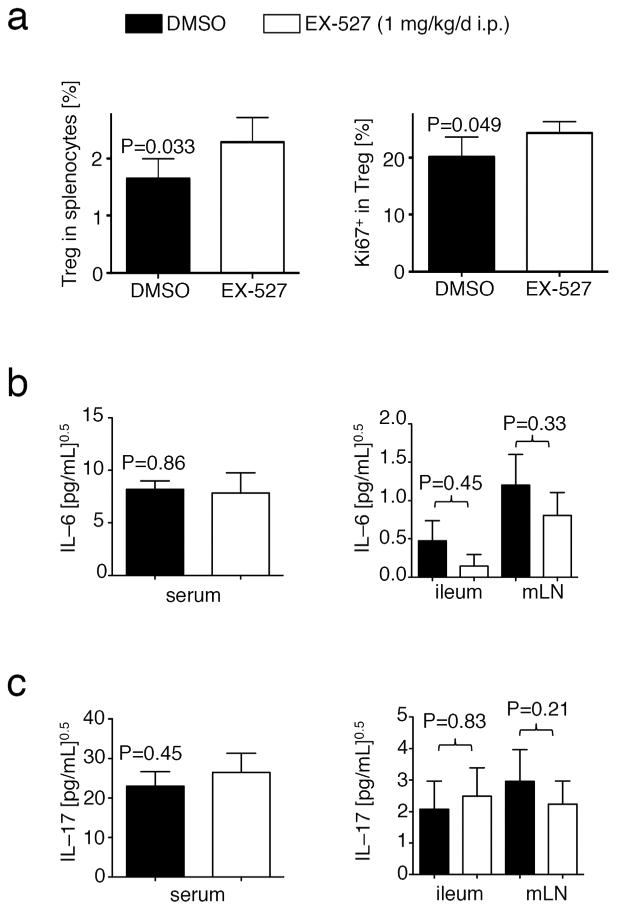
Sirt1 inhibition promotes iTreg formation, and does not affect IL–6 and IL–17 production during dextran sodium sulfate colitis. (a) Sirt1 inhibitor treated mice exhibited a higher Foxp3+Treg among splenocytes, which divided better (Ki-67 expression, right panel). (b, c) Elisa showing IL-6 (b) and IL-17 (c) levels in sera, ileum, and mesenteric lymph nodes (mLN) from experiments in Figure 6. Data were normalized by square root calculation, as indicated.
Discussion
Immunomodulatory therapy is a promising strategy to limit the burden of IBD. The past two decades have shown remarkable progress in this area, leading to the introduction of innovative therapies into clinical practice.23 Prominent examples include infliximab, a monoclonal antibody against TNF-α, and, more recently, ustekinumab, a monoclonal antibody against the p40 subunit shared by IL–23 and IL–12.23-25 Here, we show that deletion of Sirt1 in CD4+Foxp3− TE resulted in markedly reduced colitis in a B6/Rag1−/− adoptive transfer model. We observed an increased formation of Tregs in the B6/Rag1−/− mice that received fl-Sirt1/CD4cre TE. Through our study design, we ensured that the injected TE were depleted for Foxp3+ Tregs. Hence, Foxp3+ Tregs observed at the end of the experiment were most likely iTregs, which are considered to critical to control of IBD pathophysiology.26 Recently, Karlsson et al directly compared iTregs to freshly isolated Tregs in controlling autoimmune colitis, and found that iTregs were superior.27 In contrast to nTregs, which are part of a mechanism to suppress reactions to self-antigen, iTregs develop in response to exogenous antigens in the periphery, consistent with the principle that mucosal surfaces have to encounter and deal with new antigens on an ongoing basis.28, 29 This fits well with observations that mice incapable of forming iTregs are prone to mucosal, but not other autoimmunity.11, 12 Given these data, our observation that lack of Sirt1 leads to increased iTreg formation in vivo may be of particular relevance for IBD therapy.
We have previously shown that targeting of Sirt1 does not affect TE cell function or proliferation in vitro or in vivo.13 Here, we also noted that fl-Sirt1/CD4cre cells were as responsive to Treg-mediated suppression as WT TE cells. However, Foxp3+ Treg numbers and suppressive function are increased by genetic or pharmacologic targeting of Sirt1.13, 14 The mechanisms responsible were investigated by us and others.13, 14, 16-18, 30, 31 Foxp3 is deacetylated by Sirt1, and Sirt1 inhibition leads to increased Foxp3 acetylation, which makes Foxp3 resistant to proteasomal degradation, and thus stabilizes Foxp3 post-translationally, increasing its quantity.14, 16-18, 30 In addition, acetylated Foxp3 has enhanced DNA binding to the promoter regions of key transcripts regulated by Foxp3, such as IL-2 and CTLA4.31 Kwon et al have identified three Foxp3 lysine residues via mass spectrometry, that are subjected to Sirt1 dependent deacetylation (K31, K263, and K268 in human Foxp3), and noted that naïve T cells converted more easily to iTreg in vitro when treated with a Sirt1 inhibitor.17 Besides deacetylating Foxp3, Sirt1 deacetylates p65, the larger subunit of NF-κB, which is part of the c-Rel enhanceosome that promotes Foxp3 mRNA expression.32 Preventing Sirt1 from deacetylating p65 at K310 leaves p65 more acetylated, which leads to increased transcriptional activity.33 We have previously shown that Treg lacking Sirt1 exhibit more p65 K310 acetylation, along with increased p65 nuclear translocation, and more Foxp3 mRNA expression.13, 14 Thus, the increase in acetylation of both p65 and Foxp3, as well as an increase in Foxp3 mRNA gene expression as a result of Sirt1 targeting, promote the formation of iTregs.
It is important to note that K310 acetylation and transcriptional activation of p65 can, in some circumstances also augment inflammation, as illustrated by the effects of myeloid cell-specific deletion of Sirt1.34 Therefore, we considered it essential to assess what happened when normal, immunocompetent animals were treated with a Sirt1 inhibitor and exposed to multiple cycles of DSS challenge. The DSS colitis model is different to the autoimmune colitis in TE-transferred B6/Rag1−/− mice, as it is initiated by non-immune mechanism of mucosal injury. However, cyclic administration of DSS interchanged with fresh drinking water results in a chronic colitis with a strong Th1-mediated immune component.21, 35 In fact, DSS colitis is also dependent on Foxp3+ Treg cells, whose depletion can profoundly worsen colitis and disease outcomes.36 These factors led us to investigate DSS colitis as a model that would a) investigate mice with normal immune system, and b) study the global effects of pharmacologic inhibition of Sirt1, as opposed to a targeted genetic deletion. In both adoptive transfer and chronic DSS models, Sirt1 targeting resulted in increased Foxp3+ Treg cell numbers at the end of each experiment, and increased Treg numbers were associated with lower disease activity, better weight preservation, and less lymphoproliferation. Furthermore, we have also looked directly at non–T cell responses, and noted that both pharmacologic targeting of Sirt1 in the DSS model, as well as the genetic deletion of Sirt1 in the B6/Rag1−/− adoptive transfer colitis model, led to reduced granulocyte numbers in the mesenteric lymph nodes of mice subjected to Sirt1 targeting. Of note, murine Tregs have been previously shown to suppress neutrophil accumulation and survival.37, 38 Thus, the differences, between DMSO and Sirt1 inhibitor treated mice, in disease outcomes and splenic enlargement shows that pharmacologic Sirt1 targeting has a net immunosuppressive effect.
In addition to increasing Foxp3+ iTreg numbers, the phenotypic properties of these cells may be important. For example, iTreg arising from fl-Sirt1/CD4cre TE cells tended to have increased expression of CD103 (αE integrin), that along with integrin β7, is essential for T cells to travel to the intraepithelial space.39 Furthermore, low CD127 expression, shown on Sirt1−/− iTreg in our studies, is associated with improved Foxp3+ Treg suppressive function in humans.40 Since both parameters were correlated with reduced weight loss and attenuated disease, these findings may provide mechanistic clues as to the factors that are most important in iTreg function in the control of IBD.
In conclusion, deletion of Sirt1 alleviates adoptive transfer colitis. Likewise, in WT animals exposed to cyclic DSS challenge, treatment with a Sirt1 inhibitor limits disease severity and weight loss. Our data indicate that in both cases, the formation of Foxp3+ iTreg is accentuated by Sirt1 targeting, and contributes to a better disease outcome. Therefore, we propose that Sirt1 may be a suitable target in IBD, especially due to the relative importance of iTregs in controlling immune homeostasis in the gastrointestinal tract.
Methods
Mice
Wild-type (WT) C57BL/6 (CD90.1 and CD90.2) and B6/Rag1−/− (Jackson Laboratory, Bar Harbor, ME), fl-Sirt1/CD4cre13, fl-Sirt1/Foxp3cre13, and Foxp3cre41 mice were housed under specific-pathogen-free conditions, and studied using a protocol approved by the Institutional Animal Care and Use Committee of the Children's Hospital of Philadelphia.
High purity T cell isolation
We isolated lymphocytes from spleens and cervical, axillary and inguinal lymph nodes. After preparing single cell suspension and cell counting, we used magnetic beads (Miltenyi Biotec) to isolate TE (CD4+CD25−), Treg (CD4+CD25+) and CD4+ cells, as well as antigen-presenting cells (CD90.2−). To achieve >98% pure CD4+CD25−Foxp3− TE cells, a single cell suspension of lymphocytes were incubated with 1.5x the recommended amounts of antibodies (biotin-conjugated Abs against non-CD4 cells, and anti-biotin MicroBeads). Isolation was performed in the dark, the total amount of cells for the LD column was restricted to 1 × 10⁸ and additional LD columns were used if needed. Finally, the purity of isolated cells was documented for each experiment to ensure that data did not result from any differences in TE or Treg purity. For the autoimmune colitis Treg rescue model (Fig. 8), we isolated lymphocytes from Foxp3cre and fl-Sirt1/Foxp3cre mice and purified CD4+ cells as above. Then, we sorted CD4+YFP+(Foxp3+) Tregs via a FACS Aria cell sorter (BD Bioscience, UPenn Cell Sorting Facility).
T cell function
For assessment of in vitro cytokine production, we incubated freshly isolated TE cells from WT and fl-Sirt1/CD4cre mice overnight (37° C, 5% CO2) in 24 well plates pre–coated with CD3ε and CD28 mAb (2 μg/mL). In the morning, PMA/ionomycin (Sigma Aldrich, cat. P1585-1MG and I0634-1MG) and GolgiStop (BD Biosciences, Cat. 51-2092kz) were added to reach final concentrations of 50 ng/mL PMA, 1 μM ionomycin, and GolgiStop at 0.67 μL per mL medium. Cells were then incubated for 5 additional hours (37° C, 5% CO2), and then harvested for flow cytometry. We used the Fixation/Permeabilization Buffer set from eBioscience (cat. 88-8823-88) for intranuclear staining. To test TE cells for suppression by Treg, we used freshly isolated CFSE-labeled WT and fl-Sirt1/CD4cre TE, with or without WT Tregs, and incubated them for 72 h in the presence of irradiated WT antigen presenting cells and CD3ε mAb. After 72 h, cells were harvested, labeled with CD4-fluorescent mAb and analyzed by flow cytometry.
Flow cytometry, antibodies and small molecules
For flow cytometry, we purchased mAbs to murine CD4 (Pacific Blue and APC-H7 from Biolegend, PE-CF594 and APC-Cy7 from BD Pharmingen), Ki-67 (PerCP-Cy5.5, clone B56, BD Pharmingen), Foxp3 (PE and eFluor450, clone FJK-16s, eBioscience), CTLA4 (PE, BD Pharmingen), I-A/I-E (FITC, BD Pharmingen), CD11b (APC from eBioscience, Pe/Cy7 from Biolegend), Ly-6G (APC, Biolegend), Ly-6C (Pacific Blue, Biolegend), Gr-1 (APC, Biolegend), F4/80 (APC and PE, Biolegend), CD11c (APC/Cy7, Biolegend), CD39 (eFluor 660, eBioscience), CD103 (PE, Biolegend), CD127 (Brilliant Violet421, Biolegend), CCR9 (FITC, Biolegend), and Integrin α4β7 (APC, Biolegend). For the analysis of mesenteric lymph nodes, we used the Aqua LIVE/DEAD® Fixable Dead Cell Stain Kit to exclude false positive signals from dead and apoptotic cells, and then washed two times prior to antibody staining. We purchased EX-527 from Tocris Bioscience. Drugs were dissolved in dimethylsulfoxide (DMSO), and DMSO was used as a control.
Colitis
We examined three models of colitis. First, in a model involving iTreg formation, 9-10 week old B6/Rag1−/− mice were adoptively transferred i.v. with 5 × 10⁵ CD4+CD25−Foxp3− TE cells from either WT or fl-Sirt1/CD4cre mice. Mice were observed for weight, gross blood in their stool, and other clinical parameters as previously reported.42 In a second model, we adoptively transferred B6/Rag1−/− mice with 5 × 10⁵ CD90.1+CD4+CD25−Foxp3− TE cells i.v., and waited for 10 days to let clinically significant colitis develop, with 5-15% of weight loss. We then randomized mice to treatment groups, administered i.v. a sub-optimal dose of 3 × 10⁵ FACS-sorted CD4+YFP+Foxp3+ Treg cells, using Tregs from either fl-Sirt1/Foxp3cre or Foxp3cre (control) mice, and followed the course of colitis, as above. In a third model, we assessed colitis induced using 5% DSS (dextran sulfate sodium (wt/vol), molecular weight 36-50 kDa, Cat. #160110, MP Biomedicals, Solon, OH), and daily administration of either DMSO or EX-527 (1 mg/kg/d i.p.), as reported.42 In all three models, mice were individually labeled to enable correlation of flow cytometry data with clinical observations. After each experiment, gut and lymphoid tissues were collected for histologic and flow cytometric analysis. For histology, we obtained the entire colon, and for RNA isolation we used a 2 cm colon piece caudal to the ileo-cecal junction.
RNA isolation and quantitative PCR
RNA extracted using RNeasy kits (Qiagen) was reverse transcribed to cDNA with random hexamers, and quantified by qPCR as previously described.13 We used the StepOnePlus real-time PCR system and TaqMan assay reagents (Applied Biosystems). Differences in cDNA input were corrected by normalizing signals for 18S rRNA. Assessment of inflammatory markers from the colon was normalized against healthy B6/Rag1−/− controls. For some mRNA, such as IL–17, the signal in healthy B6/Rag1−/− mice was too low since these mice lack their own T-cells. In those instances, relative expression between control and intervention groups was determined.
ELISA
We obtained 0.5–1 mL blood from cardiac puncture immediately after euthanasia, and isolated serum. In addition, we collected the supernatants of 2 cm ilium and four mesenteric lymph nodes after being grinded in phosphate buffered saline. We obtained ELISA kits (Biolegend) for mouse IL–6 (Lot No. B154708) and IL–17 (Lot No. B152494), and processed according to the manufacturer's instructions. Plates were read in an iMark™ Microplate Reader (BioRad). Measurements were done in duplicate (serum) or triplicate (ileum and mesenteric lymph nodes).
Histology
Segments of bowel that included small intestine, terminal ileum, and colon were fixed in 10% neutral buffered formalin, paraffin-embedded, and hematoxylin and eosin-stained sections (4 μm) were reviewed by a pathologist (T.R.B) blinded to treatment conditions. Histologic findings were characterized using a modification of the scoring systems of Laroux et al.43 and Aranda et al.44 to include the following parameters: (1) degree of lamina propria inflammation graded 0-3; (2) degree of mucin depletion as evidenced by loss of goblet cells graded 0-2; (3) reactive epithelial changes (nuclear hyperchromatism, random nuclear atypia, increased mitotic activity) graded 0-3; (4) number of intraepithelial lymphocytes per high power field within crypts graded 0-3; (5) degree of crypt architectural distortion graded 0-3; (6) degree of inflammatory activity (infiltration of neutrophils within lamina propria and crypt epithelium, “cryptitis”) graded 0-2; (7) degree of transmural inflammation graded 0-2; and (8) degree of mucosal surface erosion up to total surface ulceration graded 0-2. The total histopathologic score was determined from the sum of the scores for each parameter to reflect the overall degree of inflammation within each specimen.
Immunohistochemistry
Immunohistochemistry of parafin-embedded sections, prepared as above, was performed with primary antibodies to CD3 (DAKO A0452; 1:100) with DAB (DAKO Cytomation). Immunostained slides were scanned using the Aperio ScanScope® CS slide scanner (Aperio Technologies, Vista, CA). Whole slide digitized images were analyzed using the Aperio ImageScope software (version 10.0.1346.1807; Aperio Technologies, Vista, CA) for determination of the percentage of cells with membranous decoration for CD3 from the total number of cells present on the slide. Only cells with high 3+ intensity of staining were selected for analysis.
Statistical analysis
Data were analyzed using GraphPad Prism 5.0d software. All data were tested for normal distribution of variables, and normally distributed data were displayed as means ± SEM. ELISA data were normalized using square root calculations. Comparisons between two groups were assessed with a Student-t test if normally distributed, or Mann-Whitney U test if otherwise. Likewise, groups of three or more were analyzed by one-way analysis of variance (ANOVA) if normally distributed, or the Kruskal-Wallis test if not. For correlation, we used Pearson correlation for normally distributed data.
Supplementary Material
Supplemental Figure S1. Adoptively transferred T effector cells lacking Sirt1 cause less failure to thrive in 6 weeks old B6/Rag1−/− mice. Mice were adoptively transferred with 5 × 10⁵ CD4+CD25− T effector cells (TE) i.v. of either C57Bl/6 wild type (WT), or fl-Sirt1/CD4cre origin and followed until autoimmune colitis developed. Mice receiving fl-Sirt1/CD4cre TE continued to grow while WT controls had growth retardation (n=5 per group).
Supplemental Figure S2. Equal CD4+Foxp3− purity in magnetic bead isolated CD4+CD25- T effector cells. Panel (a) shows cells from the lymphocyte gate, and panel (a) is the CD4+ gate indicated in (a). Purity results are representative for all magnetic bead-based TE isolations.
Supplemental Figure S3. Equal Ki-67 expression in WT and fl-Sirt1/CD4cre iTregs. iTreg arising after TE cells were injected into B6/Rag1−/− mice had similar Ki–67 expression, regardless of whether or not Sirt1 was absent (n=25 mice).
Supplemental Figure S4. Integrin α4β7 and CCR9 expression in iTregs. Induced Treg (iTreg) from T effector cells injected into B6/Rag1−/− mice had Integrin α4β7 expression and tended to have higher CCR9 expression if Sirt1 was deleted (n=8). Abbreviations: WT, wild type; SC, fl-Sirt1/CD4cre.
Supplemental Figure S5. Baseline intestinal homing antigen expression in fl-Sirt1/CD4cre mice. Flow cytometry intestinal homing antigens of TE (CD4+Foxp3−) and Treg (CD4+Foxp3+) from mesenteric and somatic (axilliary, inguinal, cervical) lymph nodes, denoted as mLN and sLN, respectively, and spleens of WT and fl-Sirt1/CD4cre mice (n=3 per group).
Acknowledgments
This project was supported by Award Number K08AI095353 (to U.H.B.), AI073489, and AI095276 (to W.W.H.) from the National Institute of Allergy and Infectious Diseases. The content is solely the responsibility of the authors and does not necessarily represent the official views of the National Institute of Allergy and Infectious Diseases or the National Institutes of Health. We thank Benjamin L. Laskin for proofreading our manuscript.
Grant support: K08AI095353 to U.H.B., AI073489, and AI095276 to W.W.H.
Footnotes
The authors declare no conflicts of interest.
Author Contributions: UHB and WWH conceived the project and developed the experimental design. Contributed data: UHB, TA, HX, YL, TRB, LW, RH, KZ. Analyzed data: UHB, TA, YL, TRB, EE, SS, WWH. UHB and TA wrote the paper. WWH edited the paper.
References
- 1.Macdonald TT, Monteleone G. Immunity, inflammation, and allergy in the gut. Science. 2005;307(5717):1920–1925. doi: 10.1126/science.1106442. [DOI] [PubMed] [Google Scholar]
- 2.Izcue A, Coombes JL, Powrie F. Regulatory lymphocytes and intestinal inflammation. Annual review of immunology. 2009;27:313–338. doi: 10.1146/annurev.immunol.021908.132657. [DOI] [PubMed] [Google Scholar]
- 3.Himmel ME, Yao Y, Orban PC, Steiner TS, Levings MK. Regulatory T-cell therapy for inflammatory bowel disease: more questions than answers. Immunology. 2012;136(2):115–122. doi: 10.1111/j.1365-2567.2012.03572.x. [DOI] [PMC free article] [PubMed] [Google Scholar]
- 4.Curotto de Lafaille MA, Lafaille JJ. Natural and adaptive foxp3+ regulatory T cells: more of the same or a division of labor? Immunity. 2009;30(5):626–635. doi: 10.1016/j.immuni.2009.05.002. [DOI] [PubMed] [Google Scholar]
- 5.Hori S, Nomura T, Sakaguchi S. Control of regulatory T cell development by the transcription factor Foxp3. Science. 2003;299(5609):1057–1061. doi: 10.1126/science.1079490. [DOI] [PubMed] [Google Scholar]
- 6.Fontenot JD, Gavin MA, Rudensky AY. Foxp3 programs the development and function of CD4+CD25+ regulatory T cells. Nat Immunol. 2003;4(4):330–336. doi: 10.1038/ni904. [DOI] [PubMed] [Google Scholar]
- 7.Bennett CL, Christie J, Ramsdell F, Brunkow ME, Ferguson PJ, Whitesell L, et al. The immune dysregulation, polyendocrinopathy, enteropathy, X-linked syndrome (IPEX) is caused by mutations of FOXP3. Nature genetics. 2001;27(1):20–21. doi: 10.1038/83713. [DOI] [PubMed] [Google Scholar]
- 8.Wang Y, Liu XP, Zhao ZB, Chen JH, Yu CG. Expression of CD4+ forkhead box P3 (FOXP3)+ regulatory T cells in inflammatory bowel disease. Journal of digestive diseases. 2011;12(4):286–294. doi: 10.1111/j.1751-2980.2011.00505.x. [DOI] [PubMed] [Google Scholar]
- 9.Ban H, Andoh A, Shioya M, Nishida A, Tsujikawa T, Fujiyama Y. Increased number of FoxP3+CD4+ regulatory T cells in inflammatory bowel disease. Molecular medicine reports. 2008;1(5):647–650. doi: 10.3892/mmr_00000006. [DOI] [PubMed] [Google Scholar]
- 10.Bilate AM, Lafaille JJ. Induced CD4+Foxp3+ regulatory T cells in immune tolerance. Annual review of immunology. 2012;30:733–758. doi: 10.1146/annurev-immunol-020711-075043. [DOI] [PubMed] [Google Scholar]
- 11.Josefowicz SZ, Niec RE, Kim HY, Treuting P, Chinen T, Zheng Y, et al. Extrathymically generated regulatory T cells control mucosal TH2 inflammation. Nature. 2012;482(7385):395–399. doi: 10.1038/nature10772. [DOI] [PMC free article] [PubMed] [Google Scholar]
- 12.Schlenner SM, Weigmann B, Ruan Q, Chen Y, von Boehmer H. Smad3 binding to the foxp3 enhancer is dispensable for the development of regulatory T cells with the exception of the gut. The Journal of experimental medicine. 2012;209(9):1529–1535. doi: 10.1084/jem.20112646. [DOI] [PMC free article] [PubMed] [Google Scholar]
- 13.Beier UH, Wang L, Bhatti TR, Liu Y, Han R, Ge G, et al. Sirtuin-1 targeting promotes Foxp3+ T-regulatory cell function and prolongs allograft survival. Mol Cell Biol. 2011;31(5):1022–1029. doi: 10.1128/MCB.01206-10. [DOI] [PMC free article] [PubMed] [Google Scholar]
- 14.Beier UH, Wang L, Han R, Akimova T, Liu Y, Hancock WW. Histone deacetylases 6 and 9 and sirtuin-1 control Foxp3+ regulatory T cell function through shared and isoform-specific mechanisms. Science signaling. 2012;5(229):ra45. doi: 10.1126/scisignal.2002873. [DOI] [PMC free article] [PubMed] [Google Scholar]
- 15.Houtkooper RH, Pirinen E, Auwerx J. Sirtuins as regulators of metabolism and healthspan. Nature reviews Molecular cell biology. 2012;13(4):225–238. doi: 10.1038/nrm3293. [DOI] [PMC free article] [PubMed] [Google Scholar]
- 16.van Loosdregt J, Brunen D, Fleskens V, Pals CE, Lam EW, Coffer PJ. Rapid temporal control of Foxp3 protein degradation by sirtuin-1. PloS one. 2011;6(4):e19047. doi: 10.1371/journal.pone.0019047. [DOI] [PMC free article] [PubMed] [Google Scholar]
- 17.Kwon HS, Lim HW, Wu J, Schnolzer M, Verdin E, Ott M. Three novel acetylation sites in the Foxp3 transcription factor regulate the suppressive activity of regulatory T cells. J Immunol. 2012;188(6):2712–2721. doi: 10.4049/jimmunol.1100903. [DOI] [PMC free article] [PubMed] [Google Scholar]
- 18.Beier UH, Akimova T, Liu Y, Wang L, Hancock WW. Histone/protein deacetylases control Foxp3 expression and the heat shock response of T-regulatory cells. Current opinion in immunology. 2011;23(5):670–678. doi: 10.1016/j.coi.2011.07.002. [DOI] [PMC free article] [PubMed] [Google Scholar]
- 19.Josefowicz SZ, Lu LF, Rudensky AY. Regulatory T cells: mechanisms of differentiation and function. Annual review of immunology. 2012;30:531–564. doi: 10.1146/annurev.immunol.25.022106.141623. [DOI] [PMC free article] [PubMed] [Google Scholar]
- 20.Scholzen T, Gerdes J. The Ki-67 protein: from the known and the unknown. Journal of cellular physiology. 2000;182(3):311–322. doi: 10.1002/(SICI)1097-4652(200003)182:3<311::AID-JCP1>3.0.CO;2-9. [DOI] [PubMed] [Google Scholar]
- 21.Okayasu I, Hatakeyama S, Yamada M, Ohkusa T, Inagaki Y, Nakaya R. A novel method in the induction of reliable experimental acute and chronic ulcerative colitis in mice. Gastroenterology. 1990;98(3):694–702. doi: 10.1016/0016-5085(90)90290-h. [DOI] [PubMed] [Google Scholar]
- 22.Veldhoen M, Hocking RJ, Atkins CJ, Locksley RM, Stockinger B. TGFbeta in the context of an inflammatory cytokine milieu supports de novo differentiation of IL-17-producing T cells. Immunity. 2006;24(2):179–189. doi: 10.1016/j.immuni.2006.01.001. [DOI] [PubMed] [Google Scholar]
- 23.Abraham C, Cho JH. Inflammatory bowel disease. The New England journal of medicine. 2009;361(21):2066–2078. doi: 10.1056/NEJMra0804647. [DOI] [PMC free article] [PubMed] [Google Scholar]
- 24.Rutgeerts P, Van Assche G, Vermeire S. Review article: Infliximab therapy for inflammatory bowel disease--seven years on. Alimentary pharmacology & therapeutics. 2006;23(4):451–463. doi: 10.1111/j.1365-2036.2006.02786.x. [DOI] [PubMed] [Google Scholar]
- 25.Sandborn WJ, Gasink C, Gao LL, Blank MA, Johanns J, Guzzo C, et al. Ustekinumab induction and maintenance therapy in refractory Crohn's disease. The New England journal of medicine. 2012;367(16):1519–1528. doi: 10.1056/NEJMoa1203572. [DOI] [PubMed] [Google Scholar]
- 26.Boden EK, Snapper SB. Regulatory T cells in inflammatory bowel disease. Current opinion in gastroenterology. 2008;24(6):733–741. doi: 10.1097/mog.0b013e328311f26e. [DOI] [PubMed] [Google Scholar]
- 27.Karlsson F, Martinez NE, Gray L, Zhang S, Tsunoda I, Grisham MB. Therapeutic Evaluation of Ex Vivo-Generated Versus Natural Regulatory T-cells in a Mouse Model of Chronic Gut Inflammation. Inflammatory bowel diseases. 2013;19(11):2282–2294. doi: 10.1097/MIB.0b013e31829c32dd. [DOI] [PMC free article] [PubMed] [Google Scholar]
- 28.Workman CJ, Szymczak-Workman AL, Collison LW, Pillai MR, Vignali DA. The development and function of regulatory T cells. Cellular and molecular life sciences : CMLS. 2009;66(16):2603–2622. doi: 10.1007/s00018-009-0026-2. [DOI] [PMC free article] [PubMed] [Google Scholar]
- 29.Weiner HL, da Cunha AP, Quintana F, Wu H. Oral tolerance. Immunological reviews. 2011;241(1):241–259. doi: 10.1111/j.1600-065X.2011.01017.x. [DOI] [PMC free article] [PubMed] [Google Scholar]
- 30.van Loosdregt J, Vercoulen Y, Guichelaar T, Gent YY, Beekman JM, van Beekum O, et al. Regulation of Treg functionality by acetylation-mediated Foxp3 protein stabilization. Blood. 2010;115(5):965–974. doi: 10.1182/blood-2009-02-207118. [DOI] [PubMed] [Google Scholar]
- 31.Liu Y, Wang L, Han R, Beier UH, Hancock WW. Two lysines in the forkhead domain of foxp3 are key to T regulatory cell function. PloS one. 2012;7(1):e29035. doi: 10.1371/journal.pone.0029035. [DOI] [PMC free article] [PubMed] [Google Scholar]
- 32.Ruan Q, Kameswaran V, Tone Y, Li L, Liou HC, Greene MI, et al. Development of Foxp3(+) regulatory t cells is driven by the c-Rel enhanceosome. Immunity. 2009;31(6):932–940. doi: 10.1016/j.immuni.2009.10.006. [DOI] [PMC free article] [PubMed] [Google Scholar]
- 33.Chen LF, Mu Y, Greene WC. Acetylation of RelA at discrete sites regulates distinct nuclear functions of NF-kappaB. The EMBO journal. 2002;21(23):6539–6548. doi: 10.1093/emboj/cdf660. [DOI] [PMC free article] [PubMed] [Google Scholar]
- 34.Schug TT, Xu Q, Gao H, Peres-da-Silva A, Draper DW, Fessler MB, et al. Myeloid deletion of SIRT1 induces inflammatory signaling in response to environmental stress. Mol Cell Biol. 2010;30(19):4712–4721. doi: 10.1128/MCB.00657-10. [DOI] [PMC free article] [PubMed] [Google Scholar]
- 35.Perse M, Cerar A. Dextran sodium sulphate colitis mouse model: traps and tricks. Journal of biomedicine & biotechnology. 2012;2012:718617. doi: 10.1155/2012/718617. [DOI] [PMC free article] [PubMed] [Google Scholar]
- 36.Boehm F, Martin M, Kesselring R, Schiechl G, Geissler EK, Schlitt HJ, et al. Deletion of Foxp3+ regulatory T cells in genetically targeted mice supports development of intestinal inflammation. BMC gastroenterology. 2012;12:97. doi: 10.1186/1471-230X-12-97. [DOI] [PMC free article] [PubMed] [Google Scholar]
- 37.Richards H, Williams A, Jones E, Hindley J, Godkin A, Simon AK, et al. Novel role of regulatory T cells in limiting early neutrophil responses in skin. Immunology. 2010;131(4):583–592. doi: 10.1111/j.1365-2567.2010.03333.x. [DOI] [PMC free article] [PubMed] [Google Scholar]
- 38.Lee DC, Harker JA, Tregoning JS, Atabani SF, Johansson C, Schwarze J, et al. CD25+ natural regulatory T cells are critical in limiting innate and adaptive immunity and resolving disease following respiratory syncytial virus infection. Journal of virology. 2010;84(17):8790–8798. doi: 10.1128/JVI.00796-10. [DOI] [PMC free article] [PubMed] [Google Scholar]
- 39.Shibahara T, Si-Tahar M, Shaw SK, Madara JL. Adhesion molecules expressed on homing lymphocytes in model intestinal epithelia. Gastroenterology. 2000;118(2):289–298. doi: 10.1016/s0016-5085(00)70211-3. [DOI] [PubMed] [Google Scholar]
- 40.Liu W, Putnam AL, Xu-Yu Z, Szot GL, Lee MR, Zhu S, et al. CD127 expression inversely correlates with FoxP3 and suppressive function of human CD4+ T reg cells. The Journal of experimental medicine. 2006;203(7):1701–1711. doi: 10.1084/jem.20060772. [DOI] [PMC free article] [PubMed] [Google Scholar]
- 41.Rubtsov YP, Rasmussen JP, Chi EY, Fontenot J, Castelli L, Ye X, et al. Regulatory T cell-derived interleukin-10 limits inflammation at environmental interfaces. Immunity. 2008;28(4):546–558. doi: 10.1016/j.immuni.2008.02.017. [DOI] [PubMed] [Google Scholar]
- 42.de Zoeten EF, Wang L, Sai H, Dillmann WH, Hancock WW. Inhibition of HDAC9 increases T regulatory cell function and prevents colitis in mice. Gastroenterology. 2010;138(2):583–594. doi: 10.1053/j.gastro.2009.10.037. [DOI] [PMC free article] [PubMed] [Google Scholar]
- 43.Laroux FS, Norris HH, Houghton J, Pavlick KP, Bharwani S, Merrill DM, et al. Regulation of chronic colitis in athymic nu/nu (nude) mice. International immunology. 2004;16(1):77–89. doi: 10.1093/intimm/dxh006. [DOI] [PubMed] [Google Scholar]
- 44.Aranda R, Sydora BC, McAllister PL, Binder SW, Yang HY, Targan SR, et al. Analysis of intestinal lymphocytes in mouse colitis mediated by transfer of CD4+, CD45RBhigh T cells to SCID recipients. J Immunol. 1997;158(7):3464–3473. [PubMed] [Google Scholar]
Associated Data
This section collects any data citations, data availability statements, or supplementary materials included in this article.
Supplementary Materials
Supplemental Figure S1. Adoptively transferred T effector cells lacking Sirt1 cause less failure to thrive in 6 weeks old B6/Rag1−/− mice. Mice were adoptively transferred with 5 × 10⁵ CD4+CD25− T effector cells (TE) i.v. of either C57Bl/6 wild type (WT), or fl-Sirt1/CD4cre origin and followed until autoimmune colitis developed. Mice receiving fl-Sirt1/CD4cre TE continued to grow while WT controls had growth retardation (n=5 per group).
Supplemental Figure S2. Equal CD4+Foxp3− purity in magnetic bead isolated CD4+CD25- T effector cells. Panel (a) shows cells from the lymphocyte gate, and panel (a) is the CD4+ gate indicated in (a). Purity results are representative for all magnetic bead-based TE isolations.
Supplemental Figure S3. Equal Ki-67 expression in WT and fl-Sirt1/CD4cre iTregs. iTreg arising after TE cells were injected into B6/Rag1−/− mice had similar Ki–67 expression, regardless of whether or not Sirt1 was absent (n=25 mice).
Supplemental Figure S4. Integrin α4β7 and CCR9 expression in iTregs. Induced Treg (iTreg) from T effector cells injected into B6/Rag1−/− mice had Integrin α4β7 expression and tended to have higher CCR9 expression if Sirt1 was deleted (n=8). Abbreviations: WT, wild type; SC, fl-Sirt1/CD4cre.
Supplemental Figure S5. Baseline intestinal homing antigen expression in fl-Sirt1/CD4cre mice. Flow cytometry intestinal homing antigens of TE (CD4+Foxp3−) and Treg (CD4+Foxp3+) from mesenteric and somatic (axilliary, inguinal, cervical) lymph nodes, denoted as mLN and sLN, respectively, and spleens of WT and fl-Sirt1/CD4cre mice (n=3 per group).