

A systematic survey shows increased levels of secondary structure in the 5′ UTR near the 5′ cap in mRNAs that are regulated by miRNA in animals, but not in plants.
Keywords: RNA structure, 5′ untranslated region, microRNA, gene regulation
Abstract
Recent studies have suggested that the secondary structure of the 5′ untranslated region (5′ UTR) of messenger RNA (mRNA) is important for microRNA (miRNA)-mediated gene regulation in humans. mRNAs that are targeted by miRNA tend to have a higher degree of local secondary structure in their 5′ UTR; however, the general role of the 5′ UTR in miRNA-mediated gene regulation remains unknown. We systematically surveyed the secondary structure of 5′ UTRs in both plant and animal species and found a universal trend of increased mRNA stability near the 5′ cap in mRNAs that are regulated by miRNA in animals, but not in plants. Intra-genome comparison showed that gene expression level, GC content of the 5′ UTR, number of miRNA target sites, and 5′ UTR length may influence mRNA structure near the 5′ cap. Our results suggest that the 5′ UTR secondary structure performs multiple functions in regulating post-transcriptional processes. Although the local structure immediately upstream of the start codon is involved in translation initiation, RNA structure near the 5′ cap site, rather than the structure of the full-length 5′ UTR sequences, plays an important role in miRNA-mediated gene regulation.
INTRODUCTION
The 5′ untranslated region (5′ UTR) of messenger RNA (mRNA) is the sequence directly upstream of the translation start codon. Many previous studies have shown that the 5′ UTR performs an important regulatory function in post-transcriptional processes (Davuluri et al. 2000; Pickering and Willis 2005; Ringnér and Krogh 2005; Araujo et al. 2012). First, the 5′ UTR contains several regulatory elements, such as binding sites for RNA binding proteins (RBPs), upstream open reading frames (uORFs), and upstream start codons (uAUGs), which have a great impact on the regulation of translation (Araujo et al. 2012). Second, the mRNA secondary structure of the 5′ UTR has been recognized as a major feature that regulates gene translation (Pickering and Willis 2005). For example, ∼60% of 5′ UTRs in humans have structured RNAs near the 5′ cap site (Davuluri et al. 2000), which is sufficient to block translation initiation (Pickering and Willis 2005). In contrast, in yeast, the secondary structure of the 5′ UTR close to the start codon is selectively loose (Ringnér and Krogh 2005). Mutagenesis studies in both yeast (Dvir et al. 2013) and Arabidopsis thaliana (Kim et al. 2014) demonstrated that the local RNA secondary structure immediately upstream of the start codon plays a crucial role in determining translational efficiency and thus affects protein production.
Recently, several studies provided new insights into the mechanistic roles of the 5′ UTR in mRNA repression mediated by microRNAs (miRNAs) (Djuranovic et al. 2012; Meijer et al. 2013; Ricci et al. 2013). miRNAs are a class of noncoding RNAs that are 20–24 nt in length and regulate gene expression by base-pairing with complementary sequences in mRNA transcripts (Bartel 2009). The specific binding of miRNAs with their target sites results in gene silencing via translational repression and/or RNA degradation (Bartel 2009). A relationship between mRNA structure and miRNA binding has been reported in plants and animals. Decreased mRNA secondary structure was observed in the flank region of miRNA binding sites in A. thaliana (Gu et al. 2012; Li et al. 2012) and humans (Gu et al. 2013). However, Djuranovic et al. (2012) pointed out that the mRNA-miRNA interaction may affect expression of the target gene at early stages of translation, i.e., translation initiation. They found that miRNA-mediated gene silencing in Drosophila S2 cells is manifested through translational inhibition, which is followed by mRNA deadenylation and decay (Djuranovic et al. 2012). More recently, Meijer et al. confirmed that translational inhibition is the primary event required for mRNA degradation in human HeLa cells (Meijer et al. 2013). They observed that miRNAs repress gene translation by impairing the function of the eIF4F initiation complex via eIF4A2 (Meijer et al. 2013). Hence, they suggested that the mRNA secondary structure of the 5′ UTR is critical for miRNA-mediated gene silencing and that mRNAs with unstructured 5′ UTRs are resistant to miRNA repression (Meijer et al. 2013).
The studies of Djuranovic et al. and Meijer et al. (Djuranovic et al. 2012; Meijer et al. 2013; Ricci et al. 2013) hint at another dimension in the regulatory role played by 5′ UTR mRNA structure. However, the detailed relationship between 5′ UTR mRNA structure and miRNA action is largely unknown. To explore the role of 5′ UTR secondary structure in miRNA-mediated gene silencing, we systematically analyzed 5′ UTR mRNA structures in five organisms, four animals, and one plant. We addressed the following questions: (1) Is there a general trend of structured 5′ UTRs in genes with miRNA targets? (2) Does increased 5′ UTR secondary structure have selective implications for accurate miRNA action? (3) If structured 5′ UTRs are important to miRNA-mediated gene regulation, what are the factors that potentially affect mRNA structure in 5′ UTR of miRNA target genes?
RESULTS
Increased mRNA stability near the 5′ cap site in genes with miRNA target sites
We used a sliding window scheme to analyze local mRNA stability in the 5′ UTR (see Materials and Methods for details). We started from the 5′ cap site with a window of 30 nucleotides (nt) in length and moved the window toward the 3′ end of the 5′ UTR in steps of 10 nt. We calculated the local folding energy (ΔG) in 13 consecutive windows for A. thaliana, Caenorhabditis elegans, Drosophila melanogaster, Mus musculus, and Homo sapiens. A smaller ΔG value means a higher degree of local mRNA secondary structure. We categorized mRNA transcripts into two groups according to the presence or absence of miRNA target sites in the 3′ untranslated region (3′ UTR) predicted by TargetScan (Lewis et al. 2005). In the four animal species, but not the plant species, the ΔG was lower in the first three windows immediately downstream from the 5′ cap compared to the following windows, especially for genes with miRNA target sites (Fig. 1A; Supplemental Fig. S1). For individual windows, the ΔG of miRNA target genes was significantly lower than that of genes without miRNA target sites in animal species (P < 0.05 by t-test except for the tenth and eleventh windows in worm and the thirteenth window in fly) (Fig. 1A,B; Supplemental Fig. S1). Inter-species comparison indicated that the ΔG in mouse and human was significantly lower than that in worm and fly (P < 10−10 by t-test for all the windows) (Fig. 1B). In contrast, the 5′ UTR GC composition in mammals was significantly higher than that in worm and fly (P < 10−10 by t-test) (Fig. 1C).
FIGURE 1.

Increased RNA stability near the 5′ cap site in genes with miRNA target sites. (A) The mean and standard error of ΔG of each sliding window in H. sapiens. We calculated the local folding energy along the 5′ UTR sequence using a sliding window of 30 nt in length, moving from the cap site to the 121st downstream nucleotide in steps of 10 nt (for a total of 13 windows). (B) Comparison of ΔG of the second sliding window in A. thaliana, C. elegans, D. melanogaster, M. musculus, and H. sapiens. (C) Comparison of GC content of 5′ UTR in A. thaliana, C. elegans, D. melanogaster, M. musculus, and H. sapiens.
Increased mRNA structure near the 5′ cap in miRNA target genes is consistent with a selective mechanism
Although we observed increased mRNA stability near the 5′ cap in miRNA target genes in animals, it remains unclear to what extent the local folding energy deviates from random expectation given the background nucleotide composition of the 5′ UTR. If the 5′ UTR plays a vital role in miRNA-mediated gene regulation, it is reasonable to assume that increased stability of mRNA secondary structure in this region should be consistent with a selective mechanism. To quantify the selective signal of 5′ UTR mRNA secondary structure, we calculated ΔG for 1000 permutated 5′ UTR sequences. We obtained permutated sequences while preserving the di-nucleotide frequency by randomly reshuffling di-nucleotides within each 5′ UTR sequence. We then calculated a Z-score, ZΔG, by comparing the ΔG of the real mRNA segment with the distribution of ΔG values of the permutated sequences. A negative ZΔG value indicates that the structure is more stable than expected, and a positive ZΔG indicates the opposite.
We performed a sliding window analysis on ZΔG using the same scheme as for ΔG. We observed that the mean ZΔG of the genes with miRNA target sites was negative and significantly different from zero (P < 10−10 by t-test) in the first three windows for all the animal species (Fig. 2). When the window was moved downstream, the mean ZΔG value increased and a positive mean ZΔG was observed in the last three windows (Fig. 2). However, we did not find a similar trend in A. thaliana (Supplemental Fig. S2). We also compared the mean ZΔG between genes with and without miRNA target sites. In at least one of the first three windows, the mean ZΔG of the genes with target sites was significantly lower than that of genes without targets in worm, fly, and human (P < 0.05 by t-test) (Fig. 2). However, the opposite pattern was observed in the second window in mouse (Fig. 2).
FIGURE 2.

The mean and standard error of ZΔG of each sliding window. The mean ZΔG of each window is compared between genes with and without miRNA target sites in C. elegans, D. melanogaster, M. musculus, and H. sapiens. The asterisks denote a significant (P < 0.05) difference in ZΔG between genes with and without miRNA target sites.
The above ZΔG values were calculated based on permutated 5′ UTR sequences that maintained di-nucleotide composition. We also replicated our analysis by maintaining mononucleotide frequency in the randomization process. In this analysis, the trend of the mean ZΔG generated by mononucleotide shuffling was similar to, but consistently lower than, that obtained by di-nucleotide shuffling (Supplemental Fig. S3), suggesting that di-nucleotide composition in the 5′ UTR is selected to increase local mRNA stability. Because neither randomization processes changed the trend of ZΔG, we used ZΔG generated by di-nucleotide shuffling for the remainder of this study.
Because we classified mRNA transcripts by the presence or absence of miRNA target sites according to computational prediction by TargetScan (Lewis et al. 2005), it was reasonable to ask whether our results would substantially change if we applied data on experimentally identified miRNA targets. High-throughput experimental studies in humans have made large-scale miRNA targeting data available. Therefore, we repeated the above analysis by categorizing human genes into two new groups: with/without experimental evidence of miRNA functional binding. Figure 3 indicates that the mean ZΔG of genes with experimentally identified miRNA targets was significantly lower than that of genes without experimental evidence of miRNA binding in the first six windows, which largely mirrors the pattern demonstrated in Figure 2.
FIGURE 3.

Comparison of ZΔG between human genes with and without experimentally identified miRNA target sites. The error bars represent the standard errors of the sliding windows. The asterisks denote a significant (P < 0.05) difference in ZΔG between genes with and without miRNA target sites.
GC nucleotides are preferred near the 5′ cap to increase RNA stability
The above analysis suggests that there is a trend toward increased mRNA stability at the 5′ end of the 5′ UTR in miRNA target genes. Since the thermodynamic stability of RNA secondary structure is correlated with the GC content, we also investigated local deviation in GC composition. We calculated the Z-score of local GC content (ZGC), which measures the deviation of local GC content in the real 5′ UTR sequence relative to the background GC content of permutated 5′ UTR sequences (see Materials and Methods for details). A positive ZGC means that G and/or C nucleotides are preferentially used in that region. Using a sliding window analysis, we observed that the mean ZGC of genes with and without miRNA targets was positive and significantly different from zero in the first three windows for all the animals tested (P < 10−3 by t-test) (Supplemental Fig. S4). Moreover, in at least one of the first three windows, the mean ZGC of the genes with miRNA target sites was significantly higher than that of the genes without targets in all the animal species (P < 0.05 by t-test) (Supplemental Fig. S4). As expected, a significant negative correlation between ZGC and ZΔG was identified for each sliding window (P < 10−10 by the Pearson correlation test) (see Supplemental Fig. S5 for an example).
Factors shaping ZΔG in genes with miRNA targets
Although mRNA stability was increased near the 5′ cap site in all the animals at a whole genome level, there were substantial variations in ZΔG among different genes (Fig. 2). Therefore, we further investigated potential intra-genome factors that may contribute to the variations among genes with miRNA target sites. We excluded C. elegans from the intra-genome analysis because the number of miRNA target genes in this species was relatively low. Since ZΔG in the second sliding window generally showed the strongest signal of increased mRNA stability, we focused on this value for intra-genome analysis.
We first considered gene expression level. We compared the mean ZΔG between the 10% of genes with the highest expression level and the 10% with the lowest level, and we found that the mean ZΔG for the lowest-expressed genes tended to be lower than that for genes with the highest expression level. The differences in mean ZΔG were significant in fly and marginal in human (Fig. 4A). We next considered GC content of the 5′ UTR sequence. By comparing the 10% of genes with the lowest GC content and the 10% of genes with the highest GC content, we found that genes with lower GC content had significantly lower mean ZΔG (P < 10−10 by t-test) (Fig. 4B). In other words, genes with lower GC content are undergoing stronger selective pressure to increase the thermodynamic stability of mRNA secondary structure near the 5′ cap. Next, we considered the number of miRNA target sites within the gene. In fly and human, the mean ZΔG was significantly lower in genes with more miRNA target sites than in genes with fewer targets (Fig. 4C). Finally, we tested whether the length of 5′ UTR affects the mean ZΔG of the second window. When we classified the 5′ UTR as long or short using a cutoff of 150 nt, we found that the mean ZΔG of genes with a long 5′ UTR was consistently and significantly lower than that of genes with a short 5′ UTR (Fig. 4D).
FIGURE 4.

Factors affecting ZΔG near the 5′ cap site. Only genes with miRNA target sites were considered here. (A) Comparison of ZΔG of the second sliding window between the 10% of genes with the highest expression level and the 10% with the lowest expression level. (B) Comparison of ZΔG of the second sliding window between the 10% of genes with the highest GC content and the 10% with the lowest GC content. (C) Comparison of ZΔG of the second sliding window between genes with a low number (<5) and high number (≥5) of miRNA target sites. (D) Comparison of ZΔG of the second sliding window between genes with short (<150 nt) and long (≥150 nt) 5′ UTR. The error bars represent the standard errors, and the asterisks denote a significant (P < 0.05) difference in ZΔG between two groups.
DISCUSSION
We investigated the role of 5′ UTR mRNA structure in miRNA-mediated gene regulation in several model organisms using computational methods. Instead of examining the secondary structure of the full-length 5′ UTR, we used a sliding window scheme in our analysis. We found that mRNA secondary structure near the 5′ cap, rather than the secondary structure of the full-length 5′ UTR sequence, is increased to facilitate miRNA-mediated gene regulation in animals (Figs. 1A, 2; Supplemental Fig. S1). The region of 30–50 nt downstream from the 5′ cap is known to be bound by a 40S ribosomal subunit during formation of the 43S pre-initiation complex (Araujo et al. 2012), and this process initiates cap-dependent gene translation. Recently published studies suggest that miRNAs repress gene translation by impairing the function of the pre-initiation complex (Meijer et al. 2013; Ricci et al. 2013). It was also proposed that mRNAs with miRNA target sites in their 3′ UTR are selected to have a greater degree of secondary structure in the 5′ UTR (Meijer et al. 2013); however, our results suggest that increased structure in the 5′ UTR is regional and only the region close to the 5′ cap has a high-degree secondary structure. The increase of RNA stability shows the strongest signal in the second sliding window (11–40 nt), which partly overlaps with the 40S ribosomal subunit binding area. As the sliding window moves downstream toward the start codon, the mean ZΔG increases from negative to positive (Fig. 2), which means the direction of selection is reversed from being for a stable local mRNA structure to being against a stable structure. The positive ZΔG in the windows near the 3′ end of the 5′ UTR indicates that decreased mRNA stability is favored near the start codon. This is compatible with previous findings that the 5′ UTR sequence near the start codon is significantly more unstructured than randomized sequences and other genomic regions (de Smit and van Duin 1990; Ringnér and Krogh 2005; Kudla et al. 2009; Gu et al. 2010; Goodman et al. 2013; Kim et al. 2014). Several recent experimental studies have confirmed the importance of reduced mRNA stability in the region near the start codon in the regulation of translation initiation and final gene expression (Dvir et al. 2013; Kim et al. 2014). Hence, we suggest that the 5′ UTR mRNA structure plays multiple roles in regulating post-transcriptional processes and that local mRNA secondary structure near the 5′ cap site, but not the structure of the full-length 5′ UTR, plays an important role in miRNA-mediated gene regulation.
Our results showed a universal trend of increased mRNA stability near the 5′ cap in genes with miRNA targets in animal species. However, this was not the case for the plant species, A. thaliana. Since there is an obvious difference in miRNA regulatory mechanisms between animals and plants (Axtell et al. 2011; Iwakawa and Tomari 2013; Rogers and Chen 2013), it is reasonable to expect different patterns of 5′ UTR mRNA stability. Animals and plants also differ in the mechanism of translation initiation (Hinnebusch and Lorsch 2012), which may also partially explain why we did not observe increased RNA stability near the 5′ cap site in A. thaliana.
We observed that G and/or C nucleotides are preferentially used near the 5′ cap site (Supplemental Fig. S4). It is well known that the three hydrogen bonds in G-C base-pairing are stronger than the hydrogen bonding in A-T pairs. Therefore, a higher proportion of G and C nucleotides near the 5′ cap site will potentially increase the local mRNA stability and thus facilitate the process of miRNA-mediated gene regulation. Although RNA stability near the 5′ cap site is universally increased in all animals, the absolute value of folding energy in this region is significantly different among species (Fig. 1B). The structural stability of this region is lowest in worm and highest in mammals (mouse and human) (Fig. 1B), suggesting that mRNA stability near the 5′ cap site gradually increased through the history of animal evolution. The gradual increment in GC content near the cap site in these four species (Fig. 1C) supports this hypothesis. Nevertheless, more studies are needed to clarify the issue.
It is worth noting that, at least in the first three sliding windows, the mean ZΔG of genes without miRNA target sites is significantly negative in fly, mouse, and human (Fig. 2), meaning that mRNA stability near the 5′ cap site is also increased for genes that are not regulated by miRNAs. If increased mRNA structure near the 5′ cap is only important to proper miRNA function, the mean ZΔG of the genes without a miRNA target should be close to zero, as we observed in worm (Fig. 2). The reason for increased mRNA stability at the region close to the 5′ cap in genes without a miRNA target is unknown. One possible explanation is the dynamic gain and loss of miRNA target sites during animal evolution (Tang et al. 2010; Xu et al. 2013). Given the importance of mRNA secondary structure in miRNA-mediated gene regulation, the sequence of the 5′ end of 5′ UTRs should be strongly selected for increased mRNA stability when miRNA target sites newly occur in the 3′ UTR. In contrast, when a conserved miRNA target site is lost in a specific lineage, it might still be possible to observe the increased mRNA stability near the cap site. Another possibility is that our current knowledge of miRNA target genes is far from complete. We collected miRNA target sites using in silico prediction; however, current computational tools and experimental studies must miss many genes that are targeted by miRNAs (Hsu et al. 2011; Liu et al. 2012). Incomplete data on miRNA targets may lead to a signal of increased mRNA stability in genes that are incorrectly assumed to lack miRNA target sites.
We observed a decreased mean ZΔG of the second sliding window in genes that were expressed at a low level in fly (Fig. 4A). Since miRNAs mainly repress expression of their target gene (Bartel 2009), the low expression level of genes with target sites is most likely caused by functional miRNA action. Thus, it is reasonable to see a stronger signal in genes with a low expression level. However, in mammalian genes, we did not see a significant difference in the mean ZΔG of the second sliding window between genes with high and low expression (Fig. 4A). We estimated the gene expression level by the geometric mean of expression among different tissues, which may blur the signal in mammals. In future studies, it will be interesting to look into the relationship between tissue-specific expression and miRNA-mediated gene regulation.
We found that a lower GC content of the 5′ UTR was associated with a greater increase in mRNA stability near the 5′ cap (Fig. 4B). GC-poor RNAs tend to fold into less stable structures than AU-poor RNAs. The loose secondary structure in GC-poor 5′ UTRs may not be enough to block translation initiation; therefore, more G and C nucleotides should be used near the cap site in GC-poor 5′ UTRs to strengthen the local mRNA structure. We also found that the mean ZΔG near the 5′ cap of genes with more target sites is significantly lower than that of genes with fewer target sites (Fig. 4C). This suggests that the mRNA structure near the cap site becomes more important with an increase in the number of miRNA target sites.
The length of the 5′ UTR also affects mRNA stability near the cap site; miRNA target genes with a long 5′ UTR tend to have more structured RNA near the cap site than those with a short 5′ UTR (Fig. 4D). This is consistent with some previous observations (Araujo et al. 2012) but somewhat different from the results presented by Meijer et al. (2013), who found a stronger relationship between 5′ UTR mRNA structure and the presence of miRNA target sites in genes with short 5′ UTRs. There are two possible explanations for the different observations: First, we focused on the local mRNA structure near the cap site, rather than the full-length 5′ UTR structure, and second, we used ZΔG, instead of ΔG, when estimating the importance of mRNA structure in miRNA-mediated gene regulation.
In conclusion, we conducted a systematic analysis of RNA structure of the 5′ UTR and demonstrated the important role of mRNA structure near the cap site for miRNA action. These results will be helpful in understanding the precise mechanism of miRNA-mediated gene regulation and the role of RNA structure in post-transcriptional gene regulation.
MATERIALS AND METHODS
Data
We downloaded 5′ UTR sequences of each mRNA transcript from Ensembl BioMart for A. thaliana, C. elegans, D. melanogaster, M. musculus, and H. sapiens (Kinsella et al. 2011). We obtained human miRNA-mRNA interaction data that were validated experimentally by reporter assay, blotting methods, microarray, and next-generation sequencing-based experiments (CLIP-seq, Degradome-seq, CLASH-seq, etc.) from TarBase (http://diana.imis.athenainnovation.gr/DianaTools/, version 6.0) (Vergoulis et al. 2012), miRTarBase (http://mirtarbase.mbc.nctu.edu.tw/) (Hsu et al. 2011), StarBase (http://starbase.sysu.edu.cn/) (Yang et al. 2011), and MirRecords (http://mirecords.biolead.org) (Xiao et al. 2009), respectively. We also downloaded computationally predicted miRNA targets in C. elegans, D. melanogaster, M. musculus, and H. sapiens from TargetScan (http://www.targetscan.org, version 6.2) (Lewis et al. 2005). Data on miRNA targets in A. thaliana were obtained from psRNATarget (http://plantgrn.noble.org/psRNATarget/) (Dai and Zhao 2011). The Gene ID Conversion Tool (http://david.abcc.ncifcrf.gov/conversion.jsp) (Huang da et al. 2009) was used to transform all gene IDs to Ensembl Gene ID. We integrated all the miRNA targeting data from various resources with customized Perl scripts.
All expression data were obtained from previously published studies. The gene expression level in fly was measured as the geometric mean of expression in different tissues obtained from Stolc et al. (2004). For mouse and human, we measured the expression level as the geometric mean of expression from different tissues downloaded from Su et al. (2004).
Secondary structure of 5′ UTR sequences
RNA folding energy was calculated using the RNAfold program in the ViennaRNA package (Lorenz et al. 2011) with default parameter settings. Only minimum free-energy structure was evaluated, and ΔG defines the change of sequence in free energy from the natural unfolded state to the secondary structure.
5′ UTR randomization and Z-score calculation
If selection pressure influences mRNA folding in the 5′ UTR, on average the secondary structure of native sequences in the 5′ UTR should be more stable than that of randomly permutated sequences. We randomly reshuffled nucleotides in the 5′ UTR sequence of each gene to control for the mononucleotide frequency or di-nucleotide frequency. The reshuffling process was repeated to obtain 1000 permutated artificial sequences for each gene. Local 5′ UTR folding energies for the native sequence and each permutated sequence were calculated in a sliding window of 30 nt with a step of 10 nt. The deviation of the native sequence from the permutated ones was determined by calculating the Z-score of the local 5′ UTR stability (ZΔG) for each sliding window (Gu et al. 2010) by
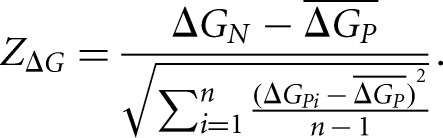 |
Here, ΔGN is the folding free energy for the native sequence in the window under consideration, ΔGPi is the folding free energy of the corresponding window of the ith permutated sequence, and  is the mean of ΔGPi over all permutated sequences. The variable n represents the total number of permutated sequences; in this case, n = 1000.
Similarly, the difference between the local 5′ UTR GC composition of the native sequence and the permutated sequences was evaluated. The Z-score of local 5′ UTR GC content (ZGC) for each window can be expressed as
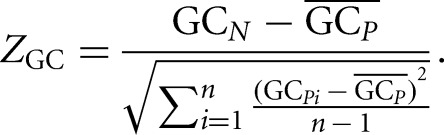 |
The definitions for GCN, GCPi, and  are analogous to ΔGN, ΔGPi, and
  but refer to GC content instead of folding energy.
SUPPLEMENTAL MATERIAL
Supplemental material is available for this article.
Supplementary Material
ACKNOWLEDGMENTS
This work was supported by the National Basic Research Program of China (2012CB316501 to W.G.), the National High Technology Research and Development Program of China (2012AA020401 to W.G.), National Natural Science Foundation of China (61171143 to W.G., 61372164 to X.X.), and the Tsinghua National Laboratory for Information Science and Technology (TNList) Cross-Discipline Foundation. This work was also supported by the Korea Research Foundation Grant funded by the Korean Government (MOEHRD, Basic Research Promotion Fund) (KRF-2011-0016587 to J.H.K.).
Footnotes
Article published online ahead of print. Article and publication date are at http://www.rnajournal.org/cgi/doi/10.1261/rna.044792.114.
REFERENCES
- Araujo PR, Yoon K, Ko D, Smith AD, Qiao M, Suresh U, Burns SC, Penalva LOF 2012. Before it gets started: regulating translation at the 5′ UTR. Comp Funct Genomics 2012: 475731. [DOI] [PMC free article] [PubMed] [Google Scholar]
- Axtell MJ, Westholm JO, Lai EC 2011. Vive la différence: biogenesis and evolution of microRNAs in plants and animals. Genome Biol 12: 221. [DOI] [PMC free article] [PubMed] [Google Scholar]
- Bartel DP 2009. MicroRNAs: target recognition and regulatory functions. Cell 136: 215–233 [DOI] [PMC free article] [PubMed] [Google Scholar]
- Dai X, Zhao PX 2011. psRNATarget: a plant small RNA target analysis server. Nucleic Acids Res 39: W155–W159 [DOI] [PMC free article] [PubMed] [Google Scholar]
- Davuluri RV, Suzuki Y, Sugano S, Zhang MQ 2000. CART classification of human 5′ UTR sequences. Genome Res 10: 1807–1816 [DOI] [PMC free article] [PubMed] [Google Scholar]
- de Smit MH, van Duin J 1990. Secondary structure of the ribosome binding site determines translational efficiency: a quantitative analysis. Proc Natl Acad Sci 87: 7668–7672 [DOI] [PMC free article] [PubMed] [Google Scholar]
- Djuranovic S, Nahvi A, Green R 2012. miRNA-mediated gene silencing by translational repression followed by mRNA deadenylation and decay. Science 336: 237–240 [DOI] [PMC free article] [PubMed] [Google Scholar]
- Dvir S, Velten L, Sharon E, Zeevi D, Carey LB, Weinberger A, Segal E 2013. Deciphering the rules by which 5′-UTR sequences affect protein expression in yeast. Proc Natl Acad Sci 110: E2792–E2801 [DOI] [PMC free article] [PubMed] [Google Scholar]
- Goodman DB, Church GM, Kosuri S 2013. Causes and effects of N-terminal codon bias in bacterial genes. Science 342: 475–479 [DOI] [PubMed] [Google Scholar]
- Gu W, Zhou T, Wilke CO 2010. A universal trend of reduced mRNA stability near the translation-initiation site in prokaryotes and eukaryotes. PLoS Comput Biol 6: e1000664. [DOI] [PMC free article] [PubMed] [Google Scholar]
- Gu W, Wang X, Zhai C, Xie X, Zhou T 2012. Selection on synonymous sites for increased accessibility around miRNA binding sites in plants. Mol Biol Evol 29: 3037–3044 [DOI] [PubMed] [Google Scholar]
- Gu W, Wang X, Zhai C, Zhou T, Xie X 2013. Biological basis of miRNA action when their targets are located in human protein coding region. PLoS One 8: e63403. [DOI] [PMC free article] [PubMed] [Google Scholar]
- Hinnebusch AG, Lorsch JR 2012. The mechanism of eukaryotic translation initiation: new insights and challenges. Cold Spring Harb Perspect Biol 4: a011544. [DOI] [PMC free article] [PubMed] [Google Scholar]
- Hsu SD, Lin FM, Wu WY, Liang C, Huang WC, Chan WL, Tsai WT, Chen GZ, Lee CJ, Chiu CM, et al. 2011. miRTarBase: a database curates experimentally validated microRNA-target interactions. Nucleic Acids Res 39: D163–D169 [DOI] [PMC free article] [PubMed] [Google Scholar]
- Huang da W, Sherman BT, Lempicki RA 2009. Systematic and integrative analysis of large gene lists using DAVID bioinformatics resources. Nat Protoc 4: 44–57 [DOI] [PubMed] [Google Scholar]
- Iwakawa HO, Tomari Y 2013. Molecular insights into microRNA-mediated translational repression in plants. Mol Cell 52: 591–601 [DOI] [PubMed] [Google Scholar]
- Kim Y, Lee G, Jeon E, Sohn EJ, Lee Y, Kang H, Lee DW, Kim DH, Hwang I 2014. The immediate upstream region of the 5′-UTR from the AUG start codon has a pronounced effect on the translational efficiency in Arabidopsis thaliana. Nucleic Acids Res 42: 485–498 [DOI] [PMC free article] [PubMed] [Google Scholar]
- Kinsella RJ, Kahari A, Haider S, Zamora J, Proctor G, Spudich G, Almeida-King J, Staines D, Derwent P, Kerhornou A, et al. 2011. Ensembl BioMarts: a hub for data retrieval across taxonomic space. Database (Oxford) 2011: bar030. [DOI] [PMC free article] [PubMed] [Google Scholar]
- Kudla G, Murray AW, Tollervey D, Plotkin JB 2009. Coding-sequence determinants of gene expression in Escherichia coli. Science 324: 255–258 [DOI] [PMC free article] [PubMed] [Google Scholar]
- Lewis BP, Burge CB, Bartel DP 2005. Conserved seed pairing, often flanked by adenosines, indicates that thousands of human genes are microRNA targets. Cell 120: 15–20 [DOI] [PubMed] [Google Scholar]
- Li F, Zheng Q, Vandivier LE, Willmann MR, Chen Y, Gregory BD 2012. Regulatory impact of RNA secondary structure across the Arabidopsis transcriptome. Plant Cell 24: 4346–4359 [DOI] [PMC free article] [PubMed] [Google Scholar]
- Liu B, Li J, Cairns MJ 2012. Identifying miRNAs, targets and functions. Brief Bioinform 15: 1–19 [DOI] [PMC free article] [PubMed] [Google Scholar]
- Lorenz R, Bernhart SH, Honer Zu Siederdissen C, Tafer H, Flamm C, Stadler PF, Hofacker IL 2011. ViennaRNA Package 2.0. Algorithms Mol Biol 6: 26. [DOI] [PMC free article] [PubMed] [Google Scholar]
- Meijer HA, Kong YW, Lu WT, Wilczynska A, Spriggs RV, Robinson SW, Godfrey JD, Willis AE, Bushell M 2013. Translational repression and eIF4A2 activity are critical for microRNA-mediated gene regulation. Science 340: 82–85 [DOI] [PubMed] [Google Scholar]
- Pickering BM, Willis AE 2005. The implications of structured 5′ untranslated regions on translation and disease. Semin Cell Dev Biol 16: 39–47 [DOI] [PubMed] [Google Scholar]
- Ricci EP, Limousin T, Soto-Rifo R, Rubilar PS, Decimo D, Ohlmann T 2013. miRNA repression of translation in vitro takes place during 43S ribosomal scanning. Nucleic Acids Res 41: 586–598 [DOI] [PMC free article] [PubMed] [Google Scholar]
- Ringnér M, Krogh M 2005. Folding free energies of 5′-UTRs impact post-transcriptional regulation on a genomic scale in yeast. PLoS Comput Biol 1: e72. [DOI] [PMC free article] [PubMed] [Google Scholar]
- Rogers K, Chen X 2013. Biogenesis, turnover, and mode of action of plant microRNAs. Plant Cell 25: 2383–2399 [DOI] [PMC free article] [PubMed] [Google Scholar]
- Stolc V, Gauhar Z, Mason C, Halasz G, van Batenburg MF, Rifkin SA, Hua S, Herreman T, Tongprasit W, Barbano PE, et al. 2004. A gene expression map for the euchromatic genome of Drosophila melanogaster. Science 306: 655–660 [DOI] [PubMed] [Google Scholar]
- Su AI, Wiltshire T, Batalov S, Lapp H, Ching KA, Block D, Zhang J, Soden R, Hayakawa M, Kreiman G, et al. 2004. A gene atlas of the mouse and human protein-encoding transcriptomes. Proc Natl Acad Sci 101: 6062–6067 [DOI] [PMC free article] [PubMed] [Google Scholar]
- Tang T, Kumar S, Shen Y, Lu J, Wu M-L, Shi S, Li W-H, Wu C-I 2010. Adverse interactions between micro-RNAs and target genes from different species. Proc Natl Acad Sci 107: 12935–12940 [DOI] [PMC free article] [PubMed] [Google Scholar]
- Vergoulis T, Vlachos IS, Alexiou P, Georgakilas G, Maragkakis M, Reczko M, Gerangelos S, Koziris N, Dalamagas T, Hatzigeorgiou AG 2012. TarBase 6.0: capturing the exponential growth of miRNA targets with experimental support. Nucleic Acids Res 40: D222–D229 [DOI] [PMC free article] [PubMed] [Google Scholar]
- Xiao F, Zuo Z, Cai G, Kang S, Gao X, Li T 2009. miRecords: an integrated resource for microRNA-target interactions. Nucleic Acids Res 37: D105–D110 [DOI] [PMC free article] [PubMed] [Google Scholar]
- Xu J, Zhang R, Shen Y, Liu G, Lu X, Wu C-I 2013. The evolution of evolvability in microRNA target sites in vertebrates. Genome Res 23: 1810–1816 [DOI] [PMC free article] [PubMed] [Google Scholar]
- Yang JH, Li JH, Shao P, Zhou H, Chen YQ, Qu LH 2011. starBase: a database for exploring microRNA-mRNA interaction maps from Argonaute CLIP-Seq and Degradome-Seq data. Nucleic Acids Res 39: D202–D209 [DOI] [PMC free article] [PubMed] [Google Scholar]
Associated Data
This section collects any data citations, data availability statements, or supplementary materials included in this article.