

Abstract
The olfactory bulb (OB) and piriform cortex receive dense cholinergic projections from the basal forebrain. Cholinergic modulation within the piriform cortex has long been proposed to serve important functions in olfactory learning and memory. We here investigate how olfactory discrimination learning is regulated by cholinergic modulation of the OB inputs to the piriform cortex. We examined rats' performance on a two-alternative choice odor discrimination task following local, bilateral blockade of cholinergic nicotinic and/or muscarinic receptors in the OB. Results demonstrate that acquisition, but not recall, of novel discrimination problems is impaired following blockade of OB cholinergic receptors, although the relative contribution of muscarinic and nicotinic receptors depends on task difficulty. Blocking muscarinic receptors impairs learning for nearly all odor sets, whereas blocking nicotinic receptors only affects performance for perceptually similar odors. This pattern of behavioral effects is consistent with predictions from a model of cholinergic modulation in the OB and piriform cortex (de Almeida et al., 2013). Model simulations suggest that muscarinic and nicotinic receptors may serve complementary roles in regulating coherence and sparseness of the OB network output, which in turn differentially regulate the strength and overlap in cortical odor representations. Overall, our results suggest that muscarinic receptor blockade results in a bona fide learning impairment that may arise because cortical neurons are activated less often. Behavioral impairment following nicotinic receptor blockade may not be due to the inability of the cortex to learn, but rather arises because the cortex is unable to resolve highly overlapping input patterns.
Keywords: acetylcholine, cholinergic neuromodulation, olfactory bulb, olfactory cortex, rodent behavior
Introduction
As early as the first synapse in the rodent olfactory bulb (OB), ascending signals from olfactory sensory neurons are integrated with centrifugal projections from cortex and subcortical neuromodulatory inputs (Halász and Shepherd, 1983; Shipley and Ennis, 1996; Cleland and Linster, 2003). In particular, the OB is the recipient of dense cholinergic projections from the horizontal limb of the diagonal band of Broca (Macrides et al., 1981; Záborszky et al., 1986). Cholinergic modulation of cortical circuits has long been associated with attentional and top-down processing and is thought to play a critical role in learning and memory (Hasselmo et al., 1992; Sarter and Bruno, 1997; Yu and Dayan, 2005; Hasselmo and Giocomo, 2006).
A growing body of research has elucidated the cellular effects of cholinergic modulation in the OB, which are mediated by both nicotinic and muscarinic receptors (Castillo et al., 1999; Ghatpande et al., 2006; Pressler et al., 2007; D'Souza and Vijayaraghavan, 2012). In the glomerular layer of the OB, activation of nicotinic receptors regulates the excitability of inhibitory periglomerular cells (Ravel et al., 1990; Castillo et al., 1999) and enhances the contrast in bulbar activation patterns, i.e., determines which mitral (Mi) cells are responsive to a given odorant (Mandairon et al., 2006b; Chaudhury et al., 2009). Behaviorally, blockade of nicotinic receptors in the OB impairs olfactory discrimination of chemically similar odorants, but does not affect discrimination of dissimilar odorants; these effects can be predicted in a straightforward manner from changes in bulbar activation patterns (Mandairon et al., 2006b).
In the deeper layers of the bulb, muscarinic receptors are thought to regulate spike timing and synchronization of Mi cells (Li and Cleland, 2013) by depolarizing granule cells (Castillo et al., 1999) and transforming afterhyperpolarization into afterdepolarization (Pressler et al., 2007). These effects could serve to regulate odor processing in cortical networks, which are sensitive to the timing of Mi cell inputs (Haddad et al., 2013). Although previous observations suggest that muscarinic receptor modulation is important during olfactory tasks that require odors to be remembered across short time delays (Ravel et al., 1994; Devore et al., 2012), we currently lack a mechanistic understanding of how these behavioral consequences arise from these changes in the OB network output.
Here, we used a combination of behavioral pharmacology and computational modeling to investigate the role of bulbar nicotinic and muscarinic receptors in olfactory discrimination learning in rats (Fig. 1). We found that acquisition of novel odor discrimination problems generally required bulbar muscarinic receptors, whereas nicotinic receptors only affected discrimination between odors eliciting a high degree of perceptual overlap. To understand the neural basis of the behavioral impairments, we simulated the task using a recently developed model of cholinergic modulation in the OB and piriform cortex (de Almeida et al., 2013). Modeling results suggest that behavioral discrimination of odors is directly related to the Euclidean distance between their cortical representations (Gire et al., 2013) and that bulbar nicotinic and muscarinic receptors can control this distance by independently regulating the specificity and strength of the cortical odor representations, respectively.
Figure 1.

Experimental and computational experiments. A, Behavioral experiments. Rats are trained using an operant conditioning paradigm to discriminate between two novel odorants. Both odorants are rewarded and rats learn to associate the odorants with spatially separated reward ports. Learning is assessed by measuring the percentage correct performance for five consecutive (daily) sessions consisting of 200 trials each. Cholinergic modulation in the OB is manipulated by directly infusing antagonists bilaterally into the OBs. B, Simulations. To simulate odor discrimination learning, the OB and cortical network model is presented with a pair of odorants over a sequence of five training sessions. Olfactory information is presented to the bulbar network [olfactory sensory neuron (OSN) activation pattern], transformed and processed by the OB network and projected to the cortical network. The cortical representations are rendered more distinct during learning via plasticity at associational synapses, simulating behavioral discrimination learning. Manipulations of cholinergic modulation in the OB are simulated by changing OB network parameters. Learning is measured as the change in distance between cortical odor representations across training sessions. Heat maps show simulated average firing rates in the model represented in a 10 × 10 matrix, with warmer colors representing higher rates.
Materials and Methods
Subjects
Seventeen adult male Long–Evans rats initially weighing 250–300 g were obtained from Charles River Laboratory. Rats were housed individually in standard laboratory cages on a 12 h reversed light/dark cycle (lights on at 9:00 P.M.), with behavioral testing occurring during their dark phase. Rats were given unlimited access to water but were food deprived to maintain bodyweight at 85% of their ad libitum-feeding weight. All procedures were approved by the Cornell University Institutional Animal Care and Use Committee.
Surgery
Indwelling guide cannulae (22 gauge; Plastics One) were implanted bilaterally into the OBs as described previously (Devore et al., 2012). Briefly, under aseptic conditions, rats were anesthetized with isoflurane (5% saturated vapor) and mounted in a stereotax. Anesthesia was maintained throughout the surgical procedures with isoflurane at 1–3% saturated vapor. After exposing the skull and clearing overlying tissues, a small craniotomy was made over each OB (anteroposterior, +8 mm; mediolateral, ±1.9 mm). Guide cannulae were lowered to a depth of 4.0 mm relative to bregma, just dorsal of the target infusion site, and secured to the skull using stainless-steel bone screws and dental acrylic (Fig. 2). Dummy cannulae, cut to extend 1 mm beyond the end of the guide tubes, were fixed in place except during infusions to prevent blockage or infection. Rats were given unlimited access to food for 1 week following surgery and were then returned to a food-deprivation schedule in preparation for behavioral testing.
Figure 2.
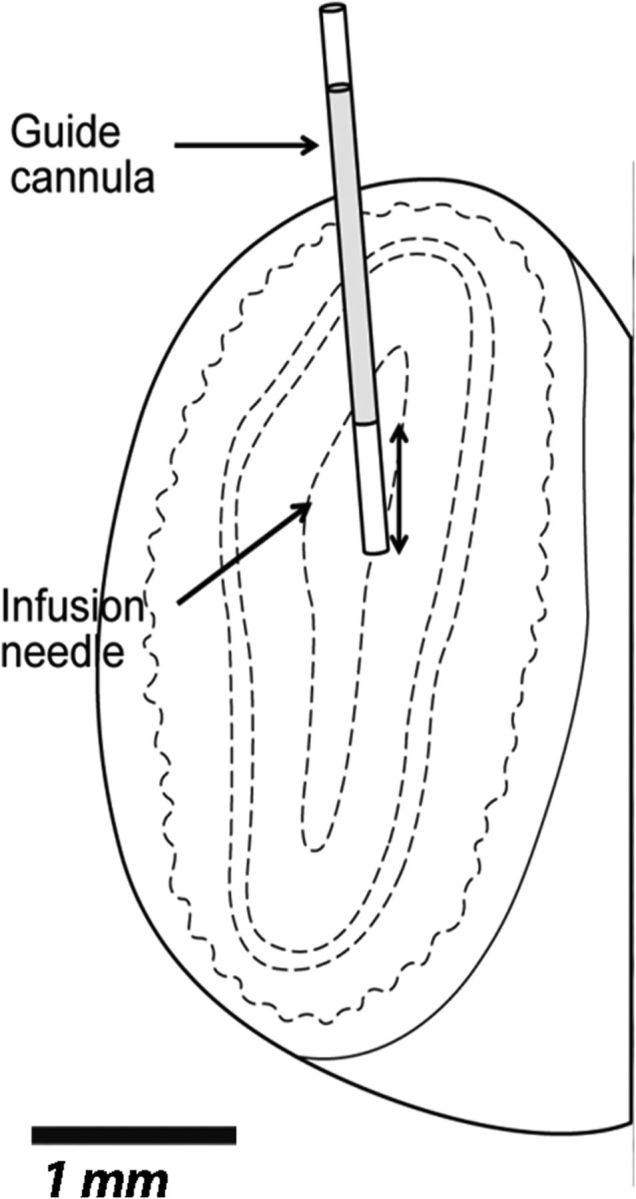
Cannulae placement. Coronal section through the OB illustrating placement of guide cannula and infusion needle.
Odorants
To vary the difficulty of the olfactory discrimination task, we asked rats to discriminate between pairs of chemically unrelated monomolecular odorants (Table 1, training sets 1–3, testing sets 1–8) or binary mixtures of chemically related monomolecular odorants in the ratios of 1:3 and 3:1 (Table 1, testing sets 9–13). All pure odorants were obtained from Sigma-Aldrich and were diluted in mineral oil so as to theoretically emit a steady-state vapor-phase partial pressure of 3 Pa (Cleland et al., 2002); the corresponding percentage liquid volume dilutions can be found in Table 1.
Table 1.
List of odorants used in behavioral experimentsa
| ID | Odor 1 | Percentage volume/volume concentration | Odor 2 | Percentage volume/volume concentration |
|---|---|---|---|---|
| 1 | acetic acid | 0.0078 | pentyl butyrate | 0.0572 |
| 2 | butyl hexanoate | 1.627 | 1,8-cineole | 0.195 |
| 3 | furfuryl propionate | 0.6512 | propanol | 0.00553 |
| 4 | methyl valerate | 0.0228 | 2-pentanone | 0.0054 |
| 5 | Citronellal | 1.658 | butyl propionate | 0.0604 |
| 6 | 2-furyl methyl ketone | 0.259 | heptanal | 0.0707 |
| 7 | Heptanol | 0.838 | ethyl acetate | 0.00169 |
| 8 | n-propyl acetate | 0.00627 | methyl 2-furoate | 0.247 |
| 9 | butanol/hexanol (3:1) | 0.0156/0.0638 | butanol/hexanol (1:3) | 0.0052/0.191 |
| 10 | hexanal/octanal (3:1) | 0.0166/0.036 | hexanal/octanal (1:3) | 0.0055/0.11 |
| 11 | butyl acetate/hexyl acetate (3:1) | 0.0164/0.057 | butyl acetate/hexyl acetate (1:3) | 0.0055/0.177 |
| 12 | hexanoic acid/octanoic acid (3:1) | 1.116/3.75 | hexanoic acid/octanoic acid (1:3) | 0.372/10.305 |
| 13 | ethyl pentanoate/butyl pentanoate (3:1) | 0.0449/0.429 | ethyl pentanoate/butyl pentanoate (1:3) | 0.01495/0.143 |
aOdorant ID corresponds to identifiers shown in Figure 5. All odorants were diluted in mineral oil to theoretically emit a vapor-phase partial pressure of 3 Pa (Cleland et al., 2002); the resulting percentage volume/volume concentrations are listed. Odor sets 9–13 consisted of binary mixtures of two odorants, as listed.
Behavior apparatus and training
All behavioral training and testing took place in an operant chamber (Coulbourn Instruments). House lights, located on the rear wall of the chamber, were illuminated to indicate the start of a new trial. Rats were trained to poke their nose into an odor port located centrally in the front wall of the chamber and hold for at least 300 ms (Fig. 1A). An infrared photobeam detected entry into the nose port and triggered delivery of one of two pseudorandomly selected odors. Odor delivery was controlled by a computer-controlled olfactometer controlling a series of solenoid valves (NResearch). Odors were generated by bubbling charcoal-filtered air (1 L/min) through glass vials containing pure odorants diluted in mineral oil (Table 1). The odor stimulus turned off when the rat withdrew from the nose port or after 1500 ms if the rat remained in the nose port for extended periods of time. Rats were trained to respond to the odor stimulus by poking into one of two reward ports based on the odor identity (Fig. 1A). Correct responses, defined as a poke into the correct reward port within 8 s of odor termination, resulted in delivery of a 45 mg sucrose pellet (BioServe) followed by chamber lights extinguishing for 3 s; incorrect or incomplete responses resulted in extinguishing of chamber lights for 6 s. All hardware events were controlled using custom-written Labview (National Instruments) routines.
Before surgical implantation of cannulae, rats were trained to perform the task using three training odor sets (Table 1). Rats were trained on multiple odor sets to promote rule learning, as opposed to rote learning of a specific odor pair (Jennings and Keefer, 1969). Training on an individual odor set was considered complete when rats achieved ≥70% correct trials across the session for two consecutive sessions. Following the surgical recovery period, rats were retrained on the same three training odor sets before commencing experimental sessions.
Pharmacology
We used cholinergic antagonists selective for either nicotinic or muscarinic receptors to determine the role of each receptor type in task performance (Ravel et al., 1994; Mandairon et al., 2006b; Chaudhury et al., 2009). Rats were tested using each antagonist separately, with a mixture of both antagonists, or with 0.9% sterile saline as a vehicle control. Specifically, the following drugs/dosages were used: the nonselective muscarinic antagonist scopolamine hydrobromide (22 mm and 4.4 mm; Sigma-Aldrich) and the selective nicotinic antagonist methyllycaconitine citrate hydrate (MLA; 19.0 and 3.6 mm; Tocris Bioscience). Dosages were chosen based on previous studies of cholinergic modulation of OB (Mandairon et al., 2006b; Devore et al., 2012). Drugs were prepared weekly by dissolving in 0.9% sterile saline and stored in small aliquots for daily use.
Before each experimental session, animals received bilateral drug or vehicle infusions at a rate of 2 μl/min for a total infusion volume of 6 μl/bulb (for both single and combination of drugs), which has been shown to result in sufficient diffusion within but not outside the OB (Mandairon et al., 2006b). The infusion cannulae were kept in place for ≥1 min after the infusion ended to prevent backflow. Behavioral testing commenced 20 min after drug administration was complete.
Experimental design
Acquisition.
During each week of experimental testing, rats performed 200 trials per day for 5 consecutive days using the same novel odor set for all 5 d. To determine the role of bulbar cholinergic processing in acquisition of novel odor discrimination, we infused the same drug (or vehicle) for each of the 5 consecutive testing days with each odor pair. We tested muscarinic (scopolamine, 22 mm) and nicotinic (MLA, 19 mm) blockade separately, as well as in combination at the same dosages. The order in which rats experienced the different drug treatments was approximately counter-balanced across subjects. Nine rats participated in the acquisition task: four rats completed 8 weeks of behavioral testing (2 weeks for each of the drug conditions) and five rats completed 4 weeks of testing (1 week for each of the drug conditions). Each of the 13 odor sets listed in Table 2 was tested once in each of the four main drug conditions. Odor sets were pseudorandomly assigned such that no two animals experienced an odor set–drug combination twice; rats were tested on one novel odor set under each drug condition.
Table 2.
Model parameters
| Mi output | |
| ACh ON | f = 36, δ = 20, A = 4.5, r = 132 |
| ACh ON, Mu OFF | f = 36, δ = 3.2, A = 4.5, r = 144 |
| ACh ON, Ni OFF | f = 36, δ = 23, A = 10.5, r = 29 |
| ACh OFF | f = 30, δ = 3.7, A = 10.3, r = 33 |
| Piriform cortex network | |
| General parameters (all neurons) | vhyper = −10mV; θmin = −2mV; trefrac = 2 ms |
| Pyr cell | τ = 10 ms; β = 10; θmax = 17 mV |
| Ff cell | τ = 5 ms; β = 5; θmax = 17 mV |
| Fb cell | τ = 5 ms; β = 5; θmax = 17 mV |
| Mi cell to Pyr cell | gmax = 0.6; EN = +70 mV; τ1 = 1 ms; τ2 = 2 ms; Conn = 0.2 |
| Mi cell to Ff cell | gmax = 2.4; EN = +70 mV; τ1 = 1 ms; τ2 = 2 ms; Conn = 0.4 |
| Ff inhibition (Pyr cell) | gmax = 0.08; EN = −10mV; τ1 = 4 ms; τ2 = 8 ms; Conn = 0.3 |
| Fb inhibition (Pyr cell) | gmax = 0.8; EN = −10mV; τ1 = 4 ms; τ2 = 8 ms; Conn = 0.4 |
| Pyr cell association fibers | gmax = 8.0 3.2*; EN = +70mV; τ1 = 1 ms; τ2 = 2 ms; Conn = 0.2 |
| Pyr adaptation (ahc) | Aahc = 160 10*; EN = −20 mV; τahc = 20 ms |
| Pyr to Fb cell | gmax = 0.8; EN = +70 mV; τ1 = 1 ms; τ2 = 2 ms; Conn = 0.2 |
*Different weights are without with cholinergic modulation, respectively.
Control tasks.
(1) To determine whether the dosages of drugs chosen were excessive, we tested six rats for 1 week in the acquisition task after infusing the combination drug mixture at 20% of the original concentration (scopolamine, 4.4 mm; MLA, 3.6 mm). (2) To ensure that rats were not using nonodor information (such as auditory cues from the solenoid valves) to solve the task, we tested six rats in the acquisition task for five consecutive sessions using identical odors [(+)-limonene, 0.2% dilution in mineral oil] loaded into different ports in the olfactometer. (3) To test whether cholinergic receptor blockade affected odor perception in general rather than acquisition in particular, we trained rats for 4 d with saline infusions and tested under drug conditions on day 5.
Data analysis
Data analysis was performed using custom scripts written in Matlab (The Mathworks) and SPSS statistical software (SPSS). Performance was assessed by computing the fraction of correct trials out of the total number of completed trials; incomplete trials were discarded. A mixed-effects ANOVA was used to test for a significant effect of testing session (within subjects), drug (between subjects), and odor set (between subjects). To summarize performance across the 5 d test sequence, we computed a performance index (PI), defined as , where pd is the fraction of correct trials in a single session. The PI essentially serves as a measure of learning rate: it is equal to one if rats perform perfectly across all test sessions and zero if they perform at chance. Differences in PI across drug treatments was detected using a one-way ANOVA; we used Fisher's post hoc pairwise comparisons to determine significant differences between drug and vehicle conditions. The criterion for significance was set at α = 0.05.
Perceptual similarity test
We used an olfactory habituation paradigm (Cleland et al., 2002) to assess the ability of rats to spontaneously discriminate between the pairs of odors used in the two-alternative choice discrimination experiment. We first habituated rats to one of the odors in an odor set by repeated presentation and then assessed the novelty response to the second odor in the odor set by measuring active investigation, defined as directed sniffing within 1 cm of the odor source. The relative magnitude of the novelty response is assumed to be proportional to the perceptual similarity of the test and habituated odors (Cleland et al., 2002). For this experiment, we used a cohort of naive rats (n = 8), housed under identical conditions as the rats participating in the discrimination experiments, but given unlimited access to both food and water. Perceptual similarity testing took place in the home cages of the test animals under red light. All odors were diluted in mineral oil to a theoretical vapor-phase partial pressure of 3 Pa (Table 2). Odors were presented by placing 60 μl of the odor stimulus onto a 1 inch square piece of filter paper (Whatman #1) inside a weighing dish. The trial commenced when the weighing dish was inverted and placed on top of the wire cage lid. One experimenter prepared odor stimuli and controlled the start and stop of each trial, while a second experimenter, blind to the identity of the odorant, timed the active investigation. Each test session was preceded by one 50 s presentation of mineral oil. Test sessions comprised four 50 s presentations of the habituation odor at 5 min intervals, followed by two probe trials, consisting of one 50 s presentation of the habituated and test odorants, in random order. The assignment of the odors as habituation or test odorants, as well as the order of the two probe trials, was balanced across subjects and odor sets. Each rat completed one session for each of the 13 odor sets listed in Table 2, in random order. Data were analyzed by computing a behavioral dissimilarity index (Cleland et al., 2002), defined as , where tsame and tdifferent are the investigation times for the probe trials for the habituation odor and test odor, respectively.
Histology
After completing all behavioral sessions, rats were deeply anesthetized with an intraperitoneal injection of urethane (1.5 mg/kg) and received bilateral infusions of 1% methylene blue (6 μl per bulb). Twenty minutes following the dye infusion, rats were killed by cardiac perfusion of 0.9% saline followed by 10% formalin. The brain was extracted and visually inspected to confirm methylene blue diffusion within the main OBs but not encroaching on surrounding surfaces. The brain was then soaked in 10% formalin overnight, saturated in a solution of 20% sucrose in PBS, and then sectioned in 40 μm slices and stained with cresyl violet to verify cannulae placement within the main OB. All cannulae were found to be centered in the OB and we observed no dye infusions outside of the OBs.
Computational modeling
To assess the importance of OB cholinergic modulation on cortical discrimination learning, we use a combined computational model of OB and cortex (Figs. 1B, 3). Briefly, we have previously shown the network effects of bulbar cholinergic modulation (de Almeida et al., 2013): nicotinic receptors modulate the sparseness of odor representations, whereas muscarinic receptors modulate the synchrony among neurons mediating this representation (Fig. 3B). From previous work, we assume that odor representations in the OB define the perceptual similarity between pairs of odorants (Cleland et al., 2002), and that odor discrimination learning happens in structures postsynaptic to the OB, represented here by piriform cortex (Calu et al., 2007; Roesch et al., 2007; Miura et al., 2012; Gire et al., 2013). The similarity of rate representations conveyed to the piriform cortex from the OB is modulated by acetylcholine (ACh; Fig. 3Ci), as is the synchrony among neurons activated by the odorants (Fig. 3Cii). Learning in the piriform cortex proper further modulates the cortical representations of odorants and renders them more distinct from each other (Fig. 1B; de Almeida et al., 2013). The modeling part of the present study assesses whether known cholinergic modulation in the OB affects cortical learning in a manner that is sufficient to reproduce the observed behavioral effects (Fig. 1B).
Figure 3.

Computational model of OB and piriform cortex. A, Simplified structure of the piriform cortex. The system receives excitatory input from Mi cell axons in the OB that connect to Pyr and Ff cells. Pyr cells work as an autoassociative network, synapsing onto other Pyr neurons and to Fb cells. Both Ff and Fb interneurons make inhibitory synapses on Pyr cells (Stokes and Isaacson, 2010). The autoassociative connections between Pyr cells are subject to activity-dependent plasticity (+). B, We defined four groups of OB outputs based on the impact of ACh on different receptors. Bi, When both nicotinic and muscarinic receptors are on, the Mi activation pattern exhibits both high sparseness and high coherence (synchronization). Bii, When muscarinic receptors are off and nicotinic receptors are on, Mi output exhibits high sparseness but low coherence. Biii, When muscarinic receptors are on and nicotinic receptors are off, the Mi output exhibits low sparseness but high coherence. Biv, When both receptors are off, the Mi output has both low sparseness and low coherence. For ease of visualization, we here show a distribution centered on neuron #50. C, Average changes in network properties (±SEM) in each of the four configurations. The data in each panel are computed from 50 simulations with random odors. Despite the changes in sparseness (Ci) and coherence (Cii), the average firing frequency of the Mi output (Ciii) was kept constant at ∼6 Hz. This was done to isolate the effects of manipulating sparseness and coherence from the firing rate of Mi cells.
Mi output and odor stimulation.
The inputs to the piriform cortex network were implemented as a simplified model of Mi cells, which enabled us to independently manipulate the levels of sparseness or synchronization in the odor representation while keeping the average Mi output frequency constant, at ∼6 Hz. This balance helps to ensure that the effects on cortical learning observed are a result of the changes in sparseness and coherence alone and not due to changes in Mi average spiking activity. This simplified model is a schematic representation of findings well established with an integrate-and-fire network model (de Almeida et al., 2013), as well as a detailed biophysical model of OB (Li and Cleland, 2013). In this simplified model, the firing probability p of a Mi cell i at time t is defined by the following equation (Eq. 1):
 |
where 0 < Ai ≤ 1 sets the affinity of neuron i to a given odorant. These affinities are represented in our model by the overall activation of Mi cells (see details below). The parameter r defines the firing rate in response to the odor stimulation, T is the modulation period (in milliseconds), f sets the frequency of this modulation, and δ controls the duration of the positive excursion of the oscillation. Observe that δ controls how tightly together Mi cells fire (synchronization), but does not change firing rate. After each spike, the firing probability p is reduced to 0 for 20 ms to avoid unrealistic bursts during the firing cycles and to better fit the simulation using the integrate-and-fire model (de Almeida et al., 2013). In the model, odorants are defined by a distribution of affinities A across the Mi cells. We generated 100 different affinity values and randomly permuted them to create different odorants to guarantee that all odors impose the same average input to Mi cell population. The numerical values of the affinities were selected from a normal probability density function with μ = 50 and σ = s, where s is a parameter that defines the level of sparseness in the Mi output (for details on this and all other parameters in the model, see Table 2). For all simulations reported in Results, affinity values for each odorant are randomly distributed across the Mi cell population; however, in some figures, these were centered at neuron #50 for easy of visualization only.
Olfactory cortex model.
We used a computational model of the piriform cortex originally implemented by de Almeida et al. (2013). Figure 3A shows the structure of the piriform cortex model. The piriform cortex network comprises three groups of cells: principal neurons [pyramidal (Pyr) cells] and two groups of inhibitory interneurons defined as feedforward (Ff) cells and feedback (Fb) cells. The piriform cortex network consisted of 100 neurons of each type. The piriform cortex network receives inputs from Mi cells in the OB, which are each randomly connected to Pyr and Ff cells (Linster et al., 2009; Stokes and Isaacson, 2010). Specifically, each Pyr cell is connected to 20% of the Mi network, while Ff cells receive outputs from 40% of the Mi cells. The Ff interneurons, in turn, provide feedforward inhibition to Pyr neurons. The second group of interneurons, the Fb cells, is recruited by the activation of Pyr cells and sends its inhibitory projections back to the same group of Pyr cells (Stokes and Isaacson, 2010). Pyr cells also receive autoassociative connections from other Pyr cells that are subject to activity-dependent potentiation, as described by de Almeida et al. (2013). The connectivity of each cell type is represented in the model as the percentage of cells from the presynaptic network that connect to a single cell in the postsynaptic network and are listed in Table 2 as parameter Conn.
The neurons are implemented as single compartments. The changes in the membrane voltage over time are described by the following differential equation (Eq. 2) adopted from previous works (Linster and Cleland, 2002; Linster et al., 2007, 2009):
 |
where τ is the membrane time constant and Vext(t) is the external input over time. Different neurons receive different inputs. The complete list of parameters is found in Table 2. Changes in the input from a presynaptic neuron j at time t are described in the following equation (Eq. 3):
 |
where Wij is the synaptic strength, gi(t) represents conductance change in cell i, EN,ij is the Nernst potential of the specific channel type, and vi(t) is the membrane potential at time t of the postsynaptic neuron i. The changes in conductance gi(t) depend on the rising and falling times of the conductance (τ1 and τ2) and a constant with no unit representing the maximum conductance of a given channel (gmax), as shown in the following equation (Eq. 4): g(t) = gmax (e−t/r1 − e−t/t2).
After firing, the voltage of each spiking neuron is reset to a hyperpolarization potential vhyper and remains inactive for a refractory period trefrac.
In the model, neurons interact with each other through discrete action potentials, which are defined as a function of the membrane potential, as shown in the following equation (Eq. 5):
 |
Here, Fi (V) represents the instantaneous spiking probability of neuron i. θmin And θmax represent the minimum threshold and the saturation threshold of the output/probability function, respectively. β Defines the nonlinearity of Fi (V).
Synaptic plasticity.
The synaptic changes between associative fibers in Pyr cells are implemented as a Hebbian learning rule similar to that shown by Jensen et al. (1996). In these connections, the synaptic strength will be enhanced if both presynaptic and postsynaptic neurons fire together and will be reduced if those neurons do not fire together. Each Pyr–Pyr connection has a synaptic weight initially set to a random minimal value between zero and 0.02, which is ∼10% of the average maximum W observed after one training session in our network. The changes in synaptic enforcement have been long attributed to NMDA receptors that allow the influx of Ca2 as well as postsynaptic depolarization (Bliss and Collingridge, 1993). Here we assume that the postsynaptic depolarization is attributed to back propagation from the action potential of the postsynaptic cell described by the following equation (Eq. 6):
 |
where the time course of this depolarization at the postsynaptic neuron (τpost) is 2 ms. On the other hand, the kinetics of NMDA channels depend on the binding of glutamate on the receptors. In the model, its time course is described by the following equation (Eq. 7):
 |
where τNMDAf = 7 ms and τNMDAr = 1 ms characterize the receptors' kinetics. The changes in the synaptic between neurons i and j is described by the following equation (Eq. 8):
 |
Here tdelay is the time it takes an action potential to travel from the soma to the synapses of a recurrent collateral. If ipost and bglu peak together, the synaptic efficacy between neuron i and j is increased with the characteristic time τpp, whereas if the synaptic events are asynchronous, synaptic efficacies are decreased with time τpnp and τnpp. For our simulations, τpp, τpnp, and τnpp are 200 ms.
Cholinergic modulation.
Cholinergic modulation in the OB increases the excitability of periglomerular and Mi cells through nicotinic receptors (Ravel et al., 1990; Castillo et al., 1999; Chaudhury et al., 2009) while increasing granule cell afterdepolarization and reducing afterhyperpolarization through muscarinic receptors (Nickell and Shipley, 1988; Pressler et al., 2007). Previous simulations show that blocking nicotinic receptors reduces the sparseness in Mi activation. On the other hand, blocking muscarinic receptors mostly disrupts the network synchronization, although the level of sparseness is also slightly reduced. Using the simplified model of Mi cells described above, we defined four classes of OB network outputs based on the activation of different cholinergic receptors (Fig. 3B): (1) when cholinergic modulation is on in both receptor groups (ACh ON), the Mi output activity is highly sparse and synchronized (Fig. 3Bi); (2) when muscarinic receptors are blocked (ACh ON, Mu OFF), reduction in the Mi synchronization is reduced but its sparseness remains the same (Fig. 3Bii); (3) when nicotinic receptors are blocked (ACh ON, Ni OFF), the opposite occurs with OB output exhibiting high synchronization but lower sparseness (Fig. 3Biii); (4) finally, when all receptors are blocked (ACh OFF), both synchrony and sparseness are lower (Fig. 3Biv). To isolate the influence of synchrony and sparseness on the piriform cortex network (Fig. 3Ciii), the average OB Mi cell output rate is kept constant across all four conditions, although cholinergic modulation in the OB may influence the overall firing rate (Rothermel et al., 2014). As in de Almeida et al. (2013), cholinergic modulation in the piriform cortex switches the dynamics of the network between learning (ACh ON) and recalling (ACh OFF) modes (Hasselmo and Bower, 1992; Barkai and Hasselmo, 1994; Hasselmo and Barkai, 1995). When the system is in learning mode, the synaptic transmission between autoassociative connections is reduced by 40% (Hasselmo and Bower, 1992; Hasselmo and Cekic, 1996) and synaptic plasticity is active. During recall mode, autoassociative connections are fully functional and plasticity is inactive. Additionally, cholinergic modulation has been shown to suppress neuronal adaptation of Pyr cells (Haberly and Bower, 1989; Barkai and Hasselmo, 1994). This property is included here as an outward (hyperpolarizing) current that increases the firing threshold for recently active Pyr cells when the network is in recall mode. The conductance changes of the afterhyperpolarization current giahc(t) in cell i are described in the following equation (Eq. 9):
 |
where Xi = 1 in the time-step after neuron i spikes and zero otherwise. Thus, gahc increases with the constant Aahc and decays with the characteristic time τahc.
Simulation techniques.
All simulations were implemented using the Matlab programming language, with Euler integration method for the differential equations with a time step of 0.5 ms. The statistical significance of the results was evaluated using two-sample t tests. The source code of these models can be downloaded from the modelDB website (Hines et al., 2004) at the link senselab.med.yale.edu/ModelDb/, accession number 146813. A summary of the parameters used in these simulations can be found in Table 2.
Simulation of discrimination learning.
To test how learning affects discrimination, we measured how the level of dissimilarity between memory activations changes over a sequence of training sessions (Fig. 1B). Initially, we trained the piriform cortex network with two random odor patterns using the four different input configurations shown in Figure 3B. These previously learned memories would subsequently be recalled and the similarity (see details below) between the evoked Pyr cell activities of these two memory patterns measured. Independently of the input configuration during training, the recall step always uses the ACh OFF input configuration (Fig. 3Biv), so that we can better isolate the effects of learning on the autoassociative connections of the Pyr cells. Over the course of an experiment, the learning process is subdivided into five sessions, each comprising 2 s learning cycles for each odor memory and intended to represent the daily behavioral training sessions.
Analysis.
The activation patterns of Mi cells to different odorants can be described by three different metrics: (1) the level of sparseness of the odor representation (that is, the selectivity of the activation pattern that a single odorant elicits in the population of neurons); (2) the level of coherence or synchronization of all neurons in the network; and (3) the average firing rate of the neurons in the network. To quantify the similarity in piriform cortex odor representations, we calculated as the Euclidean distance between the corresponding 100-element activity vectors O1 and O2, as shown in the following equation (Eq. 10):
 |
where O1i and O2i are the elements of the activity vectors O1 and O2.
We use the Euclidean distance between odor representations as a proxy for the discriminability of those odors (Gire et al., 2013). As the cortical network learns a pair of odorants, the distance between their representations increases. To quantify cortical learning and compare to behavioral results, we calculate a cortical PI, or cortical improvement index as Dpost/Dpre − 1, with Dpre and Dpost being the distance before and after training, respectively. If no improvement is seen, the index equals zero. As the cortical network grows, the index grows from zero upwards.
Results
Role of cholinergic modulation in olfactory discrimination learning
We examined the role of cholinergic modulation in the main OB on reward-motivated odor discrimination by infusing cholinergic antagonists directly into the OB of rats performing a two-alternative choice olfactory discrimination task. Food-deprived rats were trained to nose-poke, sample an odor, and then respond by selecting one of two reward ports based on odor identity. Rats were gradually shaped to perform the task; training on the first odor set typically lasted ∼2–3 weeks while training on subsequent odor sets occurred more rapidly, on the order of several days. Following training, rats performed 200 trials per testing session for five consecutive days each week after receiving either vehicle (saline) or cholinergic antagonist drug infusions directly into the main OBs bilaterally. We assessed performance on the acquisition of 13 odor sets (Table 1) in each of the treatment conditions; no rat was run more than once on a five-session sequence using the same odor set. The average performance of all rats in the task, pooled across odor sets, is shown in Figure 4Ai. Saline-infused control rats consistently improved in their ability to discriminate between novel odors over the course of several days, with performance reaching an asymptotic value of ∼85% by session 4. Infusion of a mixture of cholinergic antagonists (MLA, 19 mm; scopolamine, 22 mm) before behavioral testing resulted in impaired performance, although rats infused with the muscarinic receptor antagonist scopolamine alone or in combination with the nicotinic receptor antagonist MLA showed more severe deficits than rats infused only with MLA (Fig. 4Ai).
Figure 4.

OB cholinergic modulation affects behavioral performance and cortical discrimination. A, Behavioral results. Ai, Average performance (±SEM) as a function of test session for saline-infused, scopolamine-infused, MLA-infused, and combination mixture-infused rats, pooled across odor sets (n = 13). Aii, Average PI (±SEM) for each of the four treatment groups. Rats infused with scopolamine alone or in combination with MLA have significantly lower PIs than saline-infused rats, whereas the difference between MLA-infused and saline-infused rats is not significantly different. B, Computational results. Bi, Average change in cortical discrimination (measured relative to Euclidean distance between odor pairs before training) following training using different bulbar network configurations. In the control condition with all bulbar ACh receptors on, corresponding to saline condition in behavioral experiments, rats attain higher levels of discrimination than all other simulations. Bii, Cortical PI (degree of improvement in odor discrimination in the cortical network) for networks trained with the four bulbar configurations. Similar to behavioral results, networks trained with bulbar ACh on perform better than networks trained on inputs from the bulbar network with any combination of blocked ACh receptors.
To compare overall results between drug treatments, we computed a PI (see Materials and Methods), which summarizes rats' performance across the five-session testing sequence (Fig. 4Aii). The PI indicates if the rats learn the discrimination: if they respond randomly in all five sessions (50% correct), the PI equals zero; if they respond perfectly (100% correct), the PI equals one. A one-way ANOVA of PI yielded a significant effect of drug treatment (F(3,48) = 8.34, p < 0.001), with post hoc tests revealing a significantly smaller PI in scopolamine-infused and combination-infused rats compared with saline-infused controls (p < 0.001). However, the PIs for both of these drug treatment groups were significantly >0 (p < 0.005), indicating that learning was not completely abolished over the five-session testing sequence. Despite the trend for MLA-infused rats to perform worse than saline-infused controls, the PIs for these two groups were not statistically different (p = 0.063). Inspection of the plots in Figure 4Ai,Aii suggests that this negative result may be due in large part to the high variability in performance observed in MLA-infused rats.
Computational modeling shows a similar overall effect of blocking muscarinic and/or nicotinic receptors in the OB on cortical discrimination performance (Fig. 4B). In the model, we simulated the two-alternative choice behavioral experiment by alternatively presenting the piriform cortical model with one of two odors. We quantified cortical discriminability by computing the Euclidean distance between the cortical network activation patterns for each odorant (Gire et al., 2013); the cortical PI shown in the graphs corresponds to the change in discriminability over the course of training. Simulations were performed separately using each of four distinct OB cholinergic configurations, defined by the levels of sparseness and coherence in OB network outputs (Fig. 3B,C), which correspond to the four pharmacological drug treatment groups studied in the behavioral experiments (de Almeida et al., 2013). For each configuration, 250 pairs of odors, randomly chosen, were used to train the network.
As the cortical network learns an odor pair during training, the distance between neural representations increases, indicating that cortical odor representations are rendered less similar to each other (Fig. 4Bi). On average, when either of the OB cholinergic receptors are blocked, cortical discrimination learning is slowed down and does not reach the same asymptotic performance as the model with fully modulated OBs (Fig. 4Bi). These results suggest that modulation of odor representations in the OB affects learning in the olfactory cortex. Overall, simulation results correspond to behavioral findings in that cortical learning is most impaired when muscarinic receptors or both receptor types are blocked (Fig. 4Bii). Note that in the simulations, the effect of learning is determined after each training session by measuring the distance between the two learned odor representations, whereas in the experimental data we measure the average number of correct trials over the complete session. In other words, simulation results show the final discrimination, whereas behavioral results show the average discrimination for each session. As a result, learning after session 1 is comparatively higher in simulations under control conditions (Fig. 4Bi) than in experimental data (Fig. 4Ai).
Muscarinic receptor blockade generally impairs odor discrimination learning while nicotinic receptor blockade impairs learning of perceptually highly similar odorants only
Previous studies of olfactory discrimination learning in insects and rodents have demonstrated an interaction between task difficulty, OB network dynamics, and behavioral outcomes (Beshel et al., 2007; Doucette et al., 2011). In particular, disruption of normal OB dynamics by local application of antagonists to cholinergic (Mandairon et al., 2006b; Chaudhury et al., 2009), noradrenergic (Doucette et al., 2007; Mandairon et al., 2008), or GABAergic receptors (Stopfer et al., 1997; Lepousez and Lledo, 2013) impairs the discrimination of similar odorants while sparing discrimination of dissimilar odorants. Based on these previous results, we hypothesized that the variability in performance across odor sets, especially in rats infused with MLA, would be more severe for difficult discrimination tasks involving perceptually similar odors. As an example, Figure 5Ai,Aii shows performance curves for two odor sets in each of the four treatment conditions. Performance following MLA infusions is highly variable, resulting in performance comparable to saline controls at one extreme (Fig. 5Ai) and, at the other extreme, chance performance across all five test sessions (Fig. 5Aii). The PIs for these two odor sets are 0.523 and 0.056, respectively. Saline-treated rats also treat these two odor pairs differentially, suggesting a difference in degree of difficulty. These behavioral results are mimicked by the model in which blockade of nicotinic receptors had a strong effect on some, but not all, odor pairs (Fig. 5Bi,Bii).
Figure 5.

Nicotinic receptor blockade varies across odor sets. A, Behavioral results. Performance as a function of test session for the four treatment groups on two individual odor sets (Ai, odor set 7; Aii, odor set 9). Each curve represents data obtained from one rat; the four curves in each panel, representing the four drug conditions, were obtained from different rats. The effects of MLA infusion are highly variable, ranging from no noticeable effect (Ai) to complete impairment (Aii). B, Computational results. Performance on two individual odor sets depicted as change in discrimination between the odors in the pair across test sessions when cortical network is trained with bulbar input in each of the four network configurations. Note that in one odor pair (Bi) performance under nicotinic receptor blockade is similar to that of controls, whereas in a second odor set (Bii), performance under the same condition is notably impaired.
To explicitly test the hypothesis that odor pair difficulty, or perceptual similarity, was at the root of the inconsistent effect of nicotinic receptor blockade, we first ran an independent experiment to determine the perceptual similarity between each pair of odors in our battery of odor sets. Eight naive rats performed an olfactory dishabituation task that probed rats' capacity to spontaneously discriminate between two odors (Cleland et al., 2002). We habituated rats to one odor of an odor set by repeatedly exposing them to the odor and subsequently quantified the novelty response upon presentation of the second odor in the odor set. Figure 6Ai displays the average investigation time in each of the habituation and probe trials, collapsed across the 13 odor pairs tested. For all odor pairs, the investigation time during the last habituation trial is significantly smaller than during the first habituation trial (paired t tests, p < 0.05), indicating the formation of a habituation memory. The specificity of the memory was assessed by comparing investigation times on two probe trials in which either the habituated odor (Fig. 6Ai, Hab) or a novel odor (Fig. 6Ai, Novel) comprising the second odor in the odor set was presented. Figure 6Aii displays the investigation times during the two probe trials for each of the 13 odor sets. Rats exhibit a large novelty response for some odor sets, as evidenced by the large increase in investigation time on the novel probe trial, whereas for other odor sets there is only a modest increase in investigation time on the novel probe trial (cf. Fig. 6Aii, odor sets 5 and 11). To quantify perceptual similarity of the two odors in each pair, we calculated a behavioral dissimilarity index using the investigation times on the probe trials (Cleland et al., 2002). Across odor sets, we observed a bimodal distribution of behavioral dissimilarity indices (Fig. 6Aiii). We classified odor sets as perceptually similar or dissimilar based on this distribution. Dissimilar odor sets (Fig. 6Aiii, open circles) have large dissimilarity indices (>0.4), indicating that rats exhibit a robust novelty response when probed with the second odor, whereas similar odor sets (Fig. 6Aiii, filled circles) have a small dissimilarity index (<0.4) because rats exhibit a weak novelty response. For dissimilar odorants, rats' investigation was significantly higher for novel versus habituated odor (p < 0.05); for similar odorants the investigation times were not different (p > 0.05).
Figure 6.

Determining perceptual similarity of odor sets. A, Behavioral approach. Ai, Average investigation time (±SEM) pooled across odor sets for each 50 s odor exposure trial in the olfactory habituation task. One odor from an odor set was randomly assigned as the habituation odor, and was presented during four 50 s trials (H1–H4) separated by 5 min intervals, followed by two 50 s probe trials in which animals were presented the same odor (Hab) or the second odor in the pair (Novel), in random order. Aii, Average investigation time (±SEM) on the two probe trials (Hab and Novel) for each of the odor sets. Aiii, Behavioral dissimilarity index for each odor set, averaged across rats (±SEM). Data are displayed in ascending order; labels on the abscissa correspond to the odor sets in Aii and Table 1. Odor sets were classified into similar (filled circles) and dissimilar (open circles) groups based on the behavioral dissimilarity index. B, Example simulated bulbar input patterns for similar and dissimilar odorants. The graphs show a heat map of a 10 × 10 representation of olfactory sensory neuron (OSN) responses to three odorants with varying degrees of similarity. These are representative of patterns chosen to simulate similar and dissimilar odorants in the model. Note that in these heat maps, the odor responses are artificially ordered for ease of visualization (see Materials and Methods); in the actual simulations, the spatial distribution of active OSNs is random. Heat maps are calculated from the average OSN firing rates during odor stimulation for each odorant; warmer colors correspond to higher firing rates. Pattern dissimilarity was calculated as the Euclidean distance between two 100-dimensional vectors of average response rates, as specified in Materials and Methods. C, Correspondence between behavioral dissimilarity index and bulbar odor response patterns (reproduced with permission from Cleland et al., 2002). The graph shows the behavioral dissimilarity index measured using a habituation/dishabituation task and an odor–reward associative task (Cleland et al., 2002) in response to aliphatic acids of varying carbon chain length, as a function of the dissimilarity measured from 2DG activation maps in response to these same odorants (Johnson et al., 1999). Each data point shows the average behavioral dissimilarity index as a function of the average 2DG dissimilarity index. Data from two types of behavioral experiments are depicted (1 nonassociative and 1 associative; for details, see Cleland et al., 2002); the lines represent regression lines for each experiment. Red circles indicate the range of behavioral dissimilarities used in the present experiments (Aiii), which defined the odor activation dissimilarities used in the corresponding simulations (B). Odorants used in the present experiments can be divided into two classes of dissimilarity (C, red circles; Aiii, dark and light circles) and simulation odorants were chosen to have the corresponding degree of overlap (B, 0.272 and 0.904).
We next examined behavioral performance on the odor acquisition task separately for dissimilar and similar odor sets (Fig. 7A,B). We observed a dissociation in the effects of muscarinic and nicotinic blockade on task performance for dissimilar versus similar odor sets. Namely, when muscarinic receptors were blocked using scopolamine alone or in combination with MLA, animals performed worse than saline controls on both dissimilar and similar odor set acquisition. On the other hand, when nicotinic receptors were blocked with MLA, animals were severely impaired on the acquisition of similar odor sets, but performed comparably to saline-infused rats for dissimilar odor sets. We quantified these effects by computing the PI for each of the drug treatments separately for similar and dissimilar odor sets and subjecting the data to a two-way ANOVA. Results showed a significant interaction between drug treatment and odor set similarity (F(8,3) = 3.43, p = 0.025). Post hoc tests revealed that rats infused with either scopolamine alone or in combination with MLA had significantly smaller PIs than saline-infused rats for both dissimilar (p < 0.001) and similar (p < 0.005) odor sets. On the other hand, the PI for MLA-infused rats was significantly smaller compared with saline-infused controls for similar (p < 0.001) but not dissimilar odor sets (p = 0.30). As observed in the pooled results (Fig. 4Aii), the PIs for scopolamine and combination-infused rats were significantly >0 for dissimilar odor sets (p < 0.01, both treatments), indicating that rats were indeed learning to discriminate the odors, albeit at a slower rate than saline-infused controls. However, when the odors had high perceptual similarity, all three drug treatments resulted in PIs that were not significantly different from zero, suggesting that rats were not learning at all over the five-session testing sequence. These results suggest that OB muscarinic receptors play a critical role in odor discrimination acquisition, in general, whereas nicotinic receptors are important only when there is substantial perceptual overlap between odorants.
Figure 7.

Role of bulbar cholinergic receptors in acquisition of novel odor discrimination problems depends on perceptual similarity of odors. Ai, Average performance (±SEM) as a function of test session for rats performing the acquisition task using dissimilar odor sets (n = 9). Note the high performance in MLA-infused rats. Aii, Average performance (±SEM) as a function of test session for rats performing the acquisition task using similar odor sets (n = 4). Note the low performance in MLA-infused rats. B, PI for each of the drug treatment groups plotted separately for dissimilar and similar odor sets. *p < 0.005, **p < 0.001. C, Simulated cortical PI for networks trained with bulbar input under the four experimental conditions for odor inputs with low (dissimilar) and high (similar) overlap. Similar to behavioral results, the effect of turning off nicotinic receptors depends on odor set similarity, such that the cortical network exhibits poorer discrimination of similar odors following removal of bulbar nicotinic receptors.
To directly compare behavioral results with simulations using the computational model, we needed to first quantitatively define the notion of dissimilarity for simulated odor input patterns. Previous experiments in our laboratory have shown that behavioral similarity measured using a habituation/dishabituation paradigm can be related to the pairwise overlap between odor activation patterns at the input of the OB (Linster et al., 2001; Cleland et al., 2002; Mandairon et al., 2006a; Youngentob et al., 2006). Odors used in the present experiment fell into two categories on the previously measured curves: <0.4 dissimilarity and >0.4 dissimilarity (Fig. 6C; Cleland et al., 2002). Figure 6C shows how perceptual similarity is related to pairwise overlap between glomerular activation of odors [as measured by deoxyglucose (2DG) mapping; Johnson and Leon, 2000; Johnson et al., 2002]. We can therefore define, as we have done in previous modeling studies, simulated odorants at the input of the OB with relative dissimilarities similar to those measured experimentally (Mandairon et al., 2006a) for computational purposes. In the computational model, we calculated the dissimilarity between pairs of odorants at the input of the OB, which corresponds to the dissimilarity measure used for the 2DG patterns (Fig. 6C; Johnson et al., 1999; for example, see Fig. 6B). To compare to behavioral results, we chose two classes of odor pairs; examples with their corresponding dissimilarity measures are shown in Figure 6B. These levels of dissimilarity correspond approximately to those measured in 2DG experiments for odor pairs with behavioral dissimilarity indices comparable to those in the present study.
As observed behaviorally, computational modeling shows a dissociation in the role of nicotinic and muscarinic receptors with odor set dissimilarity. We separately analyzed cortical learning for 250 similar and dissimilar odor sets (defined according to the analysis in Fig. 6B,C). Figure 7C shows the cortical PI for each of the OB network configurations, corresponding to the four drug treatments, separately for dissimilar and similar odor sets. Blocking muscarinic receptors impairs cortical discrimination, in general (i.e., regardless of odor set similarity); on the other hand, following nicotinic receptor blockade, cortical discrimination is impaired only when odor sets are highly overlapping in their peripheral representations. Note that the cortical discrimination index compares distances between cortical odor representations before and after learning, whereas the behavioral PI measures learning over the course of 5 training days. The large difference in behavioral and computational effects of nicotinic receptor blockade for similar odorants (Fig. 6B, MLA; Fig. 7C, Ni OFF) arises partially from this difference in metric. Overall, given the metrics chosen, odor learning is not as severely affected by nicotinic receptor blockade in the model compared with behavioral results.
Control experiments
To ensure that rats were not using information other than odor cues from the pair of test odors (such as auditory cues from the solenoid valves or odor contamination) to solve the task, we tested six rats in the acquisition task for five consecutive sessions using identical odors [(+)-limonene, 0.2% dilution in mineral oil] loaded into different ports in the olfactometer. The PI was not significantly different from chance performance (p = 0.951), indicating that rats were unable to learn based on extraneous cues.
To test for ceiling effects of drug dosages, we tested acquisition following infusion of the combination treatment at one-fifth the original concentration (scopolamine, 4.4 mm; MLA, 3.6 mm) in a subset of rats (n = 6) and odor pairs (Table 1). The average performance of rats receiving the low-dosage combination infusion was somewhat worse than that of saline controls, although it was substantially higher than performance of rats infused with the high dosage of cholinergic antagonists (Fig. 8Ai). An ANOVA on PI yielded a significant effect of drug treatment (F(2,15) = 14.52, p < 0.001) with post hoc tests revealing that the PI was significantly smaller in rats receiving the high-dosage infusion compared with both saline-infused controls (p = 0.002) and rats receiving the low-dosage infusion (p < 0.001). The modest decrease in PI observed in rats receiving the low-dosage infusion did not reach statistical significance when compared with saline controls (p = 0.136; Fig. 8Aii). These data are consistent with previous studies from our laboratory demonstrating more severe behavioral impairments in olfactory discrimination following OB infusion with increasing concentration of cholinergic antagonists (Mandairon et al., 2006b; Devore et al., 2012).
Figure 8.

Behavioral control experiments. A, Dose–response curve for dissimilar odor sets. Ai, Average performance (±SEM) as a function of test session for rats performing the novel odor acquisition task using dissimilar odor sets (n = 6 odor sets) and receiving either a high dosage of cholinergic antagonists (scopolamine, 22 mm; MLA, 19 mm), a low dosage at one-fifth the original concentration (scopolamine, 4.4 mm; MLA, 3.6 mm), or saline infusions. Aii, PI for each of the drug treatment groups. **p < 0.005, ***p < 0.001. B, Control for impairment of general odor processing and perception. The graph shows the average performance as a function of daily sessions for three experimental groups. All groups received saline infusions for the first 4 d of training, followed by a fifth day in which they received either saline, scopolamine (22 mm), or MLA (19 mm) infusions. These graphs indicate that once an odor discrimination task has been acquired, manipulation of bulbar cholinergic modulation does not affect discrimination performance.
To test if cholinergic receptor blockade created nonspecific impairments in odor perception or processing, we tested rats that were fully trained on an odor pair with cholinergic receptor blockade after learning only. The experimental paradigm was identical to the acquisition task, except that rats received saline infusions before sessions 1–4 and only received infusions of cholinergic antagonists before the fifth session. Thus, rats were allowed to acquire the discrimination problem for 4 d before we tested the influence of cholinergic antagonists on discrimination performance. We restricted our pharmacological manipulations to either blockade of nicotinic receptors with 19 mm MLA or blockade of muscarinic receptors with 22 mm MLA but not both in combination. Figure 8B shows the results for the cohort of rats participating in this study (n = 4). Cholinergic modulation in the OB appeared to play little role in discrimination performance after learning, as scopolamine-treated animals, MLA-treated animals, and saline-infused controls performed similarly during session 5. These observations were confirmed by a two-way ANOVA on the ratio of performance on sessions 4 and 5, which yielded no significant main effects of odor type (p = 0.963) or drug (p = 0.845). These results show that while learning of novel odor sets can be impaired by manipulation of bulbar ACh receptors, odor perception and processing is not, since fully trained rats showed no impairment when ACh receptors are blocked.
Effect of bulbar modulation on cortical processing in the computational model
Looking more closely at the odor representations learned by the OB/cortical network, we can gain insight into the mechanisms underlying the behavioral impairment observed when bulbar cholinergic receptors are manipulated. The distance (or dissimilarity) between odor activation patterns at the output of the OB is modulated by ACh. Figure 9A (top) shows example 10 × 10 heat maps of Mi cell output patterns in response to dissimilar (Fig. 9A, left, middle) and similar (Fig. 9A, middle, right) odorants. The average distance between similar and dissimilar patterns under the different network modes is shown in Figure 9Bi; the graph shows the pairwise Euclidean distances relative to that of two dissimilar odorants at the input to the OB. Any change from this distance is due to bulbar computations. Clearly, cholinergic modulation in the OB enhances the contrast between odor representations, as evidenced by the relative increase in Euclidean distance at the output of the bulb when the bulbar network is fully modulated (Fig. 8Bi, compare OB output ACh ON, OB input).
Figure 9.

Odor processing and learning in olfactory network. A, Heat maps depicting 10 × 10 arrays of odor response patterns in the OB and piriform cortex. Each image shows the average responses of Mi cells or Pyr cells during a 2 s odor presentation with warmer colors representing higher responses. Each column shows responses to one simulated odor. The odors in the left and middle columns together form a dissimilar pair, while the odors in the middle and right columns constitute a similar odor pair, according to the definitions in Figure 5. Odor representations conveyed to the OB are processed in the OB network to create bulbar output. The three upper rows show examples of bulbar output patterns under control conditions (ACh ON) and partial receptor blockade conditions (Ni OFF or Mu OFF). In the bulb, average response patterns are modulated by nicotinic, but not muscarinic, receptor activation. Bulbar output patterns are conveyed to the cortical network (PC before learning), where these are modulated by synaptic plasticity in the cortical association fibers (PC after learning). In the piriform cortex, neural response patterns are transformed by learning. Learned patterns in response to OB patterns under the different drug conditions are shown in the last three rows of panels. Note that learning under control conditions (ACh ON) leads to well defined and separated pairs of odor patterns, whereas learning with Ni OFF (in the OB) creates high-overlap pattern and learning with Mu OFF (in the OB) leads to very reduced learning. B, Average change in pairwise distances between dissimilar and similar bulbar output patterns relative to the distance between these patterns at the input to the OB. Any changes within a category are due to bulbar processing. The graph shows distances between odor representations conveyed to the bulb (OB input), and at the output of the OB under full or partial modulation (OB output). Bulbar output representations are rendered more dissimilar when nicotinic receptors are active (OB output, ACh ON, Mu OFF). In contrast, at this level of representation—based on firing rate only—blockade of muscarinic receptors does not affect bulbar output (OB output, Mu OFF). C, Average change in pairwise Euclidean distance of simulated cortical representations for dissimilar and similar odorants relative to the prelearning distance between dissimilar odorants. The graph shows pairwise distances between cortical odor representations before learning (Pre learning) or after learning with bulbar modulation on (Post learning, OB Ach ON) or partially on (Ni OFF, Mu OFF). Cortical learning of dissimilar odorants is only impaired by blockade of muscarinic receptors in the OB (OB Mu OFF), whereas cortical learning of similar odorants is impaired by blockade of both muscarinic and nicotinic receptors (Ni OFF, Mu OFF).
The effects of nicotinic receptor modulation in the OB can be measured as overall changes in Mi cell response rates to a given odorant (Fig. 3), rather than changes in the temporal aspects of Mi cell spiking. Nicotinic receptor blockade results in a bulbar output pattern that resembles the input, effectively negating bulbar contrast enhancement (Fig. 9Bi). Thus, for similar odors, the bulbar outputs project highly overlapping patterns of activity to the piriform cortex, i.e., the number of bulbar outputs (cortical inputs) responding to a pair of similar odorants is higher. The cortical attractor network, when trained on a pair of odorants, exhibits changes in association fiber connectivity that lead to more specific representations for each odorant: Pyr cells that are odor responsive are more active, signal-to-noise ratio is improved, and the odor representations become sparser and more distinct (de Almeida et al., 2013). In the context presented here, the more similar the representations conveyed to the cortex, the less cortex can render these more distinct through its internal learning process. The graph in Figure 9Bii shows the pairwise Euclidean distances between odor representations in the cortical network after learning relative to the distances evoked before learning. Any changes in distance measured is due to the learning process in the cortical network. Even with fully modulated bulbar inputs, the network exhibits somewhat impaired learning when highly similar odorants are presented (Fig. 9A, Bii) as observed behaviorally with saline-infused control rats (Fig. 7B). However, when similar odorants are rendered even more similar at the OB output because of nicotinic receptor blockade in the OB, the cortical network cannot rescue these representations, similarly to rats with nicotinic receptors blocked when presented with similar odorants (Fig. 9B). When the network is trained with bulbar inputs during blockade of nicotinic receptors, the cortical representations change less relative to before odor learning. The cortical network is still able to resolve the OB projection patterns for dissimilar odorants, but discrimination in the cortex is impaired for similar odorants as a result of the highly overlapping projection patterns.
Both behaviorally and in the model, modulation of muscarinic receptors affects processing of all odors regardless of odor similarity. Overall activation patterns when measured as average firing rates evoked by odor presentations are not modulated by muscarinic receptors (Fig. 9A). As a consequence, the distances between bulbar output patterns are not changed by blockade of muscarinic receptors (Fig. 9Bi). Instead, muscarinic receptor modulation changes the dynamics of the OB network and with it the synchrony of spikes among responsive bulbar Mi cells (de Almeida et al., 2013; Li and Cleland, 2013). This effect is independent of odor identity and hence changes the coherence of cortical inputs for both similar and dissimilar odorants. Although average firing rate patterns conveyed to the piriform cortex are not changed (Fig. 9Bi), the synchrony in piriform cortex inputs is disrupted and learning in the piriform cortex network is impaired for both similar and dissimilar odor pairs (Fig. 9Bii).
To understand how disrupting synchrony in the inputs to the cortex impairs learning, we must examine the cortical output in more detail. Figure 10 illustrates the differences in nicotinic and muscarinic receptor blockade in the bulb on cortical processing. Figure 10A illustrates processing under control conditions. Piriform cortex Pyr cells respond to odor input before learning (Fig. 10Ai) and their responses are strengthened after learning because, in addition to bulbar input, cells also receive strong inputs from other Pyr cells via associational connections (Fig. 10Aii). Figure 10Aiii shows spiking responses of two Pyr cells before and after learning (vertical dashed line); the cell in the upper part of the panel is modulated by learning while the one below is not. Figure 10Aiv shows heat maps of the synaptic weights in the cortical network before and after learning. Figure 10B,C illustrates what happens when nicotinic or muscarinic receptors are blocked in the OB model. In the case of nicotinic receptor blockade, no obvious differences in cortical neural responses can be observed (Fig. 10Bi,Bii,Biii), neither before nor after learning. Synaptic weight changes are evident and asymptote at similar levels than those observed for control conditions (Fig. 10D). In contrast, when bulbar muscarinic receptors are blocked, cortical cells do not respond as strongly to bulbar input and learning does not progress (Figs. 10Ci,Cii,Ciii). Because multiple coincident Mi cell inputs are required to generate a cortical Pyr cell action potential (Davison and Ehlers, 2011; de Almeida et al., 2013), reducing the synchrony of the Mi cell outputs by blocking muscarinic receptors results in an overall decrease in the activation of piriform cortical Pyr cells (Fig. 10Ci) and therefore less plasticity at associational synapses (Fig. 10Cii–Civ,D). Synaptic weights do not attain levels similar to control simulations (Fig. 10D), and neither do cortical average firing rates (Fig. 10E). Thus, blocking muscarinic receptors in the OB appears to regulate the rate of learning by changing the synchrony of incoming odor information. Hence all odors are equally affected and discrimination learning does not happen, as evidenced by reduced synaptic weight changes and reduced changes in cortical sparseness.
Figure 10.

Learning in the cortical network. Ai–Ci, Raster plots of Pyr cell firing before learning in response to a sample odor under the three modulatory conditions: (A) ACh ON, (B) ACh ON/Ni OFF, and (C) ACh ON, Mu OFF. Aii–Cii, Raster plots of Pyr cell firing after learning of the same odor. Note that Pyr cell firing is enhanced after learning with bulbar nicotinic receptors off, but not with muscarinic receptors off. Aiii–Ciii, Example activity of two Pyr cells in the network, one undergoing changes in response to learning and the other not. Aiv–Civ, Heat maps of synaptic weights in the model (100 × 100) before and after learning for each condition. The heat maps show synaptic weights between all pairs of Pyr cells before and after odor learning with warm colors indicating higher synaptic weights. D, Graph of average synaptic weights normalized relative to the highest weight reached during learning. E, Average change in Pyr cell firing rate during learning relative to the rate before learning under each condition.
Discussion
Cholinergic modulation of neural circuits is thought to play a critical role in learning and memory (Hasselmo et al., 1992; Sarter and Bruno, 1997; Hasselmo and Giocomo, 2006). We here investigated the role of cholinergic modulation in the main OB on reward-motivated odor discrimination learning by infusing cholinergic antagonists directly into the OB of rats performing a two-alternative choice olfactory discrimination task. Results demonstrate that rats infused with saline consistently improved in their ability to discriminate between novel odors over the course of several days, whereas rats infused with cholinergic receptor antagonists generally exhibited impaired performance (Fig. 4A). However, the extent of behavioral impairment depended on what type of receptors were blocked as well as on the perceptual difficulty of the odor discrimination task (Fig. 7B). Namely, rats generally exhibited impaired performance when muscarinic receptors were blocked by infusion of scopolamine alone or in combination with the nicotinic receptor antagonist MLA. On the other hand, rats infused with MLA alone were impaired only for tasks in which the odor pairs were perceptually similar and hence more difficult to discriminate. Control experiments indicated that impairments are not due to a general decrease in olfactory perception: rats in which cholinergic receptors were blocked subsequent to the acquisition of an odor discrimination (under saline) performed similarly to saline controls when tested on recall of the discrimination problem (Fig. 8B). These controls show that odor perception per se is not modulated significantly by the drugs used here, while acquisition of an odor discrimination is. Drugs are infused locally into the OB at a volume assumed to be restricted to the OB (Mandairon et al., 2006b); however, diffusion out of the OB cannot be strictly ruled out.
Using a modified version of a recently developed computational model of cholinergic processing in the OB and piriform cortex (de Almeida et al., 2013), we simulated the two-alternative choice task and found that the observed behavioral results were directly related to changes in cortical discrimination. To capture known effects of ACh on OB processing, we defined four modes of OB network output that differed along two dimensions, sparseness and coherence (Fig. 3B). Simulated nicotinic receptor blockade switched the network from high to low sparseness, while leaving coherence unchanged, whereas simulated muscarinic receptor blockade conversely switched the network from high to low coherence without altering sparseness. Under control conditions (i.e., with full cholinergic modulation), cortical discrimination improved as the network learned the new odor representations (Fig. 4B). In parallel to the behavioral results, the average change in cortical discrimination was profoundly reduced by disrupting cholinergic processing in the OB, with the extent of impairments related both to perceptual difficulty as well as to what feature of the OB network activity was disrupted (Fig. 7C). An in-depth examination of the computations performed by the model demonstrated that the same outcome (i.e., a decrease in the Euclidean distance in cortical odor representations) could arise from distinct underlying mechanisms. Together, these results suggest that muscarinic receptor blockade results in a bona fide learning impairment that can be attributed to the decreased activation of pyramidal cells. On the other hand, the behavioral impairment following nicotinic receptor blockade might not be due to the inability of the cortex to learn per se, but rather may be perceptual in nature and can be attributed to the inability of the cortical network to resolve highly overlapping inputs.
Our finding that muscarinic receptors are important for olfactory memory acquisition is consistent with other studies in which muscarinic receptors have been blocked systemically (Chapuis and Wilson, 2013; Pavesi et al., 2013). Chapuis and Wilson (2013) observed profound learning impairments in the acquisition of novel odor discrimination problems following systemic blockade of muscarinic receptors by scopolamine; the impairment was similar when the blockade was restricted to the piriform cortex. In the present study, we observed profound impairments in learning even when muscarinic blockade was restricted to the OB. While the results of cortical muscarinic blockade can be readily interpreted given what is known about the role of cholinergic transmission in mediating cortical synaptic plasticity (Hasselmo and Bower, 1992; Hasselmo and Barkai, 1995), it was not immediately obvious how blocking muscarinic receptors in the bulb impairs learning. Our computational modeling results suggest that the impairment arises because the bulbar outputs (i.e., the cortical inputs) are less synchronous (Fig. 3; de Almeida et al., 2013), leading to weaker responses in cortical neurons (de Almeida et al., 2013), which results in slower learning at association synapses in the cortex (Fig. 9). Our results, together with those of Chapuis and Wilson (2013), show that cholinergic modulation regulates olfactory learning by effecting cellular and network-level changes simultaneously in multiple structures along the olfactory pathway.
On the other hand, the present results contradict previous studies suggesting that reward-based olfactory discrimination learning does not depend on cholinergic modulation in the OB (Mandairon et al., 2006b). Using a digging paradigm in which rats acquire novel discrimination problems in as few as one or two trials, Mandairon et al. (2006b) found no significant effect of blocking bulbar cholinergic receptors on the acquisition of novel olfactory discrimination problems. In the present study, where rats take hundreds of trials to learn the association between odors and reward ports, we observed profound effects of blocking cholinergic receptors. Interestingly, this discrepancy in the role of bulbar cholinergic receptors across behavioral paradigms parallels observations made following blockade of bulbar noradrenergic (NA) receptors. To be specific, Mandairon et al. (2008) found only a modest impairment in learning in a digging-based paradigm following blockade of bulbar NA receptors, whereas Doucette et al. (2007) observed complete abolishment of learning in a Go/No-Go operant paradigm when blocking bulbar NA receptors. It is possible that the discrepancy between behavioral paradigms arises from differences in the duration of odor exposure on each trial—animals performing a digging-based task may be exposed to the odor for much longer, facilitating rapid learning. Such differences highlight the importance of bulbar cholinergic modulation with increasing task difficulty, which parallels observations in other modalities (Sarter et al., 2005; Robinson et al., 2011). Difficulty in olfactory behavior can be achieved by using low-concentration odors (Mandairon et al., 2006b), requiring animals to remember odors across time delays (Ravel et al., 1994; Devore et al., 2012), or requiring animals to associate an odor with a reward that is both spatially and temporally remote from the odor stimulus (present study). Moreover, it is possible that processing of information downstream of the OB has some dependence on the specific behavioral paradigm (Scalia and Winans, 1975). Going forward, it will be important to study how information processing in different downstream circuits is influenced by bulbar neuromodulation.
In our model, synchrony among OB outputs was increased via muscarinic cholinergic receptor activation on granule cells. In the intact bulbar circuit, there are numerous cellular mechanisms that govern the dynamics of granule cells (Trombley and Shepherd, 1992; Halabisky et al., 2000; Pressler and Strowbridge, 2006; Balu et al., 2007; Pressler et al., 2007; Nai et al., 2010). Our behavioral results complement a growing number of studies suggesting that manipulations that alter fast oscillatory activity in the OB, presumably by altering the granule cell network, impair odor discrimination learning (Stopfer et al., 1997; Doucette et al., 2007; Mandairon et al., 2008; Lepousez and Lledo, 2013). In general, results from these studies indicate that olfactory discrimination learning is impaired when synchrony among OB outputs is disrupted. The present modeling results suggest that such discrimination impairments arise because Pyr cells in the cortex are less active and therefore exhibit slower plasticity dynamics. Although a recent in vivo study has demonstrated that olfactory cortical neurons are indeed sensitive to the precise timing of inputs from the OB (Haddad et al., 2013), it remains to be tested whether olfactory cortical neurons are generally less responsive when the synchrony among active bulbar network outputs is disrupted.
Two-alternative choice discrimination behavior has been linked to olfactory cortical processing (Miura al., 2012; Gire et al., 2013; Chapuis and Wilson, 2013). The results of the present study suggest that performance in two-alternative choice odor discrimination is directly related to the discriminability of cortical odor representations, and that cholinergic modulation in the OB regulates both the contrast and strength of these representations. Overall, our results suggest that a critical function for cholinergic signaling to the OB is to preprocess the signals impinging on the olfactory cortical network to facilitate the formation of robust cortical odor representations to guide behavior.
Footnotes
This research was supported by National Institutes of Health Grants R01 DC009948 (C.L.), F32 DC011974 (S.D.), a L'Oreal USA Fellowship for Women in Science (S.D.) and Capes BEX 3214-13-3 (L.d.A.). The authors thank Matthew Einhorn for technical support; James Jones-Rounds, Mario Lavalanet, Jennifer Marino, and Eric Peng for assisting with the collection of behavioral data; and Dr. Marco Idiart for useful discussions.
The authors declare no competing financial interests.
References
- Balu R, Pressler RT, Strowbridge BW. Multiple modes of synaptic excitation of olfactory bulb granule cells. J Neurosci. 2007;27:5621–5632. doi: 10.1523/JNEUROSCI.4630-06.2007. [DOI] [PMC free article] [PubMed] [Google Scholar]
- Barkai E, Hasselmo ME. Modulation of the input/output function of rat piriform cortex pyramidal cells. J Neurophysiol. 1994;72:644–658. doi: 10.1152/jn.1994.72.2.644. [DOI] [PubMed] [Google Scholar]
- Beshel J, Kopell N, Kay LM. Olfactory bulb gamma oscillations are enhanced with task demands. J Neurosci. 2007;27:8358–8365. doi: 10.1523/JNEUROSCI.1199-07.2007. [DOI] [PMC free article] [PubMed] [Google Scholar]
- Bliss TV, Collingridge GL. A synaptic model of memory: long-term potentiation in the hippocampus. Nature. 1993;361:31–39. doi: 10.1038/361031a0. [DOI] [PubMed] [Google Scholar]
- Calu DJ, Roesch MR, Stalnaker TA, Schoenbaum G. Associative encoding in posterior piriform cortex during odor discrimination and reversal learning. Cereb Cortex. 2007;17:1342–1349. doi: 10.1093/cercor/bhl045. [DOI] [PMC free article] [PubMed] [Google Scholar]
- Castillo PE, Carleton A, Vincent JD, Lledo PM. Multiple and opposing roles of cholinergic transmission in the main olfactory bulb. J Neurosci. 1999;19:9180–9191. doi: 10.1523/JNEUROSCI.19-21-09180.1999. [DOI] [PMC free article] [PubMed] [Google Scholar]
- Chapuis J, Wilson DA. Cholinergic modulation of olfactory pattern separation. Neurosci Lett. 2013;545:50–53. doi: 10.1016/j.neulet.2013.04.015. [DOI] [PMC free article] [PubMed] [Google Scholar]
- Chaudhury D, Escanilla O, Linster C. Bulbar acetylcholine enhances neural and perceptual odor discrimination. J Neurosci. 2009;29:52–60. doi: 10.1523/JNEUROSCI.4036-08.2009. [DOI] [PMC free article] [PubMed] [Google Scholar]
- Cleland TA, Linster C. Central olfactory processing. In: Doty RL, editor. Handbook of olfaction and gustation. New York: Marcel Dekker; 2003. pp. 165–180. [Google Scholar]
- Cleland TA, Morse A, Yue EL, Linster C. Behavioral models of odor similarity. Behav Neurosci. 2002;116:222–231. doi: 10.1037/0735-7044.116.2.222. [DOI] [PubMed] [Google Scholar]
- Davison IG, Ehlers MD. Neural circuit mechanisms for pattern detection and feature combination in olfactory cortex. Neuron. 2011;70:82–94. doi: 10.1016/j.neuron.2011.02.047. [DOI] [PMC free article] [PubMed] [Google Scholar]
- de Almeida L, Idiart M, Linster C. A model of cholinergic modulation in olfactory bulb and piriform cortex. J Neurophysiol. 2013;109:1360–1377. doi: 10.1152/jn.00577.2012. [DOI] [PMC free article] [PubMed] [Google Scholar]
- Devore S, Manella LC, Linster C. Blocking muscarinic receptors in the olfactory bulb impairs performance on an olfactory short-term memory task. Front Behav Neurosci. 2012;6:59. doi: 10.3389/fnbeh.2012.00059. [DOI] [PMC free article] [PubMed] [Google Scholar]
- Doucette W, Milder J, Restrepo D. Adrenergic modulation of olfactory bulb circuitry affects odor discrimination. Learn Mem. 2007;14:539–547. doi: 10.1101/lm.606407. [DOI] [PMC free article] [PubMed] [Google Scholar]
- Doucette W, Gire DH, Whitesell J, Carmean V, Lucero MT, Restrepo D. Associative cortex features in the first olfactory brain relay station. Neuron. 2011;69:1176–1187. doi: 10.1016/j.neuron.2011.02.024. [DOI] [PMC free article] [PubMed] [Google Scholar]
- D'Souza RD, Vijayaraghavan S. Nicotinic receptor-mediated filtering of mitral cell responses to olfactory nerve inputs involves the α3β4 subtype. J Neurosci. 2012;32:3261–3266. doi: 10.1523/JNEUROSCI.5024-11.2012. [DOI] [PMC free article] [PubMed] [Google Scholar]
- Ghatpande AS, Sivaraaman K, Vijayaraghavan S. Store calcium mediates cholinergic effects on mIPSCs in the rat main olfactory bulb. J Neurophysiol. 2006;95:1345–1355. doi: 10.1152/jn.00757.2005. [DOI] [PubMed] [Google Scholar]
- Gire DH, Whitesell JD, Doucette W, Restrepo D. Information for decision-making and stimulus identification is multiplexed in sensory cortex. Nat Neurosci. 2013;16:991–993. doi: 10.1038/nn.3432. [DOI] [PMC free article] [PubMed] [Google Scholar]
- Haberly LB, Bower JM. Olfactory cortex: model circuit for study of associative memory? Trends Neurosci. 1989;12:258–264. doi: 10.1016/0166-2236(89)90025-8. [DOI] [PubMed] [Google Scholar]
- Haddad R, Lanjuin A, Madisen L, Zeng H, Murthy VN, Uchida N. Olfactory cortical neurons read out a relative time code in the olfactory bulb. Nat neurosci. 2013;16:949–957. doi: 10.1038/nn.3407. [DOI] [PMC free article] [PubMed] [Google Scholar]
- Halabisky B, Friedman D, Radojicic M, Strowbridge BW. Calcium influx through NMDA receptors directly evokes GABA release in olfactory bulb granule cells. J Neurosci. 2000;20:5124–5134. doi: 10.1523/JNEUROSCI.20-13-05124.2000. [DOI] [PMC free article] [PubMed] [Google Scholar]
- Halász N, Shepherd GM. Neurochemistry of the vertebrate olfactory bulb. Neuroscience. 1983;10:579–619. doi: 10.1016/0306-4522(83)90206-3. [DOI] [PubMed] [Google Scholar]
- Hasselmo ME, Barkai E. Cholinergic modulation of activity-dependent synaptic plasticity in the piriform cortex and associative memory function in a network biophysical simulation. J Neurosci. 1995;15:6592–6604. doi: 10.1523/JNEUROSCI.15-10-06592.1995. [DOI] [PMC free article] [PubMed] [Google Scholar]
- Hasselmo ME, Bower JM. Cholinergic suppression specific to intrinsic not afferent fiber synapses in rat piriform (olfactory) cortex. J Neurophysiol. 1992;67:1222–1229. doi: 10.1152/jn.1992.67.5.1222. [DOI] [PubMed] [Google Scholar]
- Hasselmo ME, Cekic M. Suppression of synaptic transmission may allow combination of associative feedback and self-organizing feedforward connections in the neocortex. Behav Brain Res. 1996;79:153–161. doi: 10.1016/0166-4328(96)00010-1. [DOI] [PubMed] [Google Scholar]
- Hasselmo ME, Giocomo LM. Cholinergic modulation of cortical function. J Mol Neurosci. 2006;30:133–135. doi: 10.1385/JMN:30:1:133. [DOI] [PubMed] [Google Scholar]
- Hasselmo ME, Anderson BP, Bower JM. Cholinergic modulation of cortical associative memory function. J Neurophysiol. 1992;67:1230–1246. doi: 10.1152/jn.1992.67.5.1230. [DOI] [PubMed] [Google Scholar]
- Hines ML, Morse T, Migliore M, Carnevale NT, Shepherd GM. ModelDB: a database to support computational neuroscience. J Comput Neurosci. 2004;17:7–11. doi: 10.1023/B:JCNS.0000023869.22017.2e. [DOI] [PMC free article] [PubMed] [Google Scholar]
- Jennings JW, Keefer LH. Olfactory learning set in two varieties of domestic rat. Psychol Rep. 1969;24:3–15. doi: 10.2466/pr0.1969.24.1.3. [DOI] [PubMed] [Google Scholar]
- Jensen O, Idiart MA, Lisman JE. Physiologically realistic formation of autoassociative memory in networks with theta/gamma oscillations: role of fast NMDA channels. Learn Mem. 1996;3:243–256. doi: 10.1101/lm.3.2-3.243. [DOI] [PubMed] [Google Scholar]
- Johnson BA, Leon M. Modular representations of odorants in the glomerular layer of the rat olfactory bulb and the effects of stimulus concentration. J Comp Neurol. 2000;422:496–509. doi: 10.1002/1096-9861(20000710)422:4<496::AID-CNE2>3.0.CO%3B2-4. [DOI] [PubMed] [Google Scholar]
- Johnson BA, Woo CC, Hingco EE, Pham KL, Leon M. Multidimensional chemotopic responses to n-aliphatic acid odorants in the rat olfactory bulb. J Comp Neurol. 1999;409:529–548. doi: 10.1002/(SICI)1096-9861(19990712)409:4<529::AID-CNE2>3.3.CO%3B2-E. [DOI] [PubMed] [Google Scholar]
- Johnson BA, Ho SL, Xu Z, Yihan JS, Yip S, Hingco EE, Leon M. Functional mapping of the rat olfactory bulb using diverse odorants reveals modular responses to functional groups and hydrocarbon structural features. J Comp Neurol. 2002;449:180–194. doi: 10.1002/cne.10284. [DOI] [PubMed] [Google Scholar]
- Lepousez G, Lledo PM. Odor discrimination requires proper olfactory fast oscillations in awake mice. Neuron. 2013;80:1010–1024. doi: 10.1016/j.neuron.2013.07.025. [DOI] [PubMed] [Google Scholar]
- Li G, Cleland TA. A two-layer biophysical model of cholinergic neuromodulation in olfactory bulb. J Neurosci. 2013;33:3037–3058. doi: 10.1523/JNEUROSCI.2831-12.2013. [DOI] [PMC free article] [PubMed] [Google Scholar]
- Linster C, Cleland TA. Cholinergic modulation of sensory representations in the olfactory bulb. Neural Netw. 2002;15:709–717. doi: 10.1016/S0893-6080(02)00061-8. [DOI] [PubMed] [Google Scholar]
- Linster C, Johnson BA, Yue E, Morse A, Xu Z, Hingco EE, Choi Y, Choi M, Messiha A, Leon M. Perceptual correlates of neural representations evoked by odorant enantiomers. J Neurosci. 2001;21:9837–9843. doi: 10.1523/JNEUROSCI.21-24-09837.2001. [DOI] [PMC free article] [PubMed] [Google Scholar]
- Linster C, Henry L, Kadohisa M, Wilson DA. Synaptic adaptation and odor-background segmentation. Neurobiol Learn Mem. 2007;87:352–360. doi: 10.1016/j.nlm.2006.09.011. [DOI] [PubMed] [Google Scholar]
- Linster C, Menon AV, Singh CY, Wilson DA. Odor-specific habituation arises from interaction of afferent synaptic adaptation and intrinsic synaptic potentiation in olfactory cortex. Learn Mem. 2009;16:452–459. doi: 10.1101/lm.1403509. [DOI] [PMC free article] [PubMed] [Google Scholar]
- Macrides F, Davis BJ, Youngs WM, Nadi NS, Margolis FL. Cholinergic and catecholaminergic afferents to the olfactory bulb in the hamster: a neuroanatomical, biochemical, and histochemical investigation. J Comp Neurol. 1981;203:495–514. doi: 10.1002/cne.902030311. [DOI] [PubMed] [Google Scholar]
- Mandairon N, Stack C, Kiselycznyk C, Linster C. Broad activation of the olfactory bulb produces long-lasting changes in odor perception. Proc Natl Acad Sci U S A. 2006a;103:13543–13548. doi: 10.1073/pnas.0602750103. [DOI] [PMC free article] [PubMed] [Google Scholar]
- Mandairon N, Ferretti CJ, Stack CM, Rubin DB, Cleland TA, Linster C. Cholinergic modulation in the olfactory bulb influences spontaneous olfactory discrimination in adult rats. Eur J Neurosci. 2006b;24:3234–3244. doi: 10.1111/j.1460-9568.2006.05212.x. [DOI] [PubMed] [Google Scholar]
- Mandairon N, Peace S, Karnow A, Kim J, Ennis M, Linster C. Noradrenergic modulation in the olfactory bulb influences spontaneous and reward-motivated discrimination, but not the formation of habituation memory. Eur J Neurosci. 2008;27:1210–1219. doi: 10.1111/j.1460-9568.2008.06101.x. [DOI] [PubMed] [Google Scholar]
- Miura K, Mainen ZF, Uchida N. Odor representations in olfactory cortex: distributed rate coding and decorrelated population activity. Neuron. 2012;74:1087–1098. doi: 10.1016/j.neuron.2012.04.021. [DOI] [PMC free article] [PubMed] [Google Scholar]
- Nai Q, Dong HW, Linster C, Ennis M. Activation of α1 and α2 noradrenergic receptors exert opposing effects on excitability of main olfactory bulb granule cells. Neuroscience. 2010;169:882–892. doi: 10.1016/j.neuroscience.2010.05.010. [DOI] [PMC free article] [PubMed] [Google Scholar]
- Nickell WT, Shipley MT. Neurophysiology of magnocellular forebrain inputs to the olfactory bulb in the rat: frequency potentiation of field potentials and inhibition of output neurons. J Neurosci. 1988;8:4492–4502. doi: 10.1523/JNEUROSCI.08-12-04492.1988. [DOI] [PMC free article] [PubMed] [Google Scholar]
- Pavesi E, Gooch A, Lee E, Fletcher ML. Cholinergic modulation during acquisition of olfactory fear conditioning alters learning and stimulus generalization in mice. Learn Mem. 2013;20:6–10. doi: 10.1101/lm.028324.112. [DOI] [PMC free article] [PubMed] [Google Scholar]
- Pressler RT, Strowbridge BW. Blanes cells mediate persistent feedforward inhibition onto granule cells in the olfactory bulb. Neuron. 2006;49:889–904. doi: 10.1016/j.neuron.2006.02.019. [DOI] [PubMed] [Google Scholar]
- Pressler RT, Inoue T, Strowbridge BW. Muscarinic receptor activation modulates granule cell excitability and potentiates inhibition onto mitral cells in the rat olfactory bulb. J Neurosci. 2007;27:10969–10981. doi: 10.1523/JNEUROSCI.2961-07.2007. [DOI] [PMC free article] [PubMed] [Google Scholar]
- Ravel N, Akaoka H, Gervais R, Chouvet G. The effect of acetylcholine on rat olfactory bulb unit activity. Brain Res Bull. 1990;24:151–155. doi: 10.1016/0361-9230(90)90199-A. [DOI] [PubMed] [Google Scholar]
- Ravel N, Elaagouby A, Gervais R. Scopolamine injection into the olfactory bulb impairs short-term olfactory memory in rats. Behav Neurosci. 1994;108:317–324. doi: 10.1037/0735-7044.108.2.317. [DOI] [PubMed] [Google Scholar]
- Robinson L, Platt B, Riedel G. Involvement of the cholinergic system in conditioning and perceptual memory. Behav Brain Res. 2011;221:443–465. doi: 10.1016/j.bbr.2011.01.055. [DOI] [PubMed] [Google Scholar]
- Roesch MR, Stalnaker TA, Schoenbaum G. Associative encoding in anterior piriform cortex versus orbitofrontal cortex during odor discrimination and reversal learning. Cereb Cortex. 2007;17:643–652. doi: 10.1093/cercor/bhk009. [DOI] [PMC free article] [PubMed] [Google Scholar]
- Rothermel M, Carey RM, Puche A, Shipley MT, Wachowiak M. Cholinergic inputs from basal forebrain add an excitatory bias to odor coding in the olfactory bulb. J Neurosci. 2014;34:4654–4664. doi: 10.1523/JNEUROSCI.5026-13.2014. [DOI] [PMC free article] [PubMed] [Google Scholar]
- Sarter M, Bruno JP. Cognitive functions of cortical acetylcholine: toward a unifying hypothesis. Brain Res Brain Res Rev. 1997;23:28–46. doi: 10.1016/S0165-0173(96)00009-4. [DOI] [PubMed] [Google Scholar]
- Sarter M, Hasselmo ME, Bruno JP, Givens B. Unraveling the attentional functions of cortical cholinergic inputs: interactions between signal-driven and cognitive modulation of signal detection. Brain Res Brain Res Rev. 2005;48:98–111. doi: 10.1016/j.brainresrev.2004.08.006. [DOI] [PubMed] [Google Scholar]
- Scalia F, Winans SS. The differential projections of the olfactory bulb and accessory olfactory bulb in mammals. J Comp Neurol. 1975;161:31–55. doi: 10.1002/cne.901610105. [DOI] [PubMed] [Google Scholar]
- Shipley MT, Ennis M. Functional organization of olfactory system. J Neurobiol. 1996;30:123–176. doi: 10.1002/(SICI)1097-4695(199605)30:1<123::AID-NEU11>3.0.CO;2-N. [DOI] [PubMed] [Google Scholar]
- Stokes CC, Isaacson JS. From dendrite to soma: dynamic routing of inhibition by complementary interneuron microcircuits in olfactory cortex. Neuron. 2010;67:452–465. doi: 10.1016/j.neuron.2010.06.029. [DOI] [PMC free article] [PubMed] [Google Scholar]
- Stopfer M, Bhagavan S, Smith BH, Laurent G. Impaired odour discrimination on desynchronization of odour-encoding neural assemblies. Nature. 1997;390:70–74. doi: 10.1038/36335. [DOI] [PubMed] [Google Scholar]
- Trombley PQ, Shepherd GM. Noradrenergic inhibition of synaptic transmission between mitral and granule cells in mammalian olfactory bulb cultures. J Neurosci. 1992;12:3985–3991. doi: 10.1523/JNEUROSCI.12-10-03985.1992. [DOI] [PMC free article] [PubMed] [Google Scholar]
- Youngentob SL, Johnson BA, Leon M, Sheehe PR, Kent PF. Predicting odorant quality perceptions from multidimensional scaling of olfactory bulb glomerular activity patterns. Behav Neurosci. 2006;120:1337–1345. doi: 10.1037/0735-7044.120.6.1337. [DOI] [PMC free article] [PubMed] [Google Scholar]
- Yu AJ, Dayan P. Uncertainty, neuromodulation, and attention. Neuron. 2005;46:681–692. doi: 10.1016/j.neuron.2005.04.026. [DOI] [PubMed] [Google Scholar]
- Záborszky L, Carlsen J, Brashear HR, Heimer L. Cholinergic and GABAergic afferents to the olfactory bulb in the rat with special emphasis on the projection neurons in the nucleus of the horizontal limb of the diagonal band. J Comp Neurol. 1986;243:488–509. doi: 10.1002/cne.902430405. [DOI] [PubMed] [Google Scholar]