Abstract
Entering a state of anxious anticipation triggers widespread changes across large-scale networks in the brain. The temporal aspects of this transition into an anxious state are poorly understood. To address this question, an instructed threat of shock paradigm was used while recording functional MRI in humans to measure how activation and functional connectivity change over time across the salience, executive, and task-negative networks and how they interact with key regions implicated in emotional processing; the amygdala and bed nucleus of the stria terminalis (BNST). Transitions into threat blocks were associated with transient responses in regions of the salience network and sustained responses in a putative BNST site, among others. Multivariate network measures of communication were computed, revealing changes to network organization during transient and sustained periods of threat, too. For example, the salience network exhibited a transient increase in network efficiency followed by a period of sustained decreased efficiency. The amygdala became more central to network function (as assessed via betweenness centrality) during threat across all participants, and the extent to which the BNST became more central during threat depended on self-reported anxiety. Together, our study unraveled a progression of responses and network-level changes due to sustained threat. In particular, our results reveal how network organization unfolds with time during periods of anxious anticipation.
Keywords: amygdala, anxiety, BNST, executive network, fMRI, salience network
Introduction
Anxious states induced by acute, unpredictable stressors have widespread effects on brain function due to changes in the organization of large-scale brain networks (Scott et al., 2006; Kienast et al., 2008; Henckens et al., 2010; Hermans et al., 2011; Thomason et al., 2011). At least three networks are altered by processing threat (Pessoa, 2013): a salience network that includes the anterior insula and thalamus, and responds to motivationally salient stimuli (Seeley et al., 2007; Menon and Uddin, 2010); a task-negative (also called “default mode”) network that includes the medial PFC and posterior cingulate cortex, and is engaged when attention is directed internally and during some forms of emotional processing (Gusnard et al., 2001; Greicius et al., 2003, 2009); and an executive control network that includes frontopartietal regions, and is engaged when cognitively demanding tasks require attention to the external world (Seeley et al., 2007; Vanhaudenhuyse et al., 2011).
Trial-by-trial manipulations of “anxious states”, such as the anticipation of shock, alter interactions within and between networks (Kinnison et al., 2012). However, the pattern of functional connectivity during threat anticipation may exhibit both transient and sustained components (Cribben et al., 2012; Hermans et al., 2014), which have not to date been described. Previous studies of threat used short anticipation periods that limit the ability to study sustained processes (Kinnison et al., 2012; Grupe et al., 2013), or used dynamic stimuli (Alvarez et al., 2011; Hermans et al., 2011) that make it difficult to determine whether effects are truly sustained or if they rely on repeatedly evoked transient responses. The present study aimed to unravel transient and sustained responses and functional connectivity in large-scale networks using an instructed threat of shock paradigm. Critically, we tested whether network-level properties change during prolonged anxious states, in contrast to static descriptions of network organization (Hermans et al., 2011; Kinnison et al., 2012).
Nonhuman research indicates that the amygdala plays a role in transient “fear” responses but the bed nucleus of the stria terminalis (BNST) is implicated in sustained “anxious” processing (Shi and Davis, 1999; Walker et al., 2003). Accordingly, human neuroimaging studies found transient amygdala responses following cues for imminent threat and sustained responses during prolonged threat in locations consistent with the BNST (Mobbs et al., 2010; Somerville et al., 2010; Alvarez et al., 2011). Critically, how the amygdala and BNST interact with other brain networks during the processing of extended threat is poorly understood. Thus, an important goal of this study was to determine how both structures alter “communication” (i.e., functional connectivity) between brain networks during threat processing.
In summary, the present study used functional MRI to explore temporal characteristics of transitioning into anxious states induced by the threat of shock. Univariate whole-brain activation and network analyses were used to interrogate transient and sustained effects during extended threat processing.
Materials and Methods
Participants
Twenty-four right-handed participants (9 male, age 19–34 years) with normal or corrected-to-normal vision and no reported neurological or psychiatric disease were recruited from the University of Maryland community. The project was approved by the University of Maryland College Park Institutional Review Board and all participants provided written informed consent before participation.
Procedure and stimuli
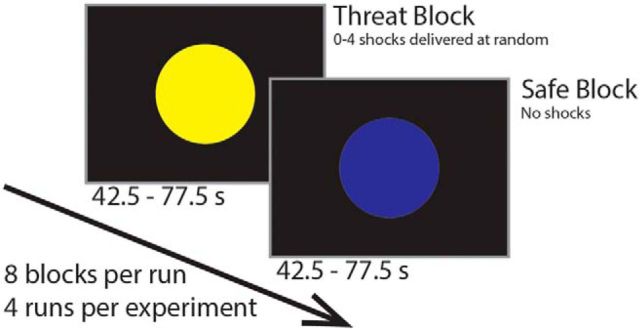
An instructed threat of shock paradigm was used during functional MRI to create sustained anxious states. Participants completed the trait portion of the Spielberger State-Trait Anxiety Inventory (STAI; Spielberger et al., 1970) ∼1 week before scanning, and then completed the state portion of the STAI immediately before scanning. Experimenters informed participants that a colored (e.g., yellow) circle on the screen indicated that they were in a “threat” block and mild electric shocks would be delivered randomly to their left hand, whereas a circle of another color (e.g., blue) indicated that they were in a “safe” block and no shocks would be delivered (Fig. 1). The colors were counterbalanced across participants. Each block had the average duration of 60 s (range 42.5–77.5 s). The whole experiment contained four runs resulting in a total of 16 threat and 16 safe blocks. Each threat block contained zero to four electric shocks, with five of 16 threat blocks containing zero shocks.
Figure 1.
Threat of shock paradigm.
Visual stimuli were presented using Presentation software (Neurobehavioral Systems) and viewed on a projection screen using a mirror mounted to the head coil. The MP-150 system (BIOPAC Systems) recorded skin conductance levels (SCL) via MRI-compatible electrodes affixed to the index and middle fingers of the left hand and operating at a sampling rate of 250 Hz with hardware high-pass filter at 0.05 Hz. An electric stimulator (Coulbourn Instruments) delivered 500 ms stimulation to the fourth and fifth fingers of the left hand via MRI-compatible electrodes. To calibrate the intensity of the shock, each participant was asked to choose his/her own stimulation level immediately before functional imaging, such that the stimulus would be “highly unpleasant but not painful”. After each run, participants were asked about the unpleasantness of the stimulus and were asked to, if needed, recalibrate it so that the shock would still be highly unpleasant but not painful.
MRI data acquisition
MRI data collection used a 3 tesla Siemens TRIO scanner (Siemens Medical Systems) with a 32-channel head coil. Each session began with the acquisition of a high-resolution MPRAGE anatomical scan (0.45 × 0.45 × 0.9 mm voxels). Each of the subsequent functional runs collected 201 volumes of EPI data with TR = 2.5 s, TE = 25 ms, and FOV = 192 mm. Each volume contained 44 oblique slices oriented 30° clockwise relative to the AC–PC axis (to decrease susceptibility artifacts in regions such as the amygdala and orbitofrontal cortex) with thickness 3 mm and voxels measuring 3 × 3 mm in plane.
Data analysis
SCL.
The SCL data for each participant were preprocessed using MATLAB (MathWorks) and included the following steps: temporal smoothing to reduce scanner-induced noise with a median filter (50 samples within a 200 ms window), resampling to 1 Hz, and normalizing signal magnitude across participants (setting the mean to 50 and SD to 10). Transformed SCL signals were analyzed using a linear model in the AFNI software package (http://afni.nimh.nih.gov/) to estimate the response to the two block types. Events of physical shock were modeled as additional regressors of no interest. The SCL response to each stimuli type (physical shock, onset of safe block, onset of threat block) was estimated using cubic spline basis functions for deconvolution in a manner analogous to processing of functional MRI data (Bach et al., 2009; Choi et al., 2012). The response to physical shock was modeled for 20 s following stimulus delivery, and the responses to block onsets were modeled for 40 s following stimulus onset. Responses locked to block onset were modeled for 40 s because that was the minimum duration of any threat or safe block, thus ensuring that estimated responses did not include the beginning of a subsequent block. The SCL response was indexed as the mean response across the 40 s period, and a paired t test was used to test differences between threat and safe across participants.
Functional MRI preprocessing.
Preprocessing of the functional and anatomical MRI data used the AFNI (Cox, 1996; http://afni.nimh.nih.gov/) and SPM software packages (http://www.fil.ion.ucl.ac.uk/spm/). The first three volumes of each functional run were discarded to account for equilibration effects. Slice-timing correction used Fourier interpolation to align the onset times of every slice in a volume to the first acquisition slice. A six-parameter rigid body transformation corrected head motion within and between runs by spatially registering each volume to the first volume. None of the participants exhibited excessive head motion (>3 mm total movement). The SPM package was used to skull strip the high-resolution anatomical images and segment the brain to create gray- and white-matter masks for each participant. Probability maps were extracted for gray matter, white matter, and CSF. Binarized white matter and CSF masks were created by thresholding the images at a probability >0.90. To reduce the likelihood that these masks contained voxels from adjacent gray-matter regions, they were “eroded” using AFNI's 3dmask_tool to remove voxels that had edges or faces that connected with voxels outside of the mask. A 12-parameter affine transformation registered each participant's anatomical scan with the TT_N27 template (AFNI package) for normalization to Talairach space (Talairach and Tournoux, 1988). The same transformation was applied to the functional data. A 6 mm full-width half-maximum (FWHM) Gaussian filter was used to spatially smooth all volumes, and the average intensity at each voxel (for each run) was scaled to 100.
Analysis of functional MRI signals.
The activation at every voxel was analyzed for each participant using a multiple regression model in AFNI. The response to safe-block onset, threat-block onset, and physical shock delivery were modeled using cubic spline basis functions that made no assumptions about the shape of the hemodynamic response. Responses to safe- and threat-block onsets were modeled for the first 40 s of the block because that was the minimum duration of any threat or safe block. Response to physical shock delivery was modeled for 20 s. Constant, linear, and quadratic terms were included as covariates of no interest for each run to accommodate slow-varying drifts in the MR signal. Additional covariates of no interest comprised the average signal from white matter voxels, the average signal from ventricle voxels, and six rigid-body head motion parameters. The white matter and ventricle signals were defined using the eroded maps of white matter and CSF regions from each participant's higher-resolution anatomical scan.
We used a data-driven approach to characterize how transient and sustained responses unfolded over time (Fig. 2). The functional time course was estimated at every gray matter voxel for 40 s following block onset. Subsequently, factor analysis was used to describe the responses at each voxel as a combination of temporal factors. Factor analysis guidelines were adapted from the event-related potential (Kayser and Tenke, 2003) and EEG literature (Shackman et al., 2010). Initially, for every voxel, an average response was determined, which pooled across trials, conditions, and participants. This allowed us to compute a “temporal correlation matrix”; specifically, a number-of-time points × number-of-time points matrix, where each entry was the correlation of the responses for a specific pair of time points. The correlation matrix described the similarity (across voxels) of the evoked responses for each pair of time points. Principal components were extracted from the correlation matrix and a scree test (Cattell, 1966) was used to determine the number of components to be retained. Note that the number of components retained (i.e., three) agrees with that of Kaiser criterion (e.g., a component is retained only if it explains at least 1/number-of-time points = 1/17 = 5.89% of the total variance by itself). Varimax rotation was applied to the retained components. The varimax rotation maximizes the variance of loadings within each factor (i.e., across time points) while preserving orthogonality (Kaiser, 1958; Abdi, 2003). This rotation method encourages each factor to load heavily on a small number of time points and have loadings near zero elsewhere to facilitate the factor's interpretation. Note that the rotated factors remain orthogonal (i.e., uncorrelated with one another) but a time point may contribute to multiple factors, so the factor analysis can identify temporally overlapping processes.
Figure 2.
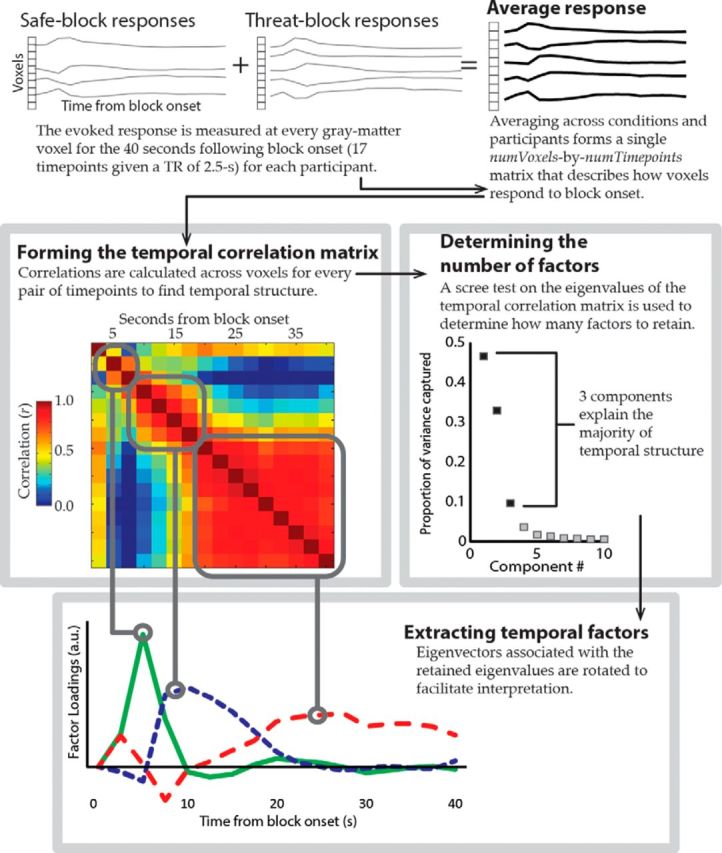
Method for performing temporal factor analysis on functional MRI responses.
Univariate random effects analyses were performed voxelwise during each temporal factor. Correction for multiple comparisons was performed by estimating the FWHM smoothness of spatial noise using AFNI's 3dFWHMx program (9.07 × 8.89 × 8.33 mm) and then using AFNI's 3dClustSim program to perform Monte Carlo simulations and determine the cluster extent threshold necessary to achieve a whole-brain corrected α ≤ 0.05. Based on these simulations, all statistical maps were thresholded at p < 0.005 (uncorrected) with a cluster extent ≥46 voxels.
ROIs for the BNST and amygdala.
Given a priori interest in the role of the BNST and amygdala during anxious anticipation, we measured their responses using anatomically defined regions of interest (ROIs). The ROIs for BNST were defined using the atlas of Mai et al. (1997) with Talairach x-coordinates restricted to the values between 3 and 8 mm (−3 and −8 mm for the opposite hemisphere), y-coordinates restricted between −1 and 3 mm, and z-coordinates restricted between −1 and 6 mm. Bilateral amygdala ROIs were defined using the Desai atlas (Desikan et al., 2006; Destrieux et al., 2010) provided with the AFNI software package. To minimize signal contributions from outside these ROIs, the response to block onsets were estimated using nonspatially smoothed data and averaged across the voxels within the ROIs. Threat and safe responses were measured for each temporal factor and differences between threat and safe conditions were tested with a paired t test.
Functional connectivity and network definition.
We defined three networks using coordinates from previous studies: the salience network, except the amygdala (19 regions; Hermans et al., 2011), the executive control network (16 regions; Seeley et al., 2007), and the task-negative network (12 regions; Fox et al., 2005). The bilateral BNST and bilateral amygdala regions were each included to form two additional networks that each had two ROIs. The final set contained 51 regions in five different networks (Table 1). Every region, except the BNST and amygdala regions, was defined as 6 mm radius spheres. Responses were measured in each region for each temporal factor on every experimental block by averaging nonspatially smoothed data across the voxels in each region.
Table 1.
| Region | Hemisphere | Talairach coordinates |
||
|---|---|---|---|---|
| x | y | z | ||
| Salience network nodes | ||||
| Fronto-insula | R | 34 | 18 | 4 |
| L | −34 | 22 | 4 | |
| Dorsal anterior cingulate cortex | — | −2 | 10 | 40 |
| Temporo-parietal junction | R | 62 | −26 | 36 |
| L | −62 | −26 | 36 | |
| Inferotemporal cortex | R | 54 | −62 | −4 |
| L | −54 | −54 | −8 | |
| Precentral | R | 26 | −6 | 64 |
| L | −26 | −2 | 64 | |
| Dorsolateral prefrontal cortex | R | 38 | 42 | 24 |
| L | −34 | 46 | 28 | |
| Inferior frontal gyrus | R | 54 | 6 | 20 |
| L | −54 | 10 | 12 | |
| Posterior thalamus | R | 6 | −18 | 4 |
| L | −6 | −18 | 0 | |
| Midbrain | R | 7 | −24 | −3 |
| L | −7 | −23 | −4 | |
| Hypothalamus | R | 10 | 2 | −8 |
| L | −10 | 2 | −8 | |
| Executive network nodes | ||||
| Orbital frontoinsula | L | −36 | 24 | −10 |
| Dorsolateral prefrontal cortex | R | 46 | 46 | 14 |
| L | −34 | 46 | 6 | |
| Ventrolateral prefrontal cortex | R | 34 | 56 | −6 |
| L | −32 | 54 | −4 | |
| Frontal operculum | R | 56 | 14 | 14 |
| Frontal eye field | R | 30 | 12 | 60 |
| L | −32 | 18 | 50 | |
| Dorsomedial prefrontal cortex | — | 0 | 36 | 46 |
| Lateral parietal | R | 38 | −56 | 44 |
| L | −48 | −48 | 48 | |
| Inferiortemporal cortex | R | 58 | −54 | −16 |
| Dorsal caudate | R | 12 | 14 | 4 |
| L | −16 | −14 | 20 | |
| Anterior thalamus | R | 10 | 2 | 8 |
| L | −8 | −2 | 8 | |
| Task-negative network nodes | ||||
| Posterior cingulate cortex | — | −2 | −36 | 37 |
| Retrosplenial | — | 3 | −51 | 8 |
| Lateral parietal | L | −47 | −67 | 36 |
| R | 53 | −67 | 36 | |
| Medial prefrontal cortex | L | −3 | 39 | −2 |
| R | 1 | 54 | 21 | |
| Superior frontal | L | −14 | 38 | 52 |
| R | 17 | 37 | 52 | |
| Inferotemporal cortex | L | −61 | −33 | −15 |
| R | 65 | −17 | −15 | |
| Parahippocampal | L | −22 | −26 | −16 |
| R | 25 | −26 | −14 | |
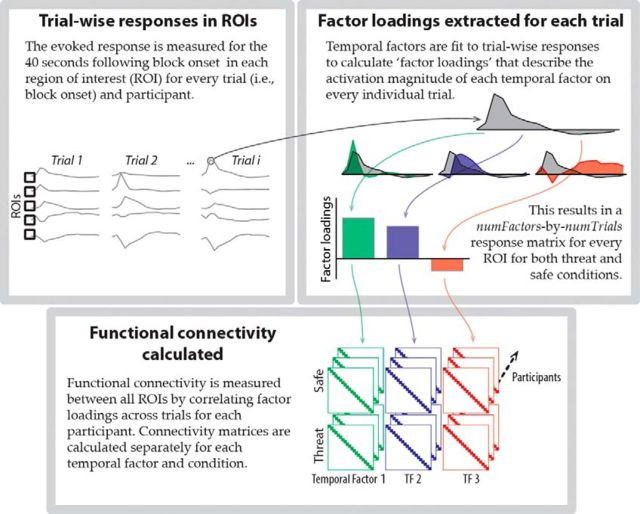
Network analysis was performed based on adjacency matrices (which we refer to as “connectivity matrices”) for safe and threat conditions, at each temporal factor (Fig. 3). To do so, the estimated response for every block was expressed in terms of three coefficients that determined the magnitude of the contribution (“factor loading”) of each of the temporal factors. In this manner, each trial (i.e., block) was represented as a vector of coefficients: (βtemporal_factor1, βtemporal_factor2, βtemporal_factor3). Each connectivity matrix was then defined via the Pearson correlation between pairs of ROIs of the coefficients across trials. In this manner, the connectivity matrices can be viewed as “trial-by-trial” (here, block-by-block) functional connectivity matrices during each temporal factor.
Figure 3.
Method for calculating functional connectivity during each temporal factor.
Network measures.
Network analysis in-group studies can be performed by determining connectivity matrices at the participant level, computing network metrics of interest (e.g., efficiency), and performing statistical tests on the metrics. This approach is appropriate when sufficient observations per participant (per condition) are available to compute a “stable,” representative connectivity matrix at the individual level. Because the long blocks used here limit the number of trials for each participant, a preferable approach is to average all individual-level connectivity matrices into a single group matrix for each condition. Then, network metrics can be computed and statistical analyses performed by comparing the observed metrics to what is observed in a “null model” estimated via Monte Carlo methods. Here, correlations were averaged across participants to generate group-level safe and threat connectivity matrices for each temporal factor. Fisher-transformations were applied before averaging the correlations to reduce bias induced by the bounds on correlations at −1 and 1 (Silver and Dunlap, 1987).
We used two network measures, namely, efficiency and betweenness. We used the “information flow” framework developed by Missiuro et al. (2009). Compared with standard measures of degree and betweenness, it has the advantage that it considers all possible paths of information transfer between nodes. The approach models a network as a lattice of resistors by transforming edge weights (here defined by functional connectivity) into electrical conductances (i.e., 1/resistance). The communication efficiency between nodes A and B is defined as the net conductance observed when a fixed current source is applied to A and a ground is set to B. The amount of current that passes through a third node C measures the extent to which node C is between A and B. The current-flow measures of efficiency and betweenness were used to calculate the following properties for each of the five networks: (1) within-network efficiency, defined as the average current-flow efficiency between all pairs of nodes within a network, (2) between-network efficiency, defined as a network's average efficiency with each of the other networks, and (3) network-betweenness, defined as the average betweenness for all nodes in a network with respect to communication between other networks.
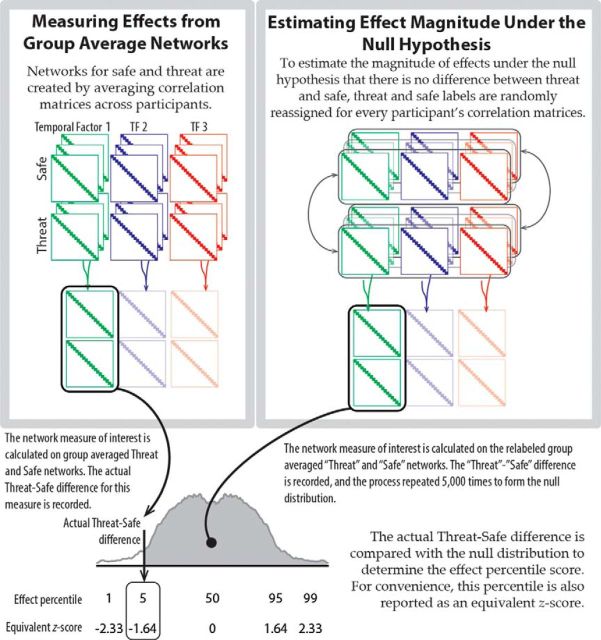
These three measures were calculated on the group-average connectivity matrices for each of the five networks for the threat and safe conditions during each temporal factor. Current-flow algorithms do not permit negative values in the connectivity matrix, so negative correlations (only 3% of connections) were set to zero as done in previous research (Rubinov and Sporns, 2010; Kinnison et al., 2012). Statistical inferences about threat versus safe differences were made by using permutation testing (Good, 2005) to estimate the distribution of the expected threat-safe difference under the null hypothesis (Fig. 4). Specifically, for each of 5000 permutations, randomly assign threat and safe labels for each participant's connectivity matrices; determine new group-average connectivity matrices for threat and safe (per time period); and recalculate network properties. The null distribution of the threat versus safe difference during each temporal factor was used to calculate the percentile of the observed threat versus safe difference to determine how extreme (or not) the observed effect was. For convenience in reporting the results, we converted percentiles into “equivalent” z-values of the standard normal distribution. To correct for multiple comparisons across the five networks, we calculated a maximum-z distribution during the permutation test. Specifically, we determined the distribution of the maximum z-statistic expected across the five networks under the null-hypothesis, thus taking into account all the tests simultaneously. Statistical inferences were made using this maximum-z distribution rather than the null distributions calculated for each individual network to calculate p values corrected for multiple comparisons (Westfall and Young, 1993; Nichols and Holmes, 2002; Maris and Oostenveld, 2007).
Figure 4.
Permutation-based methods for statistical inference on network measures.
Individual differences
Because network analysis was based on average connectivity matrices, we assessed a potential role of individual differences based on a median split of the data (instead of computing network measures on individuals). Participants were divided into high- (N = 11) and low-anxiety (N = 13) groups using a median split on the STAI state anxiety scores (but because trait anxiety scores were correlated with state anxiety scores, their contributions cannot be dissociated; see Discussion). The average connectivity matrices were calculated for threat and safe conditions in each group, and a threat-by-anxiety interaction was evaluated by calculating the difference of threat versus safe scores across high- and low-anxiety groups. Statistical significance again was assessed by determining a null distribution. The null distribution of the interaction score was estimated by randomly assigning participants to the high and low anxiety groups and recalculating the interaction score (5000 times).
Results
SCL
Threat blocks had greater average skin conductance level than safe blocks (t(23) = 5.55, p < 0.001), indicating that the threat of shock manipulation was successful and produced an increase in arousal.
Temporal analysis of functional MRI responses
To characterize potentially transient and sustained responses, the functional response was estimated at every gray-matter voxel for 40 s following the onset of an experimental block, and temporal factor analysis was used to describe responses as a combination of temporal factors (Fig. 2; see Materials and Methods). Three temporal factors that combine to account for 89% of the variance in responses across voxels were retained: an “early” transient response that peaked at 5 s after block onset, an “intermediate” response from 7.5 to 17.5 s, and a “late” sustained response between 20 and 40 s. Pooled across threat and safe blocks, during the early temporal factor (Fig. 5; Table 2) signal increased in salience network regions (e.g., thalamus and anterior insula) and visual cortex (e.g., medial occipital lobe), and signals decreased in task-negative regions (e.g., precuneus, inferior parietal lobule, and ventromedial PFC). This was followed by widespread signal decreases during the intermediate (Table 3) and late (Table 4) temporal factors. Subsequent analyses of threat effects on activation and functional connectivity were performed separately within each of these temporal factors to determine how responses unfolded over time.
Figure 5.
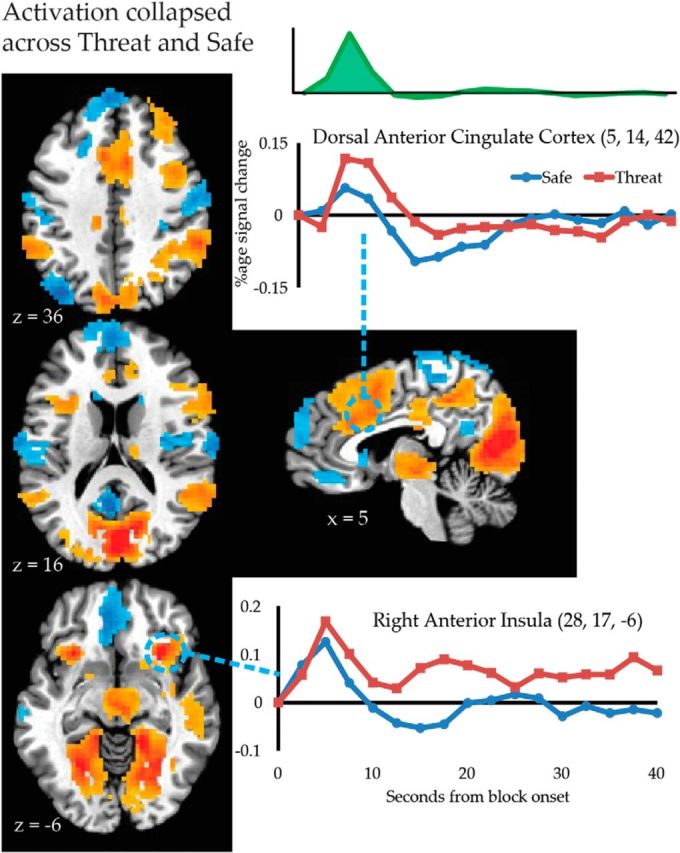
Mean activation during the first temporal factor. Brain maps depict the result of univariate tests during the first temporal component collapsed across Threat and Safe (voxel-level threshold at p < 0.005 and cluster-level threshold at p < 0.05). Inset, the time course associated with the first temporal factor. Insets show average estimated responses for threat and safe conditions for representative regions (Talairach coordinates shown).
Table 2.
| Region | Cluster extent | Talairach coordinates of peak |
Peak statistic, t (23) | ||
|---|---|---|---|---|---|
| x | y | z | |||
| Early temporal factor: threat + safe > 0 | |||||
| Cuneus | 6163 | 5 | −71 | 12 | 15.29 |
| Posterior cingulate | 8 | −40 | 40 | 9.23 | |
| Right supramarginal Gyrus | 56 | −42 | 31 | 8.73 | |
| Right inferior parietal | 56 | −53 | 11 | 6.37 | |
| Left lingual, fusiform | −23 | −55 | −6 | 11.33 | |
| Right lingual, fusiform | 23 | −66 | −6 | 6.90 | |
| Thalamus | −1 | −16 | −7 | 8.07 | |
| Left putamn | −20 | 7 | 1 | 6.67 | |
| Right putamen | 21 | 4 | 1 | 7.82 | |
| Left caudate | −10 | 8 | 2 | 7.85 | |
| Right caudate | 14 | 10 | 9 | 5.54 | |
| Left anterior Insula | −37 | 14 | 2 | 11.20 | |
| −28 | 17 | −7 | 10.34 | ||
| Right anterior Insula | 33 | 26 | 9 | 13.79 | |
| 28 | 17 | −6 | 11.77 | ||
| Right precentral | 38 | 7 | 29 | 7.78 | |
| Right middle frontal | 29 | 31 | 33 | 5.21 | |
| dmPFC | 726 | 8 | 14 | 42 | 8.42 |
| Dorsal anterior cingulate | 8 | 17 | 28 | 8.07 | |
| Bilateral superior frontal gyrus | 1 | 28 | 47 | 4.82 | |
| Left supramarginal | 213 | −56 | −44 | 36 | 6.30 |
| −55 | −51 | 19 | 3.92 | ||
| Early temporal factor: threat + safe < 0 | |||||
| Left postcentral | 1448 | −34 | −31 | 56 | −7.69 |
| −53 | −25 | 44 | −5.23 | ||
| Left posterior insula | −44 | −29 | 11 | −3.37 | |
| Precuneus | −5 | −59 | 20 | −8.67 | |
| Paracentral | 6 | −27 | 63 | −5.37 | |
| Left superior frontal gyrus | 1073 | −17 | 32 | 51 | −8.34 |
| −17 | 4 | 37 | −5.01 | ||
| Left middle frontal gyrus | −17 | 58 | 13 | −4.75 | |
| Frontal pole | −1 | 56 | 4 | −4.59 | |
| Medial orbitofrontal cortex | −1 | 20 | −15 | −4.05 | |
| Right posterior insula | 556 | 62 | −16 | 14 | −7.47 |
| Right postcentral | 53 | −14 | 34 | −5.25 | |
| Left Inferior Parietal Lobule | 180 | −35 | −74 | 36 | −7.79 |
Table 3.
| Region | Cluster extent | Talairach coordinates of peak |
Peak statistic, t (23) | ||
|---|---|---|---|---|---|
| x | y | z | |||
| Intermediate temporal factor: threat + safe > 0 | |||||
| None | |||||
| Intermediate temporal factor: threat + safe < 0 | |||||
| Right postcentral | 4201 | 41 | −26 | 57 | −8.31 |
| Left postcentral | −34 | −32 | 56 | −5.65 | |
| Paracentral | 0 | −25 | 48 | −3.77 | |
| Right precentral | 40 | −23 | 43 | −7.05 | |
| Left precentral | −52 | 4 | 41 | −4.23 | |
| Right posterior insula | 40 | −25 | 17 | −5.99 | |
| Left posterior insula | −31 | −28 | 20 | −5.53 | |
| Left thalamus | 399 | −10 | −28 | 2 | −5.74 |
| Right thalamus | 13 | −22 | 2 | −4.82 | |
| Precuneus | −6 | −56 | 16 | −5.27 | |
| Frontal pole | 397 | −4 | 62 | 8 | −5.07 |
| Medial PFC | −4 | 48 | 32 | −4.08 | |
| Left middle frontal gyrus | −15 | 43 | 29 | −4.03 | |
| Right lateral occipital | 154 | 53 | −71 | −1 | −4.89 |
| Left hippocampus | 130 | −23 | −17 | −10 | −5.40 |
| Left amygdala | −22 | 2 | −22 | −3.57 | |
| Right inferior parietal Lobule | 92 | 29 | −74 | 30 | −6.08 |
| Right amygdala | 78 | 26 | −11 | −10 | −5.18 |
| Right hippocampus | 31 | −23 | 9 | −3.93 | |
| Left lateral occipital | 62 | −44 | −59 | −4 | −4.06 |
| Ventral striatum, nucleus accumbens | 58 | 8 | 17 | −7 | −5.35 |
Table 4.
| Region | Cluster extent | Talairach coordinates of peak |
Peak statistic, t (23) | ||
|---|---|---|---|---|---|
| x | y | z | |||
| Late temporal factor: threat + safe > 0 | |||||
| None | |||||
| Late temporal factor: threat + safe < 0 | |||||
| Right superior parietal lobule | 1421 | 11 | −67 | 59 | −7.20 |
| Left superior parietal lobule | −25 | −67 | 54 | −4.02 | |
| Precuneus | 8 | −67 | 38 | −5.10 | |
| Left lingual gyrus | 389 | −14 | −74 | −16 | −6.48 |
| Right lingual gyrus | 14 | −77 | −16 | 3.61 | |
| Left fusiform | −35 | −62 | −15 | −5.23 | |
| Right fusiform | 31 | −58 | −16 | −4.68 | |
| Left thalamus | −6 | −31 | −2 | −4.88 | |
| Right thalamus | 11 | −28 | −2 | −4.63 | |
| Right superior and middle frontal gyri | 211 | 41 | −2 | 48 | −5.15 |
| Right middle temporal gyrus | 61 | 62 | −44 | −1 | −4.16 |
Effect of threat on responses for each temporal period
The only effect during the early temporal factor was reduced signal in the right dorsolateral PFC during threat (72 voxel cluster with peak t(23) = −4.41 at x = 23, y = 2, z = 45). A similar signal reduction occurred at the contralateral location (19 voxel cluster with peak t(23) = −5.14 at x = −20, y = 5, z = 45), but this did not meet the cluster extent criterion for significance.
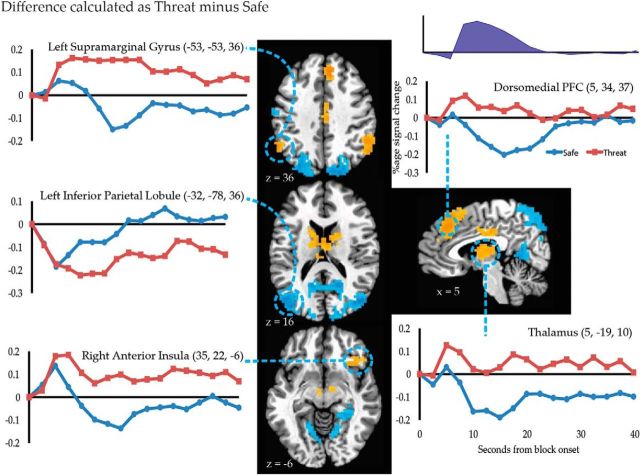
Differences became more widespread during the intermediate temporal factor (Fig. 6; Table 5). Threat increased signal in regions that have previously been linked to “anxious anticipation” (e.g., right anterior insula), striatum, and regions of the executive control network (e.g., supramarginal gyrus, dorsomedial PFC, anterior thalamus, and caudate head). Threat decreased responses within task-negative regions (e.g., bilateral inferior parietal lobule, precuneus, and parahippocampal gyrus).
Figure 6.
The effect of threat on activation during the second temporal factor. Brain maps depict the result of univariate tests (threat vs safe) during the second temporal component. Statistical maps depict effects with corrected p < 0.05. The average evoked responses locked to the onset of threat and safe blocks are depicted for several key regions.
Table 5.
| Region | Cluster extent | Talairach coordinates of peak |
Peak statistic, t (23) | ||
|---|---|---|---|---|---|
| x | y | z | |||
| Intermediate temporal factor: threat > safe | |||||
| Posterior cingulate | 422 | 5 | −20 | 33 | 5.25 |
| Thalamus | −1 | −17 | 11 | 4.07 | |
| Left caudate | −8 | −1 | 16 | 4.47 | |
| Right caudate | 10 | −1 | 16 | 4.11 | |
| Left BNST | −5 | −6 | 1 | 4.87 | |
| Right BNST | 8 | −4 | 5 | 4.32 | |
| Ventral tegmental area | −4 | −9 | −7 | 3.67 | |
| 10 | −9 | −7 | 3.74 | ||
| dmPFC | 268 | 8 | 29 | 50 | 6.80 |
| 10 | 36 | 31 | 5.52 | ||
| Right Supramarginal gyrus | 157 | 53 | −47 | 33 | 5.18 |
| Left Supramarginal gyrus | 55 | −53 | −53 | 36 | 5.25 |
| Right anterior insula, inferior frontal gyrus | 45 | 35 | 23 | −7 | 5.31 |
| Intermediate temporal factor: safe > threat | |||||
| Left IPL | 1443 | −32 | −74 | 30 | −7.23 |
| Right IPL | 31 | −77 | 25 | −4.92 | |
| Precuneus | −1 | −64 | 44 | −4.33 | |
| Left postcentral | −51 | −20 | 46 | −4.01 | |
| Left precentral | −31 | −32 | 50 | −3.93 | |
| Right fusiform | 449 | 26 | −44 | −16 | −5.52 |
| Right lingual gyrus | 14 | −44 | −2 | −4.81 | |
| Precuneus | −1 | −56 | 10 | −4.93 | |
| Left lingual gyrus | 65 | −14 | −59 | −7 | −4.05 |
| Right postcentral gyrus | 64 | 23 | −35 | 63 | −4.39 |
| Right precentral gyrus | 46 | 44 | −20 | 51 | −4.59 |
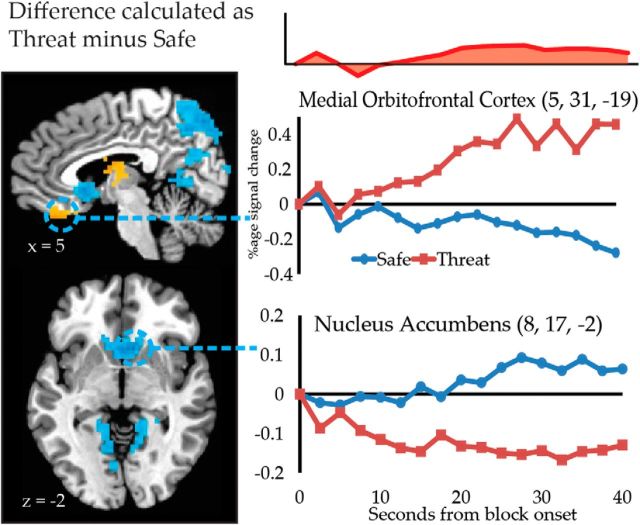
Many of the differences between threat and safe blocks observed during the intermediate temporal factor persisted into the late temporal factor (Table 6), such as increased responses with threat in the right caudate and thalamus, and decreased responses with threat in the inferior parietal lobule and precuneus. However, activation differences also appeared in new regions (Fig. 7); responses increased with threat in the medial orbitofrontal cortex and decreased with threat in the ventral striatum, including locations consistent with the nucleus accumbens.
Table 6.
| Region | Cluster extent | Talairach Coordinates of peak |
Peak statistic, t (23) | ||
|---|---|---|---|---|---|
| x | y | z | |||
| Late temporal factor: threat > safe | |||||
| Right caudate | 85 | 14 | 2 | 24 | 6.04 |
| Right thalamus | 4 | −13 | 10 | 3.55 | |
| 9 | −20 | 5 | 3.9 | ||
| Right supramarginal gyrus | 70 | −53 | −47 | 33 | 4.86 |
| Medial orbitofrontal cortex | 46 | −2 | 38 | −22 | 4.70 |
| Late temporal factor: safe > threat | |||||
| Left SPL | 1865 | 20 | 71 | 39 | −7.15 |
| Right SPL | −22 | 68 | 37 | −3.84 | |
| Left IPL | 47 | 71 | 17 | −3.95 | |
| Right IPL | −43 | 74 | 16 | −4.25 | |
| Precuneus | −7 | 56 | 40 | −5.15 | |
| Left postcentral | 51 | 20 | 46 | −4.01 | |
| Left precentral | 31 | 32 | 50 | −3.93 | |
| Right accumbens area | 228 | 8 | 14 | −1 | −5.78 |
| Left accumbens area | −10 | 16 | −4 | −4.99 | |
| Left amygdala | −10 | −1 | −17 | 4.83 | |
| Ventral striatum | −19 | 10 | −13 | −4.08 | |
| 14 | 8 | −10 | −4.02 | ||
Figure 7.
The effect of threat on activation during the third temporal factor. Brain maps depict the result of univariate tests (threat vs safe) during the third temporal component differs between the threat and safe conditions. Statistical maps depict effects with corrected p < 0.05. The average evoked responses locked to the onset of threat and safe blocks are depicted for medial OFC and nucleus accumbens.
Effect of threat on responses in BNST and amygdala
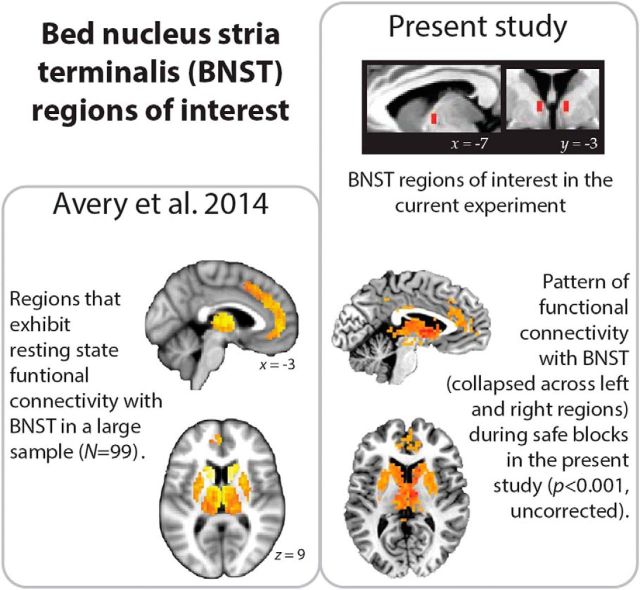
Figure 8 depicts the regions of interest for the left and right BNST. Given the challenge in imaging such a small structure, we compared the pattern of functional connectivity observed in these regions to those from a recently published paper that investigated the BNST with a large sample (N = 99) (Avery et al., 2014). The pattern of resting-state functional connectivity obtained by Avery et al. (2014) is very similar to the one observed here using our BNST ROIs (during safe blocks to better approximate the resting state; Fig. 8).
Figure 8.
Depiction of mask used for defining the BNST in the present study (top right). The pattern of resting state functional connectivity from a previously published paper (images adapted from Avery et al., 2014) is consistent with those observed between our BNST regions and the rest of the brain during safe blocks.
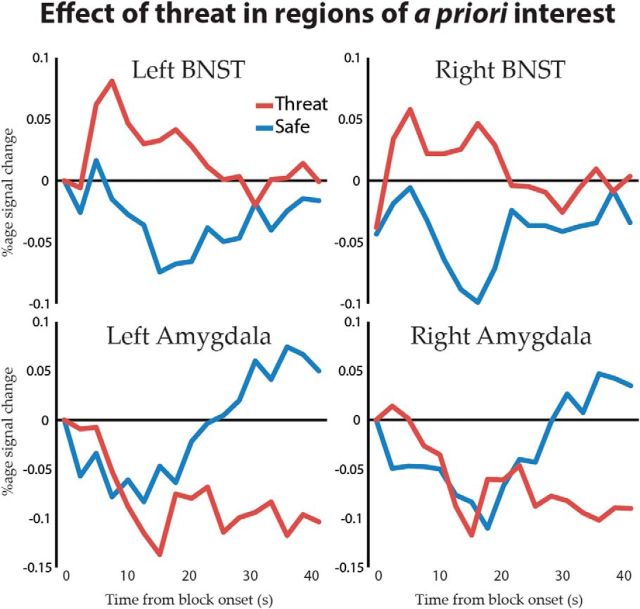
In the BNST (Fig. 9), responses increased during the intermediate period of threat blocks in the right (Fig. 9; t(23) = 2.61, p = 0.016) and left (t(23) = 3.00, p = 0.006) hemispheres, consistent with findings during extended aversive manipulations (Mobbs et al., 2010; Somerville et al., 2010; Alvarez et al., 2011). The left BNST exhibited a trend toward sustained signal increase under threat during the late temporal factor (t(23) = 1.85, p = 0.077); effects of threat were not detected for any other temporal factor in either BNST (ps > 0.11). Signal in the left amygdala decreased during the late temporal factor (t(23) = −4.01, p < 0.001), and a trend-level decrease was detected in the right amygdala (t(23) = −1.80, p = 0.085); effects of threat were not detected for any other temporal factor in either amygdala (p > 0.14).
Figure 9.
Average response in the left and right amygdala and BNST locked to the onset of threat and safe blocks.
Effect of threat on network measures during each temporal factor
We probed network-based properties of functional connectivity focusing on the amygdala, BNST and three well studied large-scale networks, namely, the salience, the executive control, and the task-negative networks (see Materials and Methods; we excluded the amygdala from the salience network to study its properties separately). To gauge the potential for communication within and between networks, we determined network measures of efficiency and betweenness based on the analysis of information flow (Missiuro et al., 2009). Increased efficiency within a network reflects increases in functional connectivity involving the edges of that network; increased efficiency between networks reflects increases in the functional connectivity of edges linking the two networks; increased betweenness of a network suggests that the nodes in that network participate more heavily in the functional connections between other networks (i.e., they become more “central”).
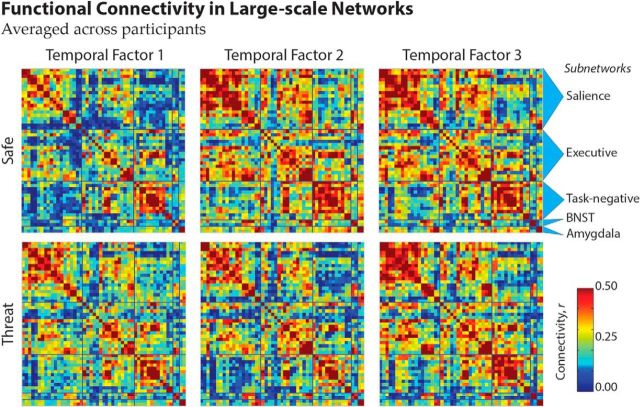
Figure 10 shows functional connectivity within and between networks for the three temporal periods, and Figure 11 depicts how threat alters network structure. During the first temporal component, threat increased the salience network's within-network efficiency (z = 2.77, p = 0.010) and between-network efficiency (z = 1.95, p = 0.046), consistent with Hermans et al. (2011) finding of increased salience network connectivity while in an “anxious state” (watching a horror movie). Decreased betweenness in the executive network was also detected (z = −2.33, p = 0.047), suggesting that it becomes relatively less central for the communication between other networks. No other changes to efficiency within (|z| < 1.12, p > 0.302) or between networks (|z| < 1.44, p > 0.120) was detected; or network betweenness (|z| < 1.58, p > 0.247).
Figure 10.
Average functional connectivity between regions across participants during threat and safe blocks for each of the three temporal factors.
Figure 11.
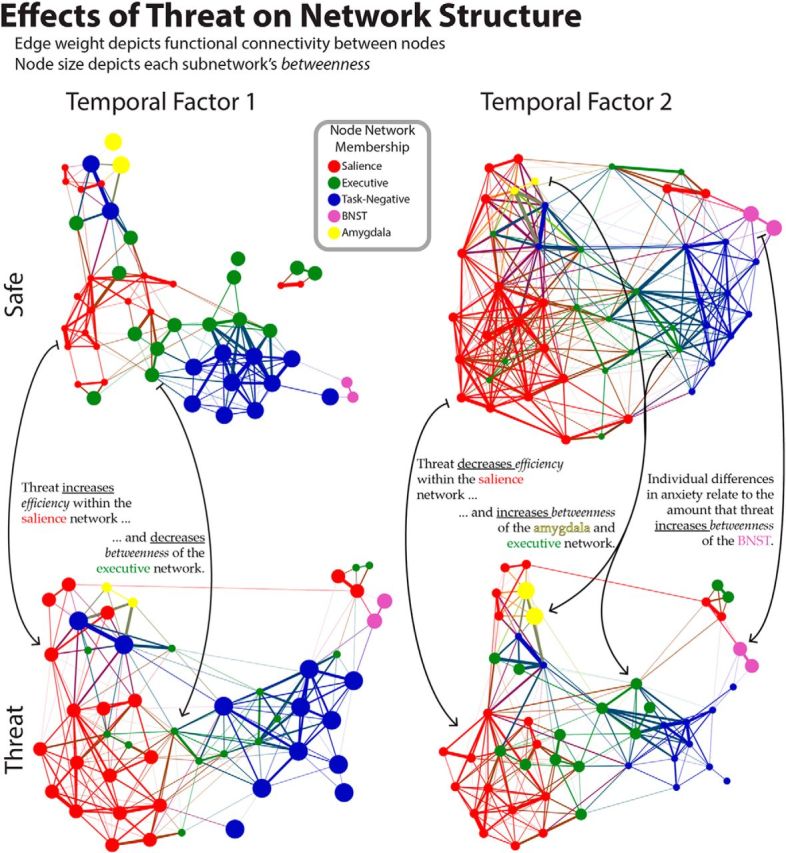
Force-layout depiction of the network structure in each condition (safe, threat) for the first and second temporal factors. Nodes are colored according to their network, and edge width corresponds to the magnitude of functional connectivity. Node size depicts the betweenness centrality for that network. For visualization purposes, edges with connectivity less than r = 0.35 were removed, and nodes that were fully disconnected at this threshold are not depicted. Layout was created using ForceAtlas 2 in Gephi 0.8 β.
The effects of threat on network properties were mostly reversed during the second temporal factor. Threat decreased within-network efficiency for the salience (z = −2.82, p = 0.007), executive (z = −1.79, p = 0.096), and task-negative networks (z = −2.45, p = 0.020); it also decreased the between-network efficiency for all networks (|z| > 1.93, p < 0.043). Importantly, threat increased network betweenness of the amygdala network (z = 2.56, p = 0.023); a trend level increase in betweenness of the executive network was also detected (z = 2.23, p = 0.058). During the third temporal factor, no significant effects were detected.
Finally, note that although signal related to the delivery of physical shock was regressed out, it is possible that responses to shock might have contributed to the reported effects. Thus, we re-ran network analyses after excluding trials where the temporal factor of interest overlapped with physical shock delivery. This resulted in a reduced dataset (with 10–12 threat blocks per participant), but the changes to network efficiency and betweenness were qualitatively preserved in the salience network, executive network, and the amygdala.
Relationship of self-reported anxiety to threat-related changes in network properties
We focused on individual differences in self-reported anxiety and network properties of the BNST and amygdala. We reasoned that if these structures influence the flow of signals during threat, their betweenness scores should be altered. Indeed, during the intermediate temporal window, a threat by anxiety interaction was detected in the BNST (z = 2.45, p = 0.029) but not the amygdala (z = 0.05, p = 0.956). Thus, the extent to which threat increased the betweenness of the BNST was greater for participants with high relative to low self-reported anxiety. No effects were detected in the first or third temporal windows.
Discussion
The present study sought to understand the evolution of functional MRI responses as participants entered into threat (“anxiety” provoking) periods relative to safety. To help discover the structure of the responses without making assumptions of response shape, we used factor analysis. We found that three temporal factors were sufficient to describe brain responses: an initial transient temporal factor, an intermediate temporal factor, and a relatively sustained late temporal factor. Network analysis for each temporal factor revealed changes in brain network organization as participants experienced threat. These findings highlight the need to characterize how network organization unfolds with time.
Effects of threat on responses and functional connectivity during the initial transient response
Transient responses to the onset of both safe- and threat-blocks increased in the salience network and visual regions, but decreased within the task-negative network. These results are consistent with previous findings that a salience network centered on the anterior insula is responsible for allocating attention toward motivationally salient stimuli (Seeley et al., 2007; Menon and Uddin, 2010) and a task-negative network that deactivates when task demands require attending to external stimuli (Gusnard et al., 2001; Fox et al., 2005; Buckner et al., 2008). Surprisingly, we detected minimal activation differences between threat and safe during this initial temporal factor. We suspect that this result may be attributable to the fact that both block onsets were motivational; the onset of threat blocks for obvious reasons and the onset of safe blocks because they provided a safety signal (Christianson et al., 2011).
However, differences between threat and safe were apparent in this early time window when using network analysis. Specifically, the onset of a threat block increased efficiency within the salience network and decreased the betweenness of the executive control network. This suggests that threat altered communication within the salience network, as well as the extent to which the executive control network facilitated communication between other networks. Thus, signaling within the salience network may have become more effective, as reflected in the tighter correlation between pairs of regions in this network. In addition, the executive network may have become more segregated from communication between other networks.
Effects of threat on responses and functional connectivity during the intermediate period
Several of the regions that exhibited increased signal under threat during the intermediate temporal window, including the thalamus, caudate, and supramarginal gyrus, participate in the executive network; several of the regions that decreased signal under threat, including the inferior parietal lobule and precuneus, participate in the task-negative network. Previous studies have reported threat-related decreases across task-negative regions (Choi et al., 2012) and the relationship between executive and task-negative networks is typically antagonistic (Fox et al., 2005). It is thus reasonable that threat has opposing effects on these two systems. Additional threat-related signal increases during this temporal factor were found in the right anterior insula and dorsomedial PFC. The right anterior insula is suggested to play an important role in “balancing” the activation of executive and task-negative networks (Sridharan et al., 2008), and the dorsomedial PFC is implicated in the processing of instructed threat and/or appraisal of threat (Mechias et al., 2010). Together, these two regions likely contribute to determining whether the organism is in a threatening context and may be involved in shifting the balance between large-scale networks to favor activation of the executive network over the task-negative network.
The involvement of the BNST in the processing of extended threat has been extensively discussed by Davis et al. (2010), who link this structure to situations involving a “long-lasting state of apprehension”. Here, we observed responses in a putative BNST site that were sustained during the intermediate period. Some evidence of BNST involvement during the late period was also observed, albeit only at a trend level (p = 0.077). Although speculative, it is possible that the late period also partly signaled upcoming safety because threat and safe blocks always alternated; thus, “apprehension” may have been partly offset by impending “relief”. Of course, other neuroimaging studies have also reported responses in putative BNST sites during threat (Somerville et al., 2010; Alvarez et al., 2011; Grupe et al., 2013).
In terms of network level changes, threat decreased efficiency in the salience network during this temporal factor, opposite to the effect detected during the initial period. Thus, transient increases in connectivity in the salience network are not sustained for the duration of the anxious state, highlighting the need to characterize how network organization unfolds with time. This finding is relevant in the context of the important report by Hermans et al. (2011), who described greater salience network connectivity during periods of anxiety associated with watching an aversive movie. Given the present results, we speculate that their findings may have depended on recurring transient processes, such as responses to emotionally salient objects in the movie (Lang et al., 1998), or anxiety-induced alterations of early perceptual processes (Shackman et al., 2011).
Network-level effects of threat were detected involving both the amygdala and BNST. During the intermediate period amygdala betweenness increased, leading to the working hypothesis that the amygdala may be involved during prolonged aversive states by influencing the communication between brain networks more so than by generating enhanced responses. Naturally, more direct measurements and/or manipulations, such as those possible with optogenetic techniques, are needed to test this possibility. Although a main effect of threat on BNST betweenness was not detected during the intermediate period, the effect of threat on BNST betweenness was modulated by anxiety scores; greater increases in betweenness were observed for participants with high-anxiety relative to low-anxiety. Others have reported that individual differences in self-reported anxiety are related to BNST function (Somerville et al., 2010). Last, although the high and low anxiety groups were defined using self-reported state anxiety, the present data cannot dissociate this effect from trait anxiety. A trait-anxiety questionnaire administered ∼1 week before the experiment revealed that the majority of high state-anxiety participants (i.e., 9 of 11) also reported high trait-anxiety.
Effects of threat on responses and functional connectivity during the late sustained period
Several of the threat effects on executive control and task-negative regions from the intermediate temporal factor were preserved for the late, sustained temporal factor. However, the extended duration of the anticipation period used uncovered several effects that only appeared during the late period, such as threat increasing signals in the medial orbitofrontal cortex and decreasing signals in a location consistent with the nucleus accumbens. Dopaminergic midbrain projections are particularly engaged during situations of uncontrollable threat (Cabib and Puglisi-Allegra, 1994; Maier et al., 2006), and intriguingly, the effect of threat on medial orbitofrontal cortex and accumbens resembles the effect of dopamine release in related structures of mice after they were subjected to extended uncontrollable stress (Cabib and Puglisi-Allegra, 1994); specifically, stress increased the amount of dopamine released in frontal cortex and decreased the amount of dopamine released in the accumbens.
The role of amygdala activity in prolonged aversive states is unclear. However, contrary to the notion that the amygdala is involved primarily in phasic fear (Davis et al., 2010; Alvarez et al., 2011), we observed sustained changes to amygdala connectivity and activation during extended aversive states. Threat altered amygdala connectivity during the second temporal factor (increasing network betweenness) and decreased amygdala activation during the third temporal factor. During extended aversive states, human studies have reported decreased amygdala responses at times (Pruessner et al., 2008; Wager et al., 2009; Choi et al., 2012), and here we observe sustained decreases in the left amygdala and less robustly in the right amygdala. This is consistent with previously reported asymmetries in amygdala function where the left amygdala is more sensitive than the right amygdala to verbally instructed threat and protracted stimuli (McMenamin and Marsolek, 2013).
Conclusions
Our analyses reveal that anxious states result in transient and sustained changes to evoked responses and functional connectivity within multiple brain networks. Some of our main findings are summarized next. (1) Transitioning into a state of anxious anticipation triggered an initial transient response in regions belonging to the salience network; notably, network-level measures indicated that threat altered “signal communication” within the salience network, and between this network and other networks considered here. (2) The transient response was followed by an intermediate period during which: (a) threat increased signals in regions thought to be involved in prolonged aversive states, including the anterior insula and putative BNST; (b) network efficiency decreased for all networks considered; and (c) the amygdala became more central (i.e., increased network betweenness) during threat; the BNST also became more central for participants with greater anxiety. 3) Finally, responses during the late sustained period exhibited several of the same effects of threat seen during the intermediate period, in particular in regions of the executive and task-negative networks. In all, our study unraveled a progression of responses and network-level changes due to sustained threat. In particular, our results reveal how network organization unfolds with time during periods of anxious anticipation.
Footnotes
This work was supported in part by the National Institute of Mental Health (MH071589 to L.P.).
The authors declare no competing financial interests.
References
- Abdi H. Encyclopedia for research methods for the social sciences. Thousand Oaks, CA: Sage; 2003. Factor rotations in factor analyses; pp. 792–795. [Google Scholar]
- Alvarez RP, Chen G, Bodurka J, Kaplan R, Grillon C. Phasic and sustained fear in humans elicits distinct patterns of brain activity. Neuroimage. 2011;55:389–400. doi: 10.1016/j.neuroimage.2010.11.057. [DOI] [PMC free article] [PubMed] [Google Scholar]
- Avery SN, Clauss JA, Winder DG, Woodward N, Heckers S, Blackford JU. BNST neurocircuitry in humans. Neuroimage. 2014;91:311–323. doi: 10.1016/j.neuroimage.2014.01.017. [DOI] [PMC free article] [PubMed] [Google Scholar]
- Bach DR, Flandin G, Friston KJ, Dolan RJ. Time-series analysis for rapid event-related skin conductance responses. J Neurosci Methods. 2009;184:224–234. doi: 10.1016/j.jneumeth.2009.08.005. [DOI] [PMC free article] [PubMed] [Google Scholar]
- Buckner RL, Andrews-Hanna JR, Schacter DL. The brain's default network: anatomy, function, and relevance to disease. Ann N Y Acad Sci. 2008;1124:1–38. doi: 10.1196/annals.1440.011. [DOI] [PubMed] [Google Scholar]
- Cabib S, Puglisi-Allegra S. Opposite responses of mesolimbic dopamine system to controllable and uncontrollable aversive experiences. J Neurosci. 1994;14:3333–3340. doi: 10.1523/JNEUROSCI.14-05-03333.1994. [DOI] [PMC free article] [PubMed] [Google Scholar]
- Cattell RB. The scree test for the number of factors. Multivariate Behav Res. 1966;1:245–276. doi: 10.1207/s15327906mbr0102_10. [DOI] [PubMed] [Google Scholar]
- Choi JM, Padmala S, Pessoa L. Impact of state anxiety on the interaction between threat monitoring and cognition. Neuroimage. 2012;59:1912–1923. doi: 10.1016/j.neuroimage.2011.08.102. [DOI] [PMC free article] [PubMed] [Google Scholar]
- Christianson JP, Jennings JH, Ragole T, Flyer JG, Benison AM, Barth DS, Watkins LR, Maier SF. Safety signals mitigate the consequences of uncontrollable stress via a circuit involving the sensory insular cortex and bed nucleus of the stria terminalis. Biol Psychiatry. 2011;70:458–464. doi: 10.1016/j.biopsych.2011.04.004. [DOI] [PMC free article] [PubMed] [Google Scholar]
- Cox RW. AFNI: software for analysis and visualization of functional magnetic resonance neuroimages. Comput Biomed Res. 1996;29:162–173. doi: 10.1006/cbmr.1996.0014. [DOI] [PubMed] [Google Scholar]
- Cribben I, Haraldsdottir R, Atlas LY, Wager TD, Lindquist MA. Dynamic connectivity regression: determining state-related changes in brain connectivity. Neuroimage. 2012;61:907–920. doi: 10.1016/j.neuroimage.2012.03.070. [DOI] [PMC free article] [PubMed] [Google Scholar]
- Davis M, Walker DL, Miles L, Grillon C. Phasic vs sustained fear in rats and humans: role of the extended amygdala in fear vs anxiety. Neuropsychopharmacology. 2010;35:105–135. doi: 10.1038/npp.2009.109. [DOI] [PMC free article] [PubMed] [Google Scholar]
- Desikan RS, Ségonne F, Fischl B, Quinn BT, Dickerson BC, Blacker D, Buckner RL, Dale AM, Maguire RP, Hyman BT, Albert MS, Killiany RJ. An automated labeling system for subdividing the human cerebral cortex on MRI scans into gyral based regions of interest. Neuroimage. 2006;31:968–980. doi: 10.1016/j.neuroimage.2006.01.021. [DOI] [PubMed] [Google Scholar]
- Destrieux C, Fischl B, Dale A, Halgren E. Automatic parcellation of human cortical gyri and sulci using standard anatomical nomenclature. Neuroimage. 2010;53:1–15. doi: 10.1016/j.neuroimage.2010.06.010. [DOI] [PMC free article] [PubMed] [Google Scholar]
- Fox MD, Snyder AZ, Vincent JL, Corbetta M, Van Essen DC, Raichle ME. The human brain is intrinsically organized into dynamic, anticorrelated functional networks. Proc Natl Acad Sci U S A. 2005;102:9673–9678. doi: 10.1073/pnas.0504136102. [DOI] [PMC free article] [PubMed] [Google Scholar]
- Good PI. Permutation, parametric and bootstrap tests of hypotheses. Ed 3. Huntington Beach, CA: Springer; 2005. [Google Scholar]
- Greicius MD, Krasnow B, Reiss AL, Menon V. Functional connectivity in the resting brain: a network analysis of the default mode hypothesis. Proc Natl Acad Sci U S A. 2003;100:253–258. doi: 10.1073/pnas.0135058100. [DOI] [PMC free article] [PubMed] [Google Scholar]
- Greicius MD, Supekar K, Menon V, Dougherty RF. Resting-state functional connectivity reflects structural connectivity in the default mode network. Cereb Cortex. 2009;19:72–78. doi: 10.1093/cercor/bhn059. [DOI] [PMC free article] [PubMed] [Google Scholar]
- Grupe DW, Oathes DJ, Nitschke JB. Dissecting the anticipation of aversion reveals dissociable neural networks. Cereb Cortex. 2013;23:1874–1883. doi: 10.1093/cercor/bhs175. [DOI] [PMC free article] [PubMed] [Google Scholar]
- Gusnard DA, Akbudak E, Shulman GL, Raichle ME. Medial prefrontal cortex and self-referential mental activity: relation to a default mode of brain function. Proc Natl Acad Sci U S A. 2001;98:4259–4264. doi: 10.1073/pnas.071043098. [DOI] [PMC free article] [PubMed] [Google Scholar]
- Henckens MJ, van Wingen GA, Joëls M, Fernández G. Time-dependent effects of corticosteroids on human amygdala processing. J Neurosci. 2010;30:12725–12732. doi: 10.1523/JNEUROSCI.3112-10.2010. [DOI] [PMC free article] [PubMed] [Google Scholar]
- Hermans EJ, van Marle HJ, Ossewaarde L, Henckens MJ, Qin S, van Kesteren MT, Schoots VC, Cousijn H, Rijpkema M, Oostenveld R, Fernández G. Stress-related noradrenergic activity prompts large-scale neural network reconfiguration. Science. 2011;334:1151–1153. doi: 10.1126/science.1209603. [DOI] [PubMed] [Google Scholar]
- Hermans EJ, Henckens MJ, Joëls M, Fernández G. Dynamic adaptation of large-scale brain networks in response to acute stressors. Trends Neurosci. 2014;37:304–314. doi: 10.1016/j.tins.2014.03.006. [DOI] [PubMed] [Google Scholar]
- Kaiser HF. The varimax criterion for analytic rotation in factor analysis. Psychometrika. 1958;23:187–200. doi: 10.1007/BF02289233. [DOI] [Google Scholar]
- Kayser J, Tenke CE. Optimizing PCA methodology for ERP component identification and measurement: theoretical rationale and empirical evaluation. Clin Neurophysiol. 2003;114:2307–2325. doi: 10.1016/S1388-2457(03)00241-4. [DOI] [PubMed] [Google Scholar]
- Kienast T, Hariri AR, Schlagenhauf F, Wrase J, Sterzer P, Buchholz HG, Smolka MN, Gründer G, Cumming P, Kumakura Y, Bartenstein P, Dolan RJ, Heinz A. Dopamine in amygdala gates limbic processing of aversive stimuli in humans. Nat Neurosci. 2008;11:1381–1382. doi: 10.1038/nn.2222. [DOI] [PubMed] [Google Scholar]
- Kinnison J, Padmala S, Choi JM, Pessoa L. Network analysis reveals increased integration during emotional and motivational processing. J Neurosci. 2012;32:8361–8372. doi: 10.1523/JNEUROSCI.0821-12.2012. [DOI] [PMC free article] [PubMed] [Google Scholar]
- Lang PJ, Bradley MM, Fitzsimmons JR, Cuthbert BN, Scott JD, Moulder B, Nangia V. Emotional arousal and activation of the visual cortex: an fMRI analysis. Psychophysiology. 1998;35:199–210. doi: 10.1111/1469-8986.3520199. [DOI] [PubMed] [Google Scholar]
- Mai JK, Assheuer J, Paxinos G. Atlas of the human brain. London: Academic; 1997. [Google Scholar]
- Maier SF, Amat J, Baratta MV, Paul E, Watkins LR. Behavioral control, the medial prefrontal cortex, and resilience. Dialogues Clin Neurosci. 2006;8:397–406. doi: 10.31887/DCNS.2006.8.4/smaier. [DOI] [PMC free article] [PubMed] [Google Scholar]
- Maris E, Oostenveld R. Nonparametric statistical testing of EEG- and MEG-data. J Neurosci Methods. 2007;164:177–190. doi: 10.1016/j.jneumeth.2007.03.024. [DOI] [PubMed] [Google Scholar]
- McMenamin BW, Marsolek CJ. Can theories of visual representation help to explain asymmetries in amygdala function? Cogn Affect Behav Neurosci. 2013;13:211–224. doi: 10.3758/s13415-012-0139-1. [DOI] [PMC free article] [PubMed] [Google Scholar]
- Mechias ML, Etkin A, Kalisch R. A meta-analysis of instructed fear studies: implications for conscious appraisal of threat. Neuroimage. 2010;49:1760–1768. doi: 10.1016/j.neuroimage.2009.09.040. [DOI] [PubMed] [Google Scholar]
- Menon V, Uddin LQ. Saliency, switching, attention and control: a network model of insula function. Brain Struct Funct. 2010;214:655–667. doi: 10.1007/s00429-010-0262-0. [DOI] [PMC free article] [PubMed] [Google Scholar]
- Missiuro PV, Liu K, Zou L, Ross BC, Zhao G, Liu JS, Ge H. Information flow analysis of interactome networks. PLoS Comput Biol. 2009;5:e1000350. doi: 10.1371/journal.pcbi.1000350. [DOI] [PMC free article] [PubMed] [Google Scholar]
- Mobbs D, Yu R, Rowe JB, Eich H, FeldmanHall O, Dalgleish T. Neural activity associated with monitoring the oscillating threat value of a tarantula. Proc Natl Acad Sci U S A. 2010;107:20582–20586. doi: 10.1073/pnas.1009076107. [DOI] [PMC free article] [PubMed] [Google Scholar]
- Nichols TE, Holmes AP. Nonparametric permutation tests for functional neuroimaging: a primer with examples. Hum Brain Mapp. 2002;15:1–25. doi: 10.1002/hbm.1058. [DOI] [PMC free article] [PubMed] [Google Scholar]
- Pessoa L. The cognitive-emotional brain: from interactions to integration. Cambridge: MIT; 2013. [Google Scholar]
- Pruessner JC, Dedovic K, Khalili-Mahani N, Engert V, Pruessner M, Buss C, Renwick R, Dagher A, Meaney MJ, Lupien S. Deactivation of the limbic system during acute psychosocial stress: evidence from positron emission tomography and functional magnetic resonance imaging studies. Biol Psychiatry. 2008;63:234–240. doi: 10.1016/j.biopsych.2007.04.041. [DOI] [PubMed] [Google Scholar]
- Rubinov M, Sporns O. Complex network measures of brain connectivity: uses and interpretations. Neuroimage. 2010;52:1059–1069. doi: 10.1016/j.neuroimage.2009.10.003. [DOI] [PubMed] [Google Scholar]
- Scott DJ, Heitzeg MM, Koeppe RA, Stohler CS, Zubieta JK. Variations in the human pain stress experience mediated by ventral and dorsal basal ganglia dopamine activity. J Neurosci. 2006;26:10789–10795. doi: 10.1523/JNEUROSCI.2577-06.2006. [DOI] [PMC free article] [PubMed] [Google Scholar]
- Seeley WW, Menon V, Schatzberg AF, Keller J, Glover GH, Kenna H, Reiss AL, Greicius MD. Dissociable intrinsic connectivity networks for salience processing and executive control. J Neurosci. 2007;27:2349–2356. doi: 10.1523/JNEUROSCI.5587-06.2007. [DOI] [PMC free article] [PubMed] [Google Scholar]
- Shackman AJ, McMenamin BW, Maxwell JS, Greischar LL, Davidson RJ. Identifying robust and sensitive frequency bands for interrogating neural oscillations. Neuroimage. 2010;51:1319–1333. doi: 10.1016/j.neuroimage.2010.03.037. [DOI] [PMC free article] [PubMed] [Google Scholar]
- Shackman AJ, Maxwell JS, McMenamin BW, Greischar LL, Davidson RJ. Stress potentiates early and attenuates late stages of visual processing. J Neurosci. 2011;31:1156–1161. doi: 10.1523/JNEUROSCI.3384-10.2011. [DOI] [PMC free article] [PubMed] [Google Scholar]
- Shi C, Davis M. Pain pathways involved in fear conditioning measured with fear-potentiated startle: lesion studies. J Neurosci. 1999;19:420–430. doi: 10.1523/JNEUROSCI.19-01-00420.1999. [DOI] [PMC free article] [PubMed] [Google Scholar]
- Silver NC, Dunlap WP. Averaging correlation coefficients: should fisher's z transformation be used? J Appl Psychol. 1987;72:146–148. doi: 10.1037/0021-9010.72.1.146. [DOI] [Google Scholar]
- Somerville LH, Whalen PJ, Kelley WM. Human bed nucleus of the stria terminalis indexes hypervigilant threat monitoring. Biol Psychiatry. 2010;68:416–424. doi: 10.1016/j.biopsych.2010.04.002. [DOI] [PMC free article] [PubMed] [Google Scholar]
- Spielberger CD, Gorsuch RL, Lushene RE. Manual for the state-trait anxiety inventory. Palo Alto, CA: Consulting Psychologists; 1970. [Google Scholar]
- Sridharan D, Levitin DJ, Menon V. A critical role for the right fronto-insular cortex in switching between central-executive and default-mode networks. Proc Natl Acad Sci U S A. 2008;105:12569–12574. doi: 10.1073/pnas.0800005105. [DOI] [PMC free article] [PubMed] [Google Scholar]
- Talairach J, Tournoux P. Co-planar stereotaxis atlas of the human brain. New York: Thieme Medical; 1988. [Google Scholar]
- Thomason ME, Hamilton JP, Gotlib IH. Stress-induced activation of the HPA axis predicts connectivity between subgenual cingulate and salience network during rest in adolescents. J Child Psychol Psychiatry. 2011;52:1026–1034. doi: 10.1111/j.1469-7610.2011.02422.x. [DOI] [PMC free article] [PubMed] [Google Scholar]
- Vanhaudenhuyse A, Demertzi A, Schabus M, Noirhomme Q, Bredart S, Boly M, Phillips C, Soddu A, Luxen A, Moonen G, Laureys S. Two distinct neuronal networks mediate the awareness of environment and of self. J Cogn Neurosci. 2011;23:570–578. doi: 10.1162/jocn.2010.21488. [DOI] [PubMed] [Google Scholar]
- Wager TD, Waugh CE, Lindquist M, Noll DC, Fredrickson BL, Taylor SF. Brain mediators of cardiovascular responses to social threat. Neuroimage. 2009;47:821–835. doi: 10.1016/j.neuroimage.2009.05.043. [DOI] [PMC free article] [PubMed] [Google Scholar]
- Walker DL, Toufexis DJ, Davis M. Role of the bed nucleus of the stria terminalis versus the amygdala in fear, stress, and anxiety. Eur J Pharmacol. 2003;463:199–216. doi: 10.1016/S0014-2999(03)01282-2. [DOI] [PubMed] [Google Scholar]
- Westfall PH, Young SS. New York: Wiley; 1993. Resampling-based multiple testing: examples and methods for p-value adjustment. [Google Scholar]


