

Abstract
Humans possess the remarkable ability to search their memory, allowing specific past episodes to be re-experienced spontaneously. Here, we administered a free recall test to 114 neurosurgical patients and used intracranial theta and high-frequency activity (HFA) to identify the spatiotemporal pattern of neural activity underlying spontaneous episodic retrieval. We found that retrieval evolved in three electrophysiological stages composed of: (1) early theta oscillations in the right temporal cortex, (2) increased HFA in the left hemisphere including the medial temporal lobe (MTL), left inferior frontal gyrus, as well as the ventrolateral temporal cortex, and (3) motor/language activation during vocalization of the retrieved item. Of these responses, increased HFA in the left MTL predicted recall performance. These results suggest that spontaneous recall of verbal episodic memories involves a spatiotemporal pattern of spectral changes across the brain; however, high-frequency activity in the left MTL represents a final common pathway of episodic retrieval.
Keywords: ECoG, episodic retrieval, high-frequency activity, memory, theta
Introduction
Neurophysiological studies of free recall have contributed significantly to our understanding of the neural correlates of episodic encoding (Fernández et al., 1999; Fell et al., 2001; Strange et al., 2002; Sederberg et al., 2003; Brassen et al., 2006; Staresina and Davachi, 2006; Burke et al., 2014). Episodic retrieval, on the other hand, is less well studied during free recall because of the technical challenges involved in recording brain activity during spontaneous vocalizations. However, free recall is defined by the uniquely unconstrained retrieval process, which allows an unmatched opportunity to study internal memory search (Polyn et al., 2009). Studies that have overcome the technical hurdles and examined retrieval during free recall have found that information about object categories (Polyn et al., 2005), temporal order (Manning et al., 2011), and semantic meaning (Long et al., 2010; Manning et al., 2012) is reinstated during spontaneous retrieval; such reinstatement typically occurs in the gamma frequency band in electrophysiological recordings (Sederberg et al., 2007). However, very basic questions regarding the electrophysiological changes that accompany spontaneous retrieval remain unknown. For example, where in the brain does spontaneous memory retrieval begin? How does the brain transition from memory search to spontaneous vocalization during free recall? These unanswered questions will help place the more specific findings on memory reinstatement in context.
Episodic retrieval is conceptualized as a multistage cognitive process characterized by memory search, reinstatement, and response production (Tulving, 1983). Thus, the electrophysiological changes that accompany free recall will likely not be related to a single neural signal: instead, there should be several neural correlates of episodic retrieval, which are temporally, and perhaps spatially, distinct. Such a suggestion might help unify disparate neurophysiological signals, which have each been related to the act of retrieving an episodic memory, into a single neurophysiological framework. For example, neural oscillations in the theta band (3–8 Hz) have been found to increase during retrieval for recognition memory (Watrous et al., 2013, for review, see Nyhus and Curran, 2010). Such oscillatory activity has been hypothesized to control the ingress of information into the medial temporal lobe (MTL; Fell and Axmacher, 2011) and to select from multiple contexts for the most appropriate retrieval cue (Ekstrom and Watrous, 2014). In addition, retrieval also correlates with increased neural activation, most often measured using functional magnetic resonance imaging (fMRI), in the MTL, L inferior frontal gyrus (IFG), among others (Badre and Wagner, 2007; Spaniol et al., 2009; Shimamura, 2011).
Each of these neurophysiological signals reflects a component of episodic retrieval, however, it is not known how these individual components work together to recall memories. Our goal in this study was to measure all relevant neurophysiological signals (neural oscillations and regional neural activations) using one modality, and then to investigate the relative spatial-temporal pattern of activation of each signal relative to the other during spontaneous recall. To do so, we recorded intracranial electroencephalography (iEEG) as neurosurgical patients undergoing evaluation for resective epilepsy surgery performed a free recall task.
Materials and Methods
Participants.
Participants with medication-resistant epilepsy underwent a surgical procedure in which grid, strip, and depth electrodes were implanted so as to localize epileptogenic regions. Data were collected over a 15-year period as part of a multicenter collaboration with neurology and neurosurgery departments across the country. Our research protocol was approved by the institutional review board at each hospital and informed consent was obtained from the participants and their guardians. Our final participant pool consisted of 114 patients (46 female; 100 left-language dominant patients). Language dominance was assessed by either the patients' handedness, a clinically administered intracarotid injection of sodium amobarbital (Wada test), or fMRI using a verb generation task (Thomas Jefferson Hospital). Although portions of this dataset were previously reported (Sederberg et al., 2003, 2007; Burke et al., 2014), all of the analyses and results described here are novel.
Free recall task.
Each patient participated in a delayed free-recall task (Fig. 1A) that was administered at the patient's bedside (Geller et al., 2007). In each trial of this task, participants are instructed to study a list of words and are then asked to freely recall as many words as possible. Lists were composed of either 15 (100/114 patients) or 20 common nouns, chosen at random and without replacement from a pool of high-frequency nouns (Fig. 1B). The complete behavioral data from one sample participant are shown in Figure 1B. At the start of each trial, a plus sign appeared at the center of the screen to alert patients to the upcoming word presentation and to encourage them to fixate on the center of the screen (a green square; Fig. 1B). The plus sign appeared for 1600 ms, followed by an 800–1200 ms blank interstimulus interval (ISI). Words were presented sequentially and appeared in capital letters at the center of the screen (red and blue circles during encoding; Fig. 1B). Each word remained on the screen for 1600 ms and was followed by a randomly jittered 800–1200 ms blank ISI. Immediately after each list presentation, patients were given a series of simple arithmetic problems. This end-of-list distractor task served to reduce the large advantage accorded to end-of-list items during recall (Howard and Kahana, 1999). Each problem took the form of A + B + C =??, where A–C were randomly chosen positive integers from the set one through nine (Fig. 1B, Distractor). After patients solved arithmetic problems for at least 20 s, the patients last arithmetic problem was immediately followed by a row of asterisks accompanied by a 300 ms tone signaling the start of the recall period (Fig. 1B, black star).
Figure 1.
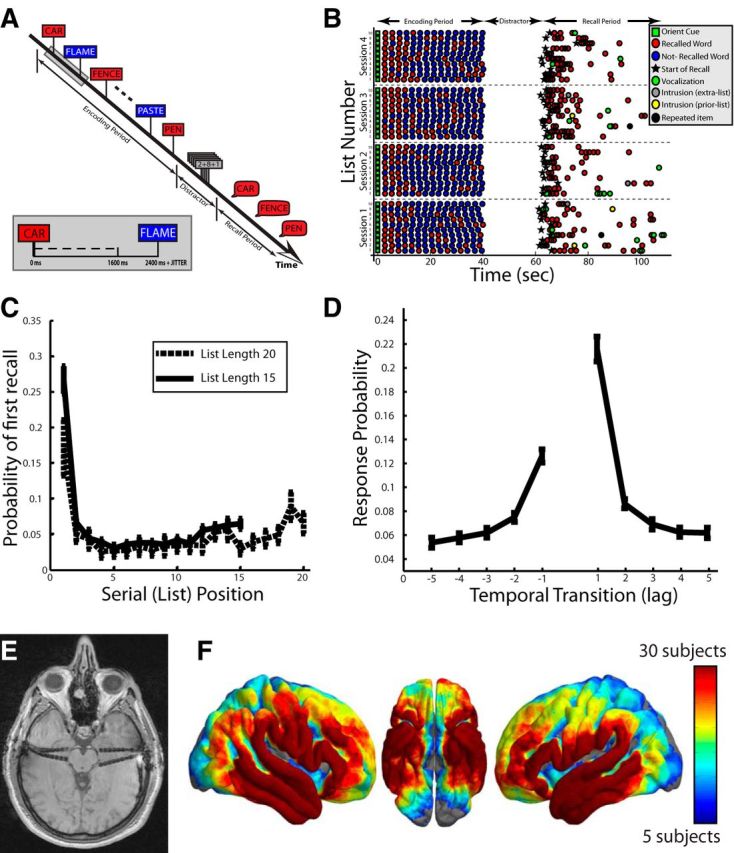
Free recall task. A, In the delayed free recall task, participants are given a list of words, and are then asked to retrieve/vocalize the words in the most recent list. B, Example behavioral data from one participant across four sessions of delayed free recall. C, The probability (y-axis) that a word presented at a given list position (x-axis) was retrieved first (probability of first recall; PFR) during the recall period. Error bars represent ±1 SEM across patients. D, Given a word from a certain list position was retrieved, the probability (y-axis) that the next retrieval was from a word nearby in list position (lag; x-axis). Error bars represent ±1 SEM across patients. E, Example electrode implantation: patient had bilateral depth electrodes (pictured in MRI) and additional cortical subdural electrodes (not visible in image). F, Heat map corresponding to number of patients with electrodes within 12.5 mm of each point across the cortical surface.
Patients were given 45 s to recall list items in any order (standard free-recall instructions). After each session, vocal responses, digitally recorded during the trial, were scored for analysis. Words recalled from the most recent list were considered correct recalls (Fig. 1B, red circles). Recalled words that were not on the most recent list were intrusions, which were either presented to the patient in a previous list (prior-list intrusions; Fig. 1B, yellow-circles) or not presented to the patient at all (extra-list intrusions; Fig. 1B, gray-circles). Only correct recalls were analyzed. To be included for analysis, correct recalls had to be isolated from any other verbal utterance and visual stimuli on the computer screen for 3000 ms before the onset of vocalization until 1500 ms after the onset of vocalization. A verbal utterance was defined as another correctly recalled word, another incorrectly recalled word, any random speech, or any nonverbal response. Across all patients, there were 15,895 total recalls in our dataset. Using our inclusion criteria, we included 3904 (24.56%) of all total recalls. When we loosened the inclusion criteria, all of the main effects of the paper were nonetheless obtained, suggesting that these data are not dependent on choice of inclusion criteria. However, isolating recalled words from verbal utterances by at least 3000 ms before vocalization onset allowed us to examine activity very early before vocalization onset (2000 ms), and ensured analyzed recalls were free of contamination from previous vocalizations by at least 1000 ms.
iEEG recordings.
Clinical circumstances alone determined electrode number and placement. Subdural (grids and strips) and depth contacts were spaced 10 mm and 6–8 mm apart, respectively (Fig. 1E; an example of depth electrode placement). iEEG was recorded using a Bio-Logic, DeltaMed (Natus), Nicolet, Grass Telefactor, or Nihon-Kohden EEG system. Depending on the amplifier and the discretion of the clinical team, the signals were sampled at 200, 256, 400, 500, 512, 1000, 1024, or 2000 Hz. Signals were converted to a bipolar montage by differencing the signals between each pair of immediately adjacent contacts on grid, strip, and depth electrodes (Burke et al., 2013). Signals were resampled at 256 Hz; a notch filter was applied at 60 or 50 Hz. Analog pulses synchronized the electrophysiological recordings with behavioral events. Contact localization was accomplished by coregistering the postoperative CTs with the MRIs using FSL Brain Extraction Tool and FLIRT software packages. The electrodes were manually identified using the postoperative CTs. Then the MRIs were registered to Talairach space, which allowed us to associate standardized Talairach coordinates to each electrode. The spatial distribution of the intracranial contacts is shown in Figure 1F. To identify whether a particular anatomical area exhibited task-related changes in power, we grouped spatially similar electrodes from different participants by segregating Talairach space into 59,496 overlapping 12.5 mm radius spheres spaced every 3 mm (Figs. 2, 3). Only spherical regions that had electrodes from five or more patients were included in analyses.
Figure 2.
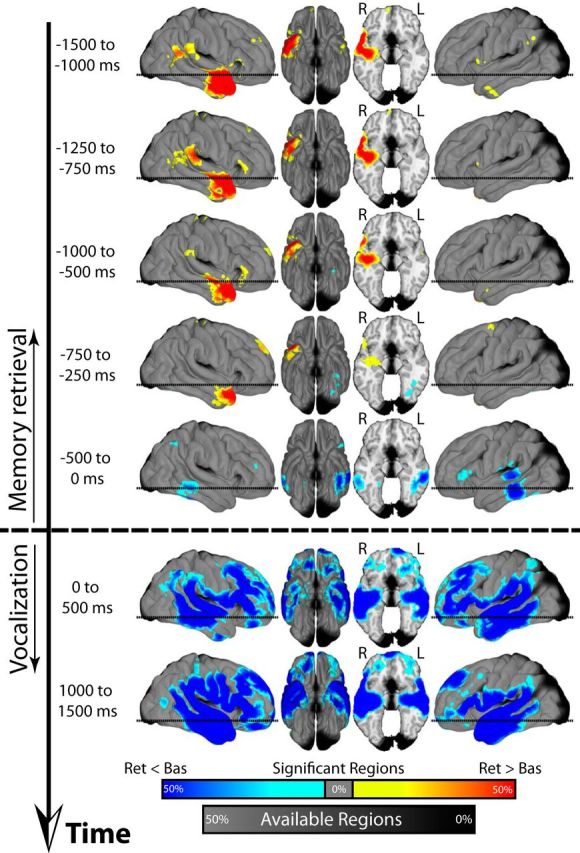
Theta activity (3–8 Hz) across time during retrieval. In each panel, all spherical regions that exhibited a significant (FDR corrected) change in power during spontaneous retrieval are displayed on a three-dimensional brain. The black line to the side of each panel represents time. Power changes reflect a comparison between retrieval (Ret) and a baseline condition (Bas). Increases (Ret > Bas) and decreases (Ret < Bas) in power are shown in red and blue, respectively. The horizontal dashed line on the sagittal views corresponds to the level of the axial cut in the third panel. Color and grayscale renderings represent the percentage of nearby regions exhibiting significant effects and containing more than five patients, respectively. Radiological slice view is shown with right (R) and left (L) hemispheres labeled.
Figure 3.
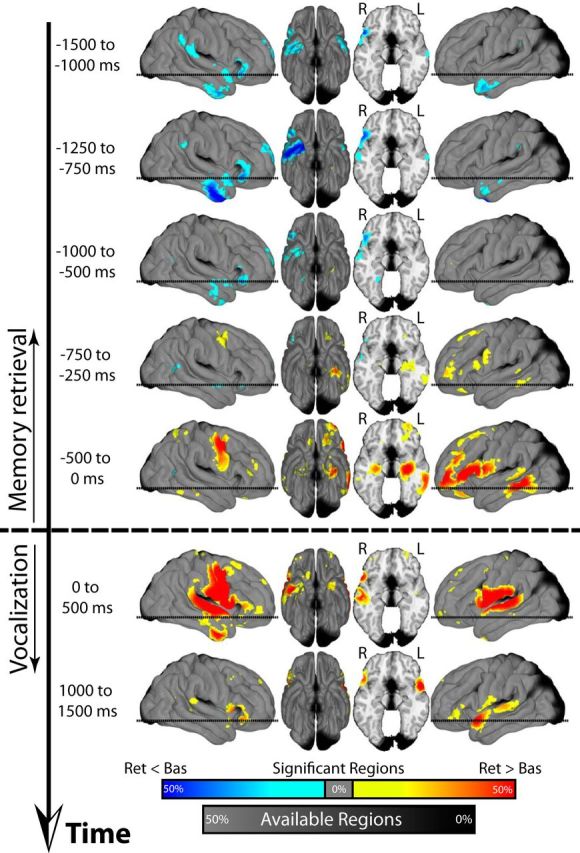
HFA (64–95 Hz) across time during retrieval. Identical plot as in Figure 2 displaying changes in HFA power during retrieval.
Spectral power.
We convolved clips of iEEG (2000 ms before retrieval onset to 2000 ms after onset, plus a 1000 ms flanking buffer) with 30 complex valued Morlet wavelets with center frequencies logarithmically spaced from 2 to 95 Hz (Addison, 2002). We used a value of 7 for the center frequency to bandwidth ratio to maximize the resolution of spectral power in the frequency domain. We squared and log-transformed the wavelet convolutions, and then averaged the resulting log-power traces into 500 ms epochs incremented every 250 ms, yielding 13 total temporal epochs surrounding each correct retrieval onset. For the high-temporal resolution analysis (Fig. 4), each window was incremented every 10 ms. For the correlation analysis in Figure 6, we repeated the power calculation using two large time-windows: a single prevocalization window (2000–250 ms before vocalization onset) and a single postvocalization window (250–2000 ms after vocalization onset). Power was averaged into a theta band (θ; 3–8 Hz) and a high-frequency activity band (HFA; 64–95 Hz). We then z-transformed power values separately for each session using the mean and SD of each electrode's power values sampled every 60 ± 10 s throughout the duration of the session (Burke et al., 2013, 2014). This method allowed us to estimate the mean and SD of each session separately, which corrected for any changes in impedance that occurred for that session. In addition, taking pseudorandom sample times spaced ∼60 s apart (1) maximized the probability that the events comprising the z-distribution represented independent clips of EEG and (2) minimized the probability that such events over-represented one type of cognitive operation (item encoding, stimulus visualization, reading instructions, etc.) over the other.
Figure 4.
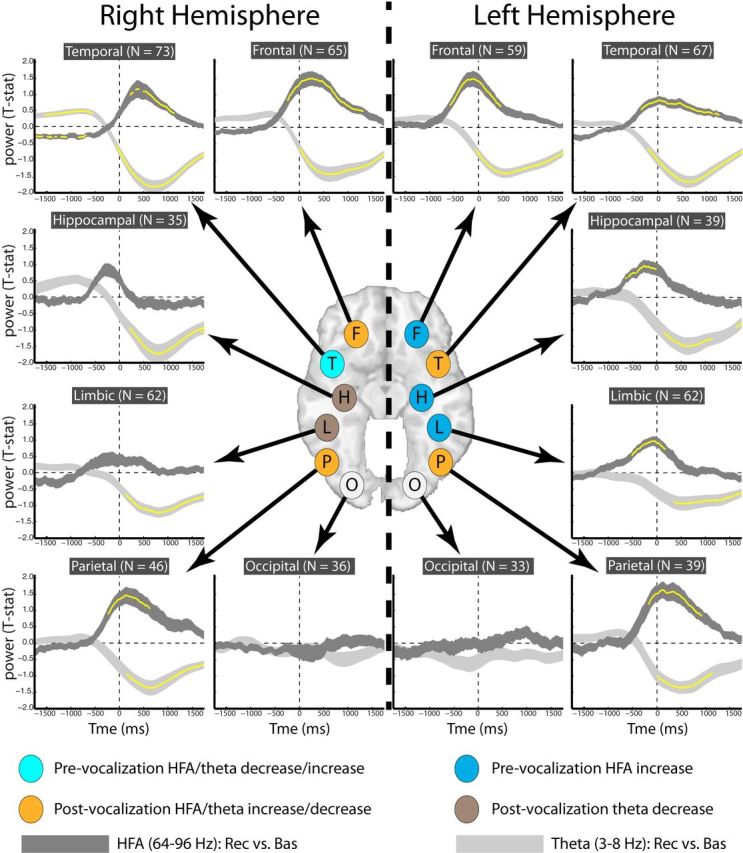
Timing of theta and HFA across ROIs. Each subpanel shows relative power, across time, in both the theta (light gray) and HFA (dark gray) frequency bands during retrieval. The y-axis in each panel represents t-statistics (comparing power during retrieval vs baseline) averaged across patients with electrodes in each ROI; the width of each line is proportional to ±1 SEM. The time on the x-axis corresponds to the midpoint of a 500 ms time epoch, incremented every 10 ms. Yellow asterisks represent significant shifts in power across patient (t test; p < 0.05; Bonferroni corrected across time and frequency band). Each ROI corresponds to a different subpanel. O, Occipital; P, parietal; F, frontal; T, temporal; L, limbic (nonhippocampal); H, hippocampal; N, number of patients in each ROI.
Figure 6.
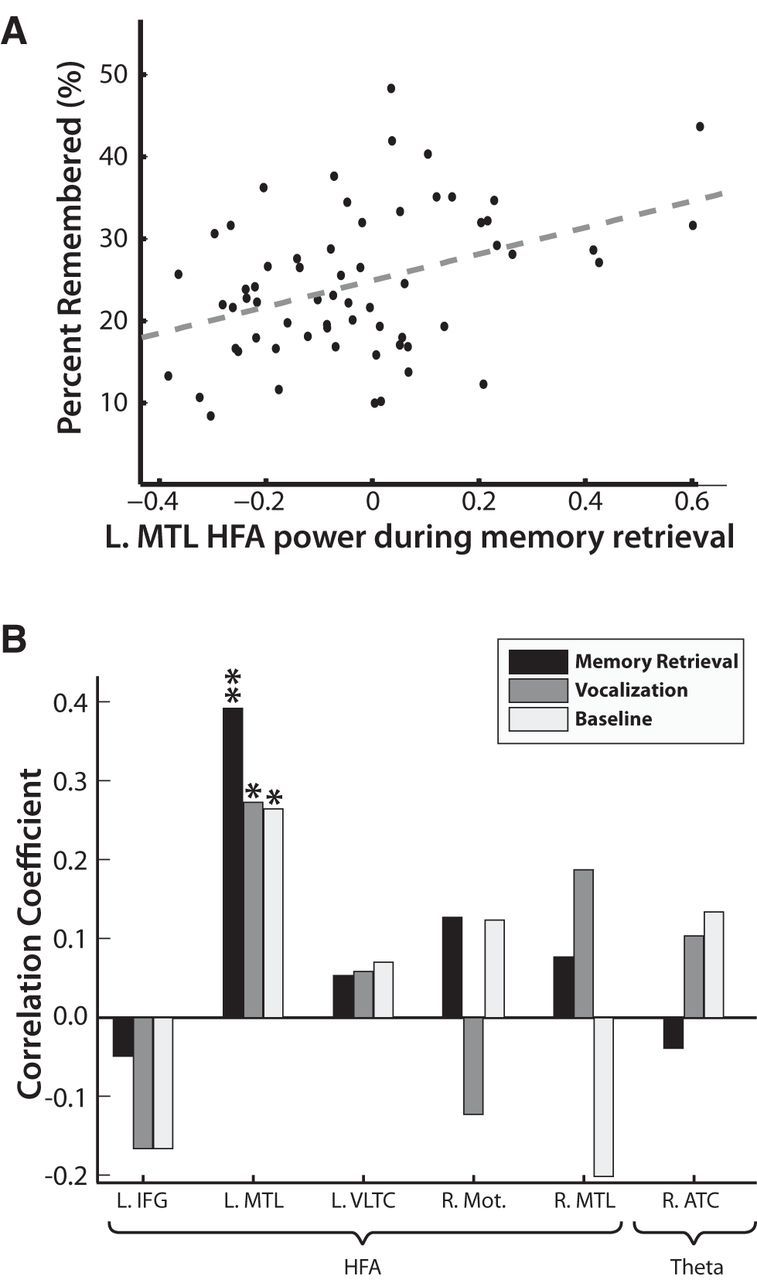
Across patient correlation of power and memory performance. A, For each patient with electrodes in the L MTL, we calculated (1) power in the HFA band (identical to Fig. 6) 2000–250 ms before word presentation and (2) the percentage of correctly recalled items across all sessions. The correlation between these two variables was statistically reliable (r = 0.3911, p = 0.0015). B, We repeated the analysis in A for all ROIs in Figure 5 for power during correct retrievals in the memory retrieval interval (2000–250 ms before vocalization), in the vocalization interval (250–2000 ms after vocalization), as well as for baseline power. HFA power in the L MTL trended toward significance for all three conditions (*p < 0.05), but was only significant after correcting for multiple comparisons during memory retrieval (** FDR corrected, q = 0.05). L, Left; R, right; Motor, motor region.
To investigate item-level activity during retrieval, it is necessary to compare changes in theta and HFA power during successful retrieval relative to a baseline condition. For baseline activity, our goal is to capture the cognitive operation of active, but unsuccessful, memory search in the absence of any response production or visual stimulation. To create this baseline, we first chose points during the recall period in which the participant was unsuccessfully trying to remember (anchor points). These points were time matched to the retrieval events; for every correct recall, we chose anchor points from other lists that fell within 3000 ms of that item's recall time, i.e., the time from the beginning of the recall period to the vocalization onset. If there was any vocal utterance (e.g., another correct recall, incorrect recall, other verbal/nonverbal sound) or visual stimulation within 3000 ms before or after the anchor point, we did not include that EEG clip in the baseline activity, and we chose another anchor point. However, if the surrounding 3000 ms was clear of such utterances, then the baseline period was chosen to be 2000 ms before the anchor point until 1500 ms after the anchor point. Baseline periods did not contain any overlapping EEG. If there was more than one such anchor point that matched a particular correct retrieval event, we randomly selected up to two of these potential anchor points to use in the analysis as baseline events. This minimized the amount of data that we were not analyzing, but maintained a similar timing structure for both the retrieval and the baseline events: a t test comparing the onset times of the baseline and the retrieval events revealed no significant difference across patients (p > 0.05). Across all patients, 7131 baseline events were selected to use in the analysis, which corresponded to an average of 1.91 (0.88 SD) baseline events per trial, and 1.83 baseline events for every retrieval event analyzed.
Statistical procedure.
For Figures 2–4, we compared power during retrieval and baseline conditions by first calculating a t-statistic using an unpaired t test comparing the distribution of z-scored power values for each electrode during retrieval versus baseline conditions for each region, frequency band (HFA and theta), and time interval. For each patient, we then averaged these t-statistics across all electrodes within each region to obtain an averaged t-statistic for each patient for a given region, time interval, and frequency band. To generate a p value for changes in spectral power, we performed a paired t test comparing these across patient distributions to zero (Long et al., 2014). In Figures 2 and 3, we corrected for multiple comparisons across time, region, and frequency band using a false discovery rate (FDR) procedure (q = 0.05, Genovese et al., 2002). In Figure 4, we corrected for multiple comparisons using a Bonferroni correction across time and frequency.
For the correlation analysis (see Fig. 6), for each patient, we averaged z-scored power separately for correct retrievals and baseline events across all electrodes from each particular region-of-interest (ROI). ROIs were selected by identifying discrete clusters of activations in the theta and HFA band in Figures 2 and 3 (see below). We then quantified each patient's overall recall performance as the percentage of words they were able to successfully remember. We then correlated recall performance with (1) average power during the memory retrieval interval, 2000–250 ms before vocalization of a correct recall, (2) average power during the vocalization interval, 250–2000 ms after vocalization of a correct recall, and (3) average power during a baseline interval, 2000–250 ms before the midpoint of the baseline events. We corrected for multiple comparisons using an FDR procedure (q = 0.05) across ROI and power condition.
Topographic plots.
To plot spatial changes in spectral power, we identified spherical regions that exhibited a statistically significant (FDR corrected) increase or decrease in power across participants. At each spherical region, we calculated the percentage of other regions within 12.5 mm that exhibited identical encoding-related effects. Thus, the color map corresponds to the density of the effect: the percentage represents the number of nearby regions that show a significant effect of all possible regions that could show that effect. The maximal color saturation in either direction corresponded to 50% of adjacent spherical regions. We translated these percentages to color saturation and rendered these values onto cortical and subcortical topographical plots in Figures 2 and 3. For the cortical plots, we used the FreeSurfer software package (Fischl, 2012) to generate a cortical surface representation that was representative of our patient population. We did this by generating cortical surface reconstructions using MRIs from the subset of patients in our database from Thomas Jefferson Hospital and the Hospital of the University of Pennsylvania. Specifically, we aggregated these surfaces to generate an average cortical surface representation across these patients (Fischl et al., 1999). Older patient's with MRIs of insufficient resolution and patient's with previous neurosurgical procedures were excluded from the average. For the subcortical plots, we used coordinates from an axial slice through the MTL of a standardized MNI brain from the WFU PickAtlas toolbox (Maldjian et al., 2003).
Colored values were smoothed using a three-dimensional Gaussian kernel (radius = 12.5 mm; σ = 3 mm). We cut off the Gausssian kernel at a radius of 12.5 mm because each sphere aggregated electrodes from a 12.5 mm sphere in 3-D Talairach space. Thus, the visual representation of the spherical region (created by the Gaussian Kernel) was cutoff at 12.5 mm to match the size of the actual region. All regions with fewer than five patients were colored black and were not analyzed. Grayscale rendering in other regions represented the percentage of spherical regions surrounding a given location with at least five patients, and thus represented regions that were analyzed but that did not exhibit significant effects. Only contiguously statistically significant regions (spherical regions flanked by other significant regions in all dimensions) were visualized to identify regions with concentrated clusters of activity.
ROIs.
In the ROI approach (Fig. 4), we segregated electrodes into five anatomical lobes (frontal, temporal, parietal, occipital, and limbic) from each hemisphere to generate 10 mutually exclusive ROIs (Manning et al., 2011, 2012). A clinician experienced in neuroanatomical localization manually reviewed postoperative CT and MRI images to accurately identify all depth contacts located within the hippocampus. A bipolar pair was categorized into two additional hippocampal ROIs (left and right) if at least one contact within the pair was determined to lie within this structure (Burke et al., 2013), yielding 401 hippocampal electrodes from 52 patients.
For Figures 5 and 6, we used the analysis in Figures 2 and 3 as an omnibus test to identify key regions of interest for the raw power calculation in Figure 5. We identified the spherical regions that were activated in Figures 2 and 3, and found all of the electrodes from all patients that contributed to those activations. Specifically, spherical regions from the L MTL, R MTL, L IFG, R anterior temporal cortex (ATC), L ventrolateral temporal cortex (VLTC), and R motor cortex were grouped into larger ROIs for further investigation. Next, we displayed the raw power in these regions for all frequencies separately for correct recalls and baseline events. Raw power was calculated by averaging z-transformed power across all electrodes from each patient in each ROI, and plotting the mean power (with SEs) across all patients (Fig. 5). For the correlation analysis, we used these same ROIs, and correlated the predominate spectral effect from each ROI with memory performance using larger time windows (see Spectral power, above).
Figure 5.

Power in six select ROIs during retrieval. Power (Z-scored) across all frequencies was first averaged, for each patient, across all electrodes in each labeled ROI. The resulting distribution of averaged power values, across all patients in each ROI, is shown separately for the time period in the memory retrieval interval in which the ROI is first active (Table 1) as well as the vocalization interval (250–750 ms after vocalization onset). The red and blue lines represent the averaged power across correct recalls and the baseline period, respectively. The yellow boxes represent the theta (3–8 Hz) and the HFA (64–96 Hz) bands used for all analyses. L, Left; R, right; Motor, motor region.
Results
Our goal was to investigate the extent to which the neurological changes that accompany episodic retrieval can be resolved into distinct temporal stages and anatomical regions. To accomplish this, we administered a delayed free recall test to 114 patients with medication resistant epilepsy (Fig. 1A). Specifically, during free recall, patients are shown a list of 15 or 20 words and then, after 20–25 s of arithmetic distraction, are asked to recall the words out loud. We recorded the patients' responses and precisely marked vocalization onsets during the recall interval (Fig. 1B). Behaviorally, patients saw, on average, 32.04 (23.68) lists and recalled an average of 4.25 (1.57) items per list, resulting in an average recall performance of 23.94% (8.54%; all numbers reported in parentheses reflect SD). Of these recalls, 24.56% were sufficiently isolated from other experimental events (other vocalizations, stimuli onset, etc.) to be included for analysis (see Materials and Methods). Additionally, patients tended to begin retrieval with the first list item (Fig. 1C) and thereafter transitioned to words from neighboring list positions (Fig. 1D). These behavioral effects are manifestations of the laws of primacy (Tulving, 2007) and contiguity (Kahana, 1996), which have been extensively documented in list-learning and list-recall experiments (Kahana, 2012) and suggest that the retrieval dynamics in the epileptic patient population are preserved.
As patients performed the task, they were simultaneously undergoing phase II (intracranial) monitoring for seizure localization using neurosurgically implanted subdural and depth electrodes (Fig. 1E). We collected iEEG from all patients' implanted electrodes (Fig. 1F), and aligned retrieval vocalization times with the recorded iEEG data.
We first investigated how theta activity (3–8 Hz) varied as a function of successful retrieval. Figure 2 shows that theta activity tended to increase during retrieval and these increases were concentrated in the right hemisphere, particularly the right ATC, and to a lesser extent, the right frontal and posterior temporal cortices. This increase in theta during retrieval occurred very early; it was present >1500 ms before patients began to articulate a word (Fig. 2, top). The increase in theta persisted throughout the retrieval period, until immediately before vocalization (Fig. 2; 500–0 ms before vocalization). Throughout this interval, theta activity remained well lateralized to the right hemisphere. To adjudicate between retrieval and motor related effects, we also analyzed theta power in both the immediate postvocalization interval (0–500 ms after vocalization onset) as well as at the end of the vocalization interval (1000–1500 ms after vocalization onset; Fig. 2, bottom). Across almost the entire brain, theta activity during vocalization exhibited a profound decrease in power.
We next similarly analyzed HFA during retrieval (Fig. 3). Initially (1500–750 ms before vocalization), HFA decreased in the right temporal cortex, in the same area where theta activity increased (Fig. 3 compare top 4 panels with Fig. 2). However, starting at ∼1000 ms before vocalization onset, HFA began to increase first in the L IFG and L MTL (750–250 ms before vocalization; Fig. 3) and then in the R MTL and the L VLTC (500–0 ms before vocalization; Fig. 3). There was also a region of activation in the R frontal gyrus along the motor cortex during this time. During vocalization (Fig. 3, bottom two panels), the decrease in theta power was accompanied by an overall increase in HFA that was concentrated near the bilateral central sulcus and superior temporal regions. This pattern of activity is characteristic of the electrophysiological changes that accompany motor, auditory, and language activation (Crone et al., 2001; Miller et al., 2007; Hermes et al., 2014).
To precisely identify the timing of these effects, we categorized electrodes into larger ROIs and then repeated the analyses in Figures 2 and 3 using higher temporal resolution (10 ms spacing between subsequent epochs). Figure 4 displays the results of this high-temporal resolution analysis and confirms that increased theta activity (and decreased HFA) in the right lateral temporal cortex is the first marker of correct retrieval. In addition, the pronounced switch in dynamics from pre-retrieval increased theta/decreased HFA to postvocalization decreased theta/increased HFA can be more clearly seen in the right temporal cortex (RTC). Indeed, theta and HFA switched polarity in the RTC at the exactly the same time point (200 ms before vocalization onset). The timing analysis also revealed regions in which HFA power maximally peaked during the prevocalization interval (albeit closer to vocalization onset), including the left hippocampus, left frontal cortex, and left limbic (nonhippocampal medial temporal lobe). Figure 4 also displays that the occipital cortex exhibited very little change in theta and gamma power during retrieval, which suggests that words were not “revisualized” during retrieval and stands in contrast with previous studies examining the spectral correlates of episodic memory retrieval in occipital regions (Osipova et al., 2006). However, we note that our study had relative sparse coverage in the occipital regions (Fig. 1); definitive claims about activity in the occipital cortex requires future validation from other studies.
Figures 2–4 display the theta and HFA power fluctuations that accompany the spontaneous recall of episodic memories. We next wanted to better characterize these power fluctuations in the memory retrieval interval, and also determine which of these effects was most closely related to memory ability. To accomplish this, we used Figures 2 and 3 as an omnibus test to select six ROIs based on the areas that showed an increase in theta or HFA power: the L MTL, R MTL, L IFG, L VLTC, R ATC, and R motor region. Table 1 displays the time when each of these activations first occurred, the frequency that was elevated in each ROI, the number of patients contributing to each ROI, the location of each ROI in Talairach space, the average t-statistic across patients and electrodes in the ROI, and also a value of effect size (Cohen's D) for each ROI. The effect size was a useful method to evaluate the magnitude of the effect independent of the number of patients that contributed to the ROI. The table shows that the effect sizes range from 0.45 to 0.72, indicating that these effects represent “medium” sized effects (Cohen, 1977).
Table 1.
ROIs
| N | Talairach position |
Freq | Time (ms) | t stat | Cohen's D | |||
|---|---|---|---|---|---|---|---|---|
| x | y | z | ||||||
| R ATC | 74 | 51.3 (8.4) | −9.4 (27.3) | −14.6 (17.8) | Theta | −1500 to −1000 | 5.74 | 0.54 |
| L IFG | 40 | −43.5 (5.2) | 50.6 (6.7) | 9.3 (7.4) | HFA | −250 to −750 | 3.92 | 0.66 |
| L MTL | 63 | −35.6 (7.9) | −25.1 (6.4) | −20.3 (4.6) | HFA | −250 to −750 | 3.86 | 0.45 |
| L VLTC | 60 | −65.7 (3.8) | −41.3 (9.5) | −7.9 (8.5) | HFA | −500 to 0 | 4.47 | 0.63 |
| R Motor | 48 | 53.4 (7.1) | −0.2 (6.6) | 40.8 (13.1) | HFA | −500 to 0 | 5.39 | 0.72 |
| R MTL | 61 | 28.1 (6.3) | −18.2 (5.3) | −20.0 (5.7) | HFA | −500 to 0 | 4.68 | 0.69 |
For each ROI, the Talairach position (in mm along the x-, y-, and z-dimensions), frequency band that is elevated in the region during retrieval, the time that the effect first appears, and the t statistic and effect size (Cohen's D) comparing retrieval to baseline is shown. SDs across patients is shown in parentheses. N, Number of patients in each ROI; L, left; R, right; Motor, motor region; Freq, frequency; stat, statistic.
Using these regions, we first verified that these effects represent activity during the retrieval period, as opposed to confounding shifts in power during the baseline condition. To accomplish this, we examined the raw (z-transformed) power in the six ROIs in Table 1 separately for correct retrievals and baseline events. Figure 5 shows the raw power for each region for two representative time windows: the time window in which it was first activated before vocalization onset (memory retrieval interval; Table 1) and 250–750 ms after vocalization onset (vocalization interval). We briefly note that we observed a pronounced decrease in the alpha/beta band (14–24 Hz) in the L IFG during the memory retrieval interval (Fig. 5). Although activity in the alpha/beta frequency band was not the focus of this study, decreased alpha/beta power in the L IFG during memory processing is a well known result that validated the choice of this ROI (Hanslmayr et al., 2011, 2012; Waldhauser et al., 2012). Figure 5 suggests three main findings. First, during the baseline period, there is slightly more power at lower frequencies (theta) and less power at higher frequencies (HFA). This can be seen from the positive z-scores for theta and the negative z-scores for HFA during the baseline period. This skew in power toward lower frequencies during the baseline period is constant across time and likely reflects effort involved in memory search. Second, independent of the shape of the spectrum during the baseline interval, the rapid fluctuations in power that drive our main findings are caused by spectral activity during the retrieval interval, not the baseline interval, which remains constant across time. Furthermore, the increased theta activity during retrieval reflects increases in theta power above baseline activity (Fig. 5, top). Thus, the theta activity represents a true increase during retrieval, not a decrease during baseline. Third, in the R ATC, although there is increased power up to 13–15 Hz (Fig. 5), the majority of the power increases are concentrated in the theta range (3–8 Hz). This activity stands in contrast with decreases in theta power that occur in the same region during the vocalization period (Fig. 5). During this period, theta activity decreases along with a broad range of frequencies extending from 3 to 35 Hz, including the delta, theta, alpha, beta, and even the low-gamma frequency range. Thus, the decrease in theta power that occurs in the right temporal cortex during the vocalization interval is not limited to the theta regime and is more consistent with a broadband decrease in low-frequency power.
We next sought to correlate the predominate spectral effects in Figures 2 and 3 directly with memory performance. If these effects reflect neural activity directly responsible for memory formation, then the more a patient displays the effect, the more successful that patient should be in retrieving items from memory. Conversely, if these effects reflect processes that are not directly tied to the process of retrieval, then there should be no such correlation. Figure 6A shows a significant correlation (r = 0.3911, p = 0.0015) between HFA power in the L MTL and recall performance for correct retrievals during the memory retrieval interval. In Figure 6B, we repeated this analysis for all ROIs during the memory retrieval time interval, the post-vocalization time interval, and during the baseline events. The only region that directly correlated with memory performance was HFA in the L MTL during the memory retrieval interval (FDR corrected). During both the vocalization and the baseline intervals, the correlation trended toward significance, indicating that residual activity in the L MTL predicted memory performance; however, this activity peaked immediately before the word was vocalized.
Discussion
Episodic retrieval is the hypothesized cognitive process underlying the recall of previously experienced events. Few studies have studied the electrophysiological correlates of retrieval during free recall (Sederberg et al., 2007; Manning et al., 2011, 2012); all of these studies have used a subset of the data reported here. Of these, Sederberg et al. (2007) was the only study to examine item level neural correlates of retrieval (as opposed to metrics of reinstatement), and found that gamma effects increased during retrieval. Here, we build on these findings and show that episodic retrieval can be understood in terms of three distinct electrophysiological stages (Fig. 7): (1) an early stage marked by right temporal cortical theta oscillations, (2) a middle stage characterized by increased HFA in a left hemispheric network consisting of the L MTL, L VLTC, and L IFG, and (3) a final stage marked by motor/language activation during vocalization.
Figure 7.

Summary of main effects. Episodic retrieval is defined by three distinct electrophysiological stages: Left, An early stage, 1000–2000 ms before recall, marked by right temporal cortical theta oscillations; Middle, A middle stage, ∼1000 ms before recall, characterized by increased HFA in a left hemispheric network consisting of the L MTL, L VLTC, and L IFG; and Right, A final stage marked by motor/language increase in HFA (and decrease in theta) during vocalization itself. In each stage, activations (marked in yellow) refer to increases in power during spontaneous recall; only high-frequency activity in the Left MTL in the second stage (marked in green) directly correlated with memory performance.
Stage 1: right hemispheric theta oscillations
The combined increase in theta power and decrease in HFA were the earliest electrophysiological markers of episodic retrieval (Figs. 2–4). This activity was predominately found in the right temporal and parahippocampal cortex, consistent with findings of right-focused theta oscillations during recognition tasks (Doppelmayr et al., 1998; Osipova et al., 2006). The increase in theta power in the right temporal cortex was concentrated in the 3–12 Hz frequency band (Fig. 7A, left), suggesting that these changes reflect oscillatory activity. Additionally, theta oscillations were shown to be specific to the retrieval condition, and did not reflect changes that occurred specifically during baseline activity (Fig. 5). The amount of this theta activity did not predict memory performance across all patients (Fig. 6).
Previous electrophysiological studies have shown that theta oscillations, more than any other signal, are enhanced during episodic retrieval (Burgess and Gruzelier, 1997; Klimesch et al., 2000; Guderian and Düzel, 2005; Mormann et al., 2005; Foster et al., 2013; for review, see Nyhus and Curran, 2010). Theta has been hypothesized to organize information into and out of the hippocampus (Düzel et al., 2010), through both interaction with the gamma cycle (Lisman and Jensen, 2013) and long-range phase-synchronization (Fell and Axmacher, 2011). Recent research has additionally suggested that theta oscillations can be “tuned” to select different types of mnemonic cues (for example, spatial vs temporal) to aid retrieval (Watrous et al., 2013; Ekstrom and Watrous, 2014). These hypotheses have largely assumed that theta activity represents information specific to the item being retrieved, an argument that has received some experimental support (Klimesch et al., 2006).
Here, we suggest that theta is related to memory search during the retrieval process. Indeed, if theta correlated with memory search, it would explain why theta appears so early before activity in the MTL. As people voluntarily engage their memory, theta may increase. In addition, as memory search becomes more intense as participants converge upon a particular memory, theta may ramp up as the retrieval event is approached. One testable prediction of this speculation is that theta should be increased similarly for correct and incorrect recalls (false memories), because both would similarly draw on equal degrees of memory search. Consistent with this prediction, a previous study contrasted true and false recalls and found no difference in theta activity (Sederberg et al., 2007). Further research should quantify the exact amount of theta oscillatory power during false recall compared with baseline.
Stage 2: left hemispheric-dominant HFA
The next electrophysiological stage of retrieval was an increase in HFA in the MTL, L IFG, L VLTC, and R motor region immediately preceding vocalization onset (Fig. 3). These same areas, particularly the L IFG and L VLTC, correspond well with regions implicated in analogous neuroimaging studies using recognition memory tasks (for review, see Spaniol et al., 2009). Indeed, the correspondence between HFA and fMRI findings during retrieval fits well with the known correlation between HFA and the BOLD signal (Logothetis et al., 2001; Mukamel et al., 2005; Conner et al., 2011). Thus, these findings offer a key link between electrophysiological and hemodynamic studies of episodic retrieval (Rugg et al., 2002).
We speculate that high-frequency activity in the L MTL during this time reflects the reinstatement of retrieved item into conscious awareness (Tulving, 1983), for two reasons. First, the increased HFA occurred immediately before the motor response associated with vocalization (see next section), at which time the item is known to already have entered conscious awareness. Second, HFA in the L MTL during this time is directly correlated with the ability to retrieve memories (Fig. 6). Previous work has shown that retrieval involves the reinstatement of temporal context (Manning et al., 2011), semantic meaning (Manning et al., 2012), object category information (Kahn et al., 2004; Polyn et al., 2005; Johnson et al., 2009; Kuhl et al., 2011), and the modality of the encoded items (Rugg et al., 2008). These studies have shown that multiple anatomical areas, as well as frequency bands (Manning et al., 2011), are responsible for neural reinstatement. However, although reinstatement, in general, can be found in many brain regions and frequency bands, here we speculate that, based on the reasons outlined above, HFA in the L MTL reflects the more stringent process of the invasion of the encoded item into the rememberer's consciousness (Tulving, 1983). Indeed, this interpretation is consistent with the famous observation that without the MTL, retrieval completely breaks down (Scoville and Milner, 1957; Squire, 1992).
The L IFG, R MTL, L VLTC, and R motor regions also showed increased HFA during this time. These regions have been connected with memory retrieval in functional imaging studies (Spaniol et al., 2009; Shimamura, 2011), but did not correlate with memory ability in our data. Given the transient nature of these activations, it is unlikely that they correlate with memory search, which would have to occur in a sustained manner earlier during the course of recall (as in theta oscillations). Instead, these brain areas may facilitate the ultimate act of retrieval, which occurs in the MTL, but are not themselves critical to recall. The specific facilitative role of these areas during retrieval is topic of future research; one speculation is that the L IFG facilitates retrieval by semantically organizing items in the L VLTC (Badre and Wagner, 2007; Long et al., 2010). A previous study has shown preliminary evidence in support of this prediction (Manning et al., 2012); however, future work should determine if HFA in the L IFG and L VLTC, in particular, is elevated during such semantic based retrieval.
Stage 3: bilateral motor/language activation
In the case of free recall, memory is searched with the goal to articulate retrieved words; accordingly, we found that the final stage of retrieval was marked by electrophysiological changes known to accompany language and motor responses during speech. Specifically, Figures 2 and 3 suggest that vocalization is associated with a widespread increase in HFA and decrease in theta activity in motor-language areas bilaterally (Crone et al., 2001; Miller et al., 2007; Hermes et al., 2014). Increased HFA in the right hemisphere likely reflects activation of mouth motor cortex during vocal activity. HFA in the left likely incorporates motor activation as well as language activation of Wernicke's and Broca's region, as well activity along the arcuate fasciculus between these regions. Our data indicate that the activity in the right motor region is stronger than left language-motor area; further research should investigate whether hemispheric specialization plays a role in response production.
Conclusion
Spontaneous episodic retrieval is a multistage cognitive operation characterized, by memory search, reinstatement, and response production. Here, we mapped neurophysiological signals to each stage (Fig. 7), and we hope that future research can use this work to better understand nature's one and only time machine (Tulving, 2002).
Notes
Supplemental material for this article is available at http://memory.psych.upenn.edu/HFAretrieval. The supplemental material shows a movie (frame rate of 50 frames per second, 50% real-time speed), in which the entire spatiotemporal pattern of power fluctuations that occurs during spontaneous recall can be visualized. A second movie is also included that identically shows these power changes; however, only increases in power are displayed. This material has not been peer reviewed.
Footnotes
This work was supported by National Institutes of Health Grants MH055687 and MH017168. We thank Dale H. Wyeth, Edmund Wyeth, and Ryan B. Williams for technical assistance at Thomas Jefferson Hospital; Nicole M. Long and Rosalia Paterno for helpful discussion and input. We also thank the three anonymous reviewers for their thoughtful and valuable input. We are indebted to all patients who have selflessly volunteered their time to participate in our study.
The authors declare no competing financial interests.
References
- Addison PS. The illustrated wavelet transform handbook: introductory theory and applications in science, engineering, medicine and finance. Bristol: Institute of Physics; 2002. [Google Scholar]
- Badre D, Wagner AD. Left ventrolateral prefrontal cortex and the cognitive control of memory. Neuropsychologia. 2007;45:2883–2901. doi: 10.1016/j.neuropsychologia.2007.06.015. [DOI] [PubMed] [Google Scholar]
- Brassen S, Weber-Fahr W, Sommer T, Lehmbeck JT, Braus DF. Hippocampalprefrontal encoding activation predicts whether words can be successfully recalled or only recognized. Behav Brain Res. 2006;171:271–278. doi: 10.1016/j.bbr.2006.04.002. [DOI] [PubMed] [Google Scholar]
- Burgess AP, Gruzelier JH. Short duration synchronization of human theta rhythm during recognition memory. Neuroreport. 1997;8:1039–1042. doi: 10.1097/00001756-199703030-00044. [DOI] [PubMed] [Google Scholar]
- Burke JF, Long NM, Zaghloul KA, Sharan AD, Sperling MR, Kahana MJ. Human intracranial high-frequency activity maps episodic memory formation in space and time. Neuroimage. 2014;85:834–843. doi: 10.1016/j.neuroimage.2013.06.067. [DOI] [PMC free article] [PubMed] [Google Scholar]
- Burke JF, Zaghloul KA, Jacobs J, Williams RB, Sperling MR, Sharan AD, Kahana MJ. Synchronous and asynchronous theta and gamma activity during episodic memory formation. J Neurosci. 2013;33:292–304. doi: 10.1523/JNEUROSCI.2057-12.2013. [DOI] [PMC free article] [PubMed] [Google Scholar]
- Cohen J. Statistical power analysis for the behavioral sciences. Ed 2. New York: Academic; 1977. [Google Scholar]
- Conner CR, Ellmore TM, Pieters TA, DiSano MA, Tandon N. Variability of the relationship between electrophysiology and bold-fMRI across cortical regions in humans. J Neurosci. 2011;31:12855–12865. doi: 10.1523/JNEUROSCI.1457-11.2011. [DOI] [PMC free article] [PubMed] [Google Scholar]
- Crone NE, Boatman D, Gordon B, Hao L. Induced electrocorticographic gamma activity during auditory perception. Clin Neurophysiol. 2001;112:565–582. doi: 10.1016/S1388-2457(00)00545-9. [DOI] [PubMed] [Google Scholar]
- Doppelmayr M, Klimesch W, Schwaiger J, Auinger P, Winkler T. Theta synchronization in the human eeg and episodic retrieval. Neurosci Lett. 1998;257:41–44. doi: 10.1016/S0304-3940(98)00805-2. [DOI] [PubMed] [Google Scholar]
- Düzel E, Penny WD, Burgess N. Brain oscillations and memory. Curr Opin Neurobiol. 2010;20:143–149. doi: 10.1016/j.conb.2010.01.004. [DOI] [PubMed] [Google Scholar]
- Ekstrom AD, Watrous AJ. Multifaceted roles for low-frequency oscillations in bottom-up and top-down processing during navigation and memory. Neuroimage. 2014;85:667–677. doi: 10.1016/j.neuroimage.2013.06.049. [DOI] [PMC free article] [PubMed] [Google Scholar]
- Fell J, Klaver P, Lehnertz K, Grunwald T, Schaller C, Elger CE, Fernandez G. Human memory formation is accompanied by rhinal-hippocampal coupling and decoupling. Nat Neurosci. 2001;4:1259–1264. doi: 10.1038/nn759. [DOI] [PubMed] [Google Scholar]
- Fell J, Axmacher N. The role of phase synchronization in memory processes. Nat Rev Neurosci. 2011;12:105–118. doi: 10.1038/nrn2979. [DOI] [PubMed] [Google Scholar]
- Fernández G, Effern A, Grunwald T, Pezer N, Lehnertz K, Dmpelmann M, Elger CE. Real-time tracking of memory formation in the human rhinal cortex and hippocampus. Science. 1999;285:1582–1585. doi: 10.1126/science.285.5433.1582. [DOI] [PubMed] [Google Scholar]
- Fischl B. FreeSurfer. Neuroimage. 2012;62:774–781. doi: 10.1016/j.neuroimage.2012.01.021. [DOI] [PMC free article] [PubMed] [Google Scholar]
- Fischl B, Sereno MI, Tootell RB, Dale AM. High-resolution intersubject averaging and a coordinate system for the cortical surface. Hum Brain Mapp. 1999;8:272–284. doi: 10.1002/(SICI)1097-0193(1999)8:4<272::AID-HBM10>3.0.CO%3B2-4. [DOI] [PMC free article] [PubMed] [Google Scholar]
- Foster BL, Kaveh A, Dastjerdi M, Miller KJ, Parvizi J. Human retrosplenial cortex displays transient theta phase locking with medial temporal cortex prior to activation during autobiographical memory retrieval. J Neurosci. 2013;33:10439–10446. doi: 10.1523/JNEUROSCI.0513-13.2013. [DOI] [PMC free article] [PubMed] [Google Scholar]
- Geller AS, Schlefer IK, Sederberg PB, Jacobs J, Kahana MJ. PyEPL: a cross-platform experiment-programming library. Behav Res Methods. 2007;39:950–958. doi: 10.3758/BF03192990. [DOI] [PMC free article] [PubMed] [Google Scholar]
- Genovese CR, Lazar NA, Nichols T. Thresholding of statistical maps in functional neuroimaging using the false discovery rate. Neuroimage. 2002;15:870–878. doi: 10.1006/nimg.2001.1037. [DOI] [PubMed] [Google Scholar]
- Guderian S, Düzel E. Induced theta oscillations mediate large-scale synchrony with mediotemporal areas during recollection in humans. Hippocampus. 2005;15:901–912. doi: 10.1002/hipo.20125. [DOI] [PubMed] [Google Scholar]
- Hanslmayr S, Volberg G, Wimber M, Raabe M, Greenlee MW, Bäumel KH. The relationship between brain oscillations and BOLD signal during memory formation: a combined EEG-fMRI study. J Neurosci. 2011;31:15674–15680. doi: 10.1523/JNEUROSCI.3140-11.2011. [DOI] [PMC free article] [PubMed] [Google Scholar]
- Hanslmayr S, Staudigl T, Fellner MC. Oscillatory power decreases and long-term memory: the information via desynchronization hypothesis. Front Hum Neurosci. 2012;6:74. doi: 10.3389/fnhum.2012.00074. [DOI] [PMC free article] [PubMed] [Google Scholar]
- Hermes D, Miller KJ, Vansteensel MJ, Edwards E, Ferrier CH, Bleichner MG, van Rijen PC, Aarnoutse EJ, Ramsey NF. Cortical theta wanes for language. Neuroimage. 2014;85:738–748. doi: 10.1016/j.neuroimage.2013.07.029. [DOI] [PubMed] [Google Scholar]
- Howard MW, Kahana MJ. Contextual variability and serial position effects in free recall. J Exp Psychol Learn Mem Cogn. 1999;25:923–941. doi: 10.1037/0278-7393.25.4.923. [DOI] [PubMed] [Google Scholar]
- Johnson JD, McDuff SG, Rugg MD, Norman KA. Recollection, familiarity, and cortical reinstatement: a multivoxel pattern analysis. Neuron. 2009;63:697–708. doi: 10.1016/j.neuron.2009.08.011. [DOI] [PMC free article] [PubMed] [Google Scholar]
- Kahana MJ. Associative retrieval processes in free recall. Mem Cognit. 1996;24:103–109. doi: 10.3758/BF03197276. [DOI] [PubMed] [Google Scholar]
- Kahana MJ. Foundations of human memory. New York: Oxford UP; 2012. [Google Scholar]
- Kahn I, Davachi L, Wagner AD. Functional-neuroanatomic correlates of recollection: implications for models of recognition memory. J Neurosci. 2004;24:4172–4180. doi: 10.1523/JNEUROSCI.0624-04.2004. [DOI] [PMC free article] [PubMed] [Google Scholar]
- Klimesch W, Doppelmayr M, Schwaiger J, Winkler T, Gruber W. Theta oscillations and the ERP old/new effect: independent phenomena? Clin Neurophysiol. 2000;111:781–793. doi: 10.1016/S1388-2457(00)00254-6. [DOI] [PubMed] [Google Scholar]
- Klimesch W, Hanslmayr S, Sauseng P, Gruber W, Brozinsky CJ, Kroll NE, Yonelinas AP, Doppelmayr M. Oscillatory EEG correlates of episodic trace decay. Cereb Cortex. 2006;16:280–290. doi: 10.1093/cercor/bhi107. [DOI] [PubMed] [Google Scholar]
- Kuhl BA, Rissman J, Chun MM, Wagner AD. Fidelity of neural reactivation reveals competition between memories. Proc Natl Acad Sci U S A. 2011;108:5903–5908. doi: 10.1073/pnas.1016939108. [DOI] [PMC free article] [PubMed] [Google Scholar]
- Lisman JE, Jensen O. The theta-gamma neural code. Neuron. 2013;77:1002–1016. doi: 10.1016/j.neuron.2013.03.007. [DOI] [PMC free article] [PubMed] [Google Scholar]
- Logothetis NK, Pauls J, Augath M, Trinath T, Oeltermann A. Neurophysiological investigation of the basis of the fMRI signal. Nature. 2001;412:150–157. doi: 10.1038/35084005. [DOI] [PubMed] [Google Scholar]
- Long NM, Öztekin I, Badre D. Seperable prefrontal cortex contributions to free recall. J Neurosci. 2010;30:10967–10976. doi: 10.1523/JNEUROSCI.2611-10.2010. [DOI] [PMC free article] [PubMed] [Google Scholar]
- Long NM, Burke JF, Kahana MJ. Subsequent memory effect in intracranial and scalp EEG. Neuroimage. 2014;84:488–494. doi: 10.1016/j.neuroimage.2013.08.052. [DOI] [PMC free article] [PubMed] [Google Scholar]
- Maldjian JA, Laurienti PJ, Kraft RA, Burdette JH. An automated method for neuroanatomic and cytoarchitectonic atlas-based interrogation of fMRI data sets. Neuroimage. 2003;19:1233–1239. doi: 10.1016/S1053-8119(03)00169-1. [DOI] [PubMed] [Google Scholar]
- Manning JR, Polyn SM, Baltuch GH, Litt B, Kahana MJ. Oscillatory patterns in temporal lobe reveal context reinstatement during memory search. Proc Natl Acad Sci U S A. 2011;108:12893–12897. doi: 10.1073/pnas.1015174108. [DOI] [PMC free article] [PubMed] [Google Scholar]
- Manning JR, Sperling MR, Sharan A, Rosenberg EA, Kahana MJ. Spontaneously reactivated patterns in frontal and temporal lobe predict semantic clustering during memory search. J Neurosci. 2012;32:8871–8878. doi: 10.1523/JNEUROSCI.5321-11.2012. [DOI] [PMC free article] [PubMed] [Google Scholar]
- Miller K, Leuthardt EC, Schalk G, Rao RP, Anderson NR, Moran DW, Miller JW, Ojemann JG. Spectral changes in cortical surface potentials during motor movement. J Neurosci. 2007;27:2424–2432. doi: 10.1523/JNEUROSCI.3886-06.2007. [DOI] [PMC free article] [PubMed] [Google Scholar]
- Mormann F, Fell J, Axmacher N, Weber B, Lehnertz K, Elger CE, Fernández G. Phase/amplitude reset and thetagamma interaction in the human medial temporal lobe during a continuous word recognition memory task. Hippocampus. 2005;15:890–900. doi: 10.1002/hipo.20117. [DOI] [PubMed] [Google Scholar]
- Mukamel R, Gelbard H, Arieli A, Hasson U, Fried I, Malach R. Coupling between neuronal firing, field potentials, and fMRI in human auditory cortex. Science. 2005;309:951–954. doi: 10.1126/science.1110913. [DOI] [PubMed] [Google Scholar]
- Nyhus E, Curran T. Functional role of gamma and theta oscillations in episodic memory. Neurosci Biobehav Rev. 2010;34:1023–1035. doi: 10.1016/j.neubiorev.2009.12.014. [DOI] [PMC free article] [PubMed] [Google Scholar]
- Osipova D, Takashima A, Oostenveld R, Fernández G, Maris E, Jensen O. Theta and gamma oscillations predict encoding and retrieval of declarative memory. J Neurosci. 2006;26:7523–7531. doi: 10.1523/JNEUROSCI.1948-06.2006. [DOI] [PMC free article] [PubMed] [Google Scholar]
- Polyn SM, Natu VS, Cohen JD, Norman KA. Category-specific cortical activity precedes retrieval during memory search. Science. 2005;310:1963–1966. doi: 10.1126/science.1117645. [DOI] [PubMed] [Google Scholar]
- Polyn SM, Norman KA, Kahana MJ. A context maintenance and retrieval model of organizational processes in free recall. Psychol Rev. 2009;116:129–156. doi: 10.1037/a0014420. [DOI] [PMC free article] [PubMed] [Google Scholar]
- Rugg MD, Johnson JD, Park H, Uncapher MR. Encoding-retrieval overlap in human episodic memory: a functional neuroimaging perspective. Prog Brain Res. 2008;169:339–352. doi: 10.1016/S0079-6123(07)00021-0. [DOI] [PubMed] [Google Scholar]
- Rugg MD, Herron JE, Morcom AM. Electrophysiological studies of retrieval processing. In: Squire LR, Schacter DL, editors. Neuropsychology of Memory. Ed 3. New York: Guilford; 2002. pp. 154–165. [Google Scholar]
- Scoville WB, Milner B. Loss of recent memory after bilateral hippocampal lesions. J Neurol Neurosurg Psychiat. 1957;20:11–21. doi: 10.1136/jnnp.20.1.11. [DOI] [PMC free article] [PubMed] [Google Scholar]
- Sederberg PB, Kahana MJ, Howard MW, Donner EJ, Madsen JR. Theta and gamma oscillations during encoding predict subsequent recall. J Neurosci. 2003;23:10809–10814. doi: 10.1523/JNEUROSCI.23-34-10809.2003. [DOI] [PMC free article] [PubMed] [Google Scholar]
- Sederberg PB, Schulze-Bonhage A, Madsen JR, Bromfield EB, Litt B, Brandt A, Kahana MJ. Gamma oscillations distinguish true from false memories. Psychol Sci. 2007;18:927–932. doi: 10.1111/j.1467-9280.2007.02003.x. [DOI] [PMC free article] [PubMed] [Google Scholar]
- Shimamura AP. Episodic retrieval and the cortical binding of relational activity. Cogn Affect Behav Neurosci. 2011;11:277–291. doi: 10.3758/s13415-011-0031-4. [DOI] [PubMed] [Google Scholar]
- Spaniol J, Davidson PS, Kim AS, Han H, Moscovitch M, Grady CL. Event-related fMRI studies of episodic encoding and retrieval: meta-analyses using activation likelihood estimation. Neuropsychologia. 2009;47:1765–1779. doi: 10.1016/j.neuropsychologia.2009.02.028. [DOI] [PubMed] [Google Scholar]
- Squire LR. Memory and the hippocampus: a synthesis from findings with rats, monkeys, and humans. Psychol Rev. 1992;99:195–231. doi: 10.1037/0033-295X.99.2.195. [DOI] [PubMed] [Google Scholar]
- Staresina BP, Davachi L. Differential encoding mechanisms for subsequent associative recognition and free recall. J Neurosci. 2006;26:9162–9172. doi: 10.1523/JNEUROSCI.2877-06.2006. [DOI] [PMC free article] [PubMed] [Google Scholar]
- Strange BA, Otten LJ, Josephs O, Rugg MD, Dolan RJ. Dissociable human perirhinal, hippocampal, and parahippocampal roles during verbal encoding. J Neurosci. 2002;22:523–528. doi: 10.1523/JNEUROSCI.22-02-00523.2002. [DOI] [PMC free article] [PubMed] [Google Scholar]
- Tulving E. Elements of episodic memory. New York: Oxford; 1983. [Google Scholar]
- Tulving E. Episodic memory: from mind to brain. Annu Rev Psychol. 2002;53:1–25. doi: 10.1146/annurev.psych.53.100901.135114. [DOI] [PubMed] [Google Scholar]
- Tulving E. On the law of primacy. In: Gluck MA, Anderson JR, Kosslyn SM, editors. Memory and mind: a festschrift for Gordon H. Bower. New Jersey: Lawrence Erlbaum Associates; 2007. pp. 31–48. [Google Scholar]
- Waldhauser GT, Johansson M, Hanslmayr S. Alpha/beta oscillations indicate inhibition of interfering visual memories. J Neurosci. 2012;32:1953–1961. doi: 10.1523/JNEUROSCI.4201-11.2012. [DOI] [PMC free article] [PubMed] [Google Scholar]
- Watrous AJ, Tandon N, Conner CR, Pieters T, Ekstrom AD. Frequency-specific network connectivity increases underlie accurate spatiotemporal memory retrieval. Nat Neurosci. 2013;16:349–356. doi: 10.1038/nn.3315. [DOI] [PMC free article] [PubMed] [Google Scholar]