

Abstract
Light stimulation evokes neuronal activity in the retina, resulting in the dilation of retinal blood vessels and increased blood flow. This response, named functional hyperemia, brings oxygen and nutrients to active neurons. However, it remains unclear which vessels mediate functional hyperemia. We have characterized blood flow regulation in the rat retina in vivo by measuring changes in retinal vessel diameter and red blood cell (RBC) flux evoked by a flickering light stimulus. We found that, in first- and second-order arterioles, flicker evoked large (7.5 and 5.0%), rapid (0.73 and 0.70 s), and consistent dilations. Flicker-evoked dilations in capillaries were smaller (2.0%) and tended to have a slower onset (0.97 s), whereas dilations in venules were smaller (1.0%) and slower (1.06 s) still. The proximity of pericyte somata did not predict capillary dilation amplitude. Expression of the contractile protein α-smooth muscle actin was high in arterioles and low in capillaries. Unexpectedly, we found that blood flow in the three vascular layers was differentially regulated. Flicker stimulation evoked far larger dilations and RBC flux increases in the intermediate layer capillaries than in the superficial and deep layer capillaries (2.6 vs 0.9 and 0.7% dilation; 25.7 vs 0.8 and 11.3% RBC flux increase). These results indicate that functional hyperemia in the retina is driven primarily by active dilation of arterioles. The dilation of intermediate layer capillaries is likely mediated by active mechanisms as well. The physiological consequences of differential regulation in the three vascular layers are discussed.
Keywords: blood flow, capillary, functional hyperemia, pericyte, rat, retina
Introduction
The brain has high metabolic requirements, consuming 20% of the energy of the body while constituting only 2% of its mass. Oxygen and glucose delivery to the brain is critical for maintaining proper function, and the mechanisms that regulate blood flow are both complex and essential. On a global level, the blood supply of the brain is controlled by autoregulatory mechanisms that compensate for variations in blood pressure. On a fine spatial scale, functional hyperemia regulates blood flow in response to local neuronal activity. Increased synaptic activity results in the dilation of blood vessels, increased blood flow, and reduced blood deoxyhemoglobin. The latter response is exploited to generate functional brain images using the BOLD technique. Recent work has elucidated the neurovascular coupling mechanisms underlying functional hyperemia, a quest that has implicated both neurons and glial cells (Attwell et al., 2010). Despite the importance of functional hyperemia to brain function, it remains incompletely understood.
It is well known that arterioles regulate blood flow in the brain (Vanzetta et al., 2005; Devor et al., 2007; Boas et al., 2008). However, the role of capillaries in actively regulating blood flow remains uncertain. Active capillary dilation would deliver oxygen with much greater spatial precision than arterioles. An active capillary role is supported by work in olfactory glomeruli (Chaigneau et al., 2003) and the subventricular zone (Lacar et al., 2012). In addition, pericytes, contractile cells that surround capillaries, can regulate capillary diameter in both the retina and cortex (Schönfelder et al., 1998; Peppiatt et al., 2006; Puro, 2007; Hamilton et al., 2010), and pericytes in the somatosensory cortex dilate vessels in response to sensory stimulation (Hall et al., 2014). In contrast, another report indicates that capillaries respond passively and that active pericyte relaxation does not contribute to cortical functional hyperemia (Fernández-Klett et al., 2010).
We now address the questions of blood flow regulation and active control of blood flow by capillaries in the in vivo retina. The retina offers several advantages in studying functional hyperemia. It can be imaged non-invasively, its vasculature is easily visualized, it has a high density of capillary pericytes, and it can be stimulated physiologically with light. The retinal vasculature is a highly interconnected structure composed of three planar vascular layers at different retinal depths (Paques et al., 2003; Genevois et al., 2004; Ganesan et al., 2010; Stahl et al., 2010; Ivanova et al., 2014). To our knowledge, functional hyperemia in the three retinal vascular layers has not been described previously.
We have characterized blood flow regulation by measuring flicker-evoked changes in vessel diameter and red blood cell (RBC) flux in arterioles, capillaries, and venules in the rat retina. We find that flicker-evoked dilations are larger and faster in arterioles than in downstream capillaries and venules. Intriguingly, we find that functional hyperemia differs dramatically in the capillaries of the three vascular layers.
Materials and Methods
In vivo preparation.
The in vivo rat retinal preparation has been described previously (Srienc et al., 2012). All animals were treated in accordance with the University of Minnesota Institutional Animal Care and Use Committee guidelines. Briefly, 2- to 3-month-old male Long–Evans rats were anesthetized with isoflurane (2%), and the femoral artery and vein were cannulated for monitoring of blood pressure and injection of anesthetics and paralytics, respectively. A tracheotomy was performed. After surgery, the animal was anesthetized with α-chloralose (α-chloralose-HBC Complex; Sigma C8849; 800 mg/kg bolus and 550 mg · kg−1 · h−1 sustained infusion), and the paralytic gallamine triethiodide (Sigma G8134; 20 mg/kg bolus and 20 mg · kg−1 · h−1 sustained infusion) was administered to reduce eye movements. The paralytic agent did not affect the flicker-evoked vascular responses. A contact lens was placed over the eye. The animal was mounted in a custom stereotaxic holder that was attached to a stage, and the retina was imaged with a confocal microscope (Olympus FV1000) and a 4× dry 0.16 numerical aperture objective. A heating blanket was used to maintain the animal's body temperature at 37°C. The rat was ventilated (SAR-1000; CWE) with a mixture of 30% O2 and 70% N2 at 55 breaths/min with a tidal volume of ∼3.4 ml, a 1:1 inspiration/expiration fraction, and 2 mmHg positive end-expiratory pressure. Oxygen saturation (sO2; MouseOx; Starr Life Sciences), end-tidal CO2 (microCapStar; CWE), and arterial blood pressure (Pressure Monitor BP-1; World Precision Instruments) were measured in real time. Carbon dioxide partial pressure (pCO2), oxygen partial pressure (pO2), and pH were sampled periodically (ABL800flex; Radiometer), and ventilation parameters were adjusted to maintain physiological parameters within normal limits (Table 1). Large tidal volume breaths up to 30 cmHg were given every ∼5 min to maintain good lung ventilation. These breaths were often given immediately before blood sampling, accounting for the high pO2 we observed. If physiological parameters deviated from the normal range, the retinal functional hyperemia response was reduced or absent. Data were only collected when parameters were within the normal range. After experimentation, animals were killed with an intravenous injection of potassium chloride (2 mEq/kg), and the right (experimental) eye was removed for immunohistochemical labeling.
Table 1.
Physiological parameters
| Physiological parameter | Mean ± SEM | n |
|---|---|---|
| BP | 120 ± 2 mmHg | 46 |
| pO2 | 162 ± 4 mmHg | 33 |
| sO2 | 94.8 ± 0.3% | 46 |
| pCO2 | 32 ± 0.5 mmHg | 33 |
| pH | 7.42 ± 0.00 | 33 |
BP, Mean arteriole blood pressure; n, number of rats.
Fluorescent RBC labeling.
RBCs were labeled with the lipophilic dye carbocyanide 1,1′-dioctadecyl-3,3,3′,3′-tetramethylindodicarbocyanine, 4-chlorobenzenesulfonate salt (DiD solid; Invitrogen D-7757) using a procedure modified from Unthank et al. (1993). A total of 350 μl of blood was withdrawn from the arterial line, and RBCs were isolated by adding 700 μl of blood plasma buffer (BPB; in mm: 128 NaCl, 15 glucose, 10 HEPES, 4.2 NaHCO3, 3 KCl, 2 MgCl2, and 1 KH2PO4, pH 7.4; Khoobehi et al., 2003) and centrifuged for 5 min at 1500 rpm. RBCs were resuspended in 1.4 ml of BPB, and the cell suspension was gently mixed into a dye solution composed of 1.4 ml of Dilutent C (Sigma CGLDIL) and 35 μl of DiD (2.5 mg/mL in 100% ethanol). The solution was incubated for 5 min at 37°C with periodic inversion to ensure uniform labeling. After labeling, 700 μl of serum was added, and the solution was incubated for 1 additional minute. The fluorescent RBCs (fRBCs) were then centrifuged for 5 min at 1500 rpm and washed twice by gentle mixing in 3.5 ml of BPB containing 10% serum, followed by 5 min centrifugation at 1500 rpm to remove unbound dye. Washed and labeled cells were resuspended in BPB up to a volume of 1 ml, and 0.2-1 ml of blood solution was injected into the intravenous line to achieve the desired in vivo labeled cell density. An fRBC density of ∼0.9% (of total RBCs) was used for measuring flux in large vessels, and a density of ∼1.2% was used for measuring flux in capillaries.
Vessel diameter and RBC flux measurements.
Fluorescein isothiocyanate (FITC) dextran (2000 kDa; 1 ml of 3% solution; Sigma FD200S) was administered intravenously to visualize the vasculature. Vessel lumenal diameter and RBC flux were measured simultaneously using confocal line scans oriented perpendicular to the vessel (Fig. 1). FITC and fRBCs were imaged using 488 and 635 nm laser lines, respectively. The confocal laser illumination was maintained as low as possible to minimize photoreceptor stimulation. Control experiments demonstrated that the confocal illumination did not reduce flicker-evoked vascular responses or retinal ganglion cell activity measured with extracellular electrodes. Two trial and stimulus paradigms were used for data acquisition. In the first, used for all blood vessels, the line-scan acquisition (∼650 Hz) was at least 47 s in duration. However, this scan rate was too low to capture the passage of fRBCs in large arterioles and venules. To measure RBC flux in these vessels, additional data were gathered using ultrafast line scans (4200 Hz), in which the trial duration was limited to 8 s due to constraints of the confocal microscope software. Room illumination was dim during experimentation (∼3 lux at the surface of the eye). The retina was stimulated with a 5 Hz diffuse flickering white light with a 10% duty cycle, an intensity of ∼200 klux, and a duration of 15 s for long trials and 2 s for short trials. The stimulus light was long-pass filtered at 600 nm and directed obliquely onto the eye, illuminating the retina primarily through the sclera. Such a flickering stimulus effectively activates neurons of the inner retina (Miller, 2001). For ease of processing and comparison, data were converted to a temporal resolution of 10 ms. All data were reviewed visually, and trials with eye movement or stimulus artifacts were excluded from additional processing.
Figure 1.

Measurement of blood vessel diameter and RBC flux in the retina. A, Confocal image of a whole-mount retina labeled for the blood vessel marker isolectin (blue), the contractile protein α-SMA (red), and the pericyte marker NG2 (green). Blood vessel order in the superficial vascular layer is indicated. First-order arterioles (1) branch from the central retinal artery. Each subsequent branch (2-5) has a higher order. Venules (V) connect with the central retinal vein. Scale bar, 100 μm. B, In vivo confocal line-scan images of vessels in the retina, labeled by intravenous injection of FITC dextran. For line-scan images of capillaries (B1), vessel diameter is calculated as the distance between the borders of the vessel lumen (red dots). Segments in which diameter cannot be measured accurately (yellow dots) are ignored. Flux is measured by counting the passage of single RBCs (black vertical lines). In larger vessels, diameter is also measured as the distance between the borders of the vessel lumen (B2; red dots), and flux is calculated by counting the passage of fluorescently labeled RBCs, imaged at a different wavelength (B3; bright vertical lines).
Vessel diameter was calculated using a custom MATLAB (version R2012a; MathWorks) program that automatically extracted the borders of the vessel lumen from line-scan images (Figs. 1B1, 2). Light stimulus artifacts in line-scan images were automatically removed before diameter calculation, as were regions of the image in which the vessel was not significantly brighter than the background. The latter procedure was particularly important in capillaries in which a single RBC passing through the vessel prevented visualization and measurement of the vessel lumen. Before analysis, vessel diameter data were temporally averaged using a symmetrical 1 s moving average filter. In many blood vessels, we observed a slow, steady decrease in diameter throughout the trial. This linear drift was removed from all diameter records.
Figure 2.
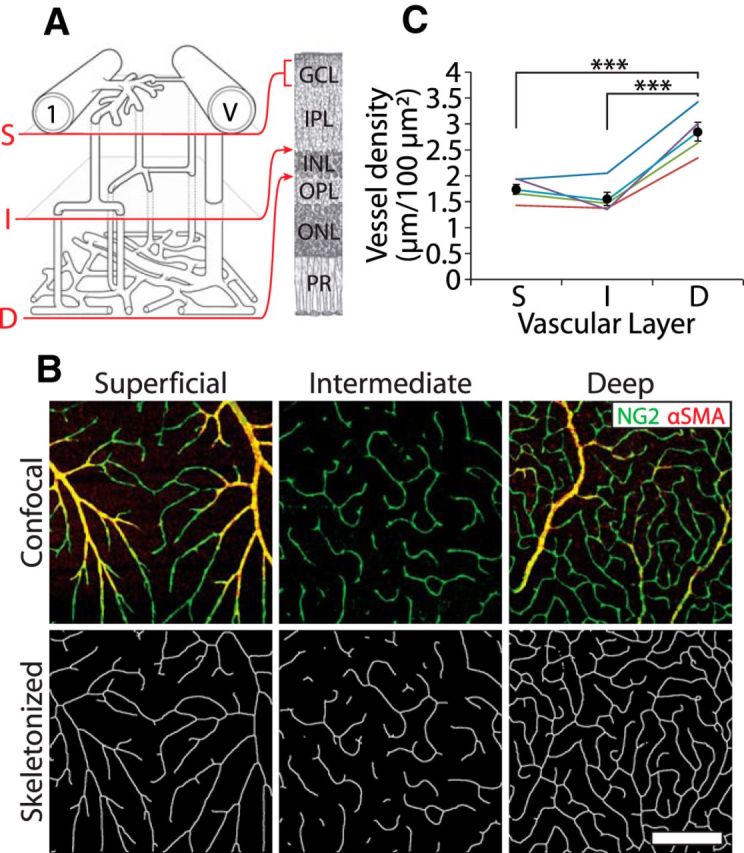
Vessel density in the three vascular layers. A, Schematic of the trilaminar vascular network showing the first-order arteriole (1) and venule (V) and the connectivity of the superficial (S), intermediate (I), and deep (D) vascular layers and their locations within the retina. GCL, Ganglion cell layer; IPL, inner plexiform layer; INL, inner nuclear layer; OPL, outer plexiform layer; ONL, outer nuclear layer; PR, photoreceptors. Drawing modified from Paques et al. (2003). B, Top row, Representative confocal images of the superficial, intermediate, and deep vascular layers, labeled for NG2 (green) and α-SMA (red). Bottom row, The images are skeletonized for calculation of vessel density. Scale bar, 200 μm. C, Vessel density in the three vascular layers, measured in five retinas. ***p < 0.001.
RBC flux was measured by two methods. In the first, unlabeled RBCs moving single-file in narrow vessels were visualized as dark bands interrupting the fluorescently labeled blood plasma (Fig. 1B1). In the second method, fRBCs in vessels of all diameters were visualized as bright lines (Fig. 1B3). Using these two methods allowed us to calculate flux in all retinal vessels. In both methods, flux was calculated using a custom MATLAB program. RBCs were identified from the background using a moving thresholding algorithm. Line-scan lines that were darker (for true flux) or brighter (for fRBC flux) than surrounding lines were flagged as containing an RBC. A single RBC typically appeared on more than two adjacent line-scan lines. Adjacent RBC-containing lines were grouped together and considered a single RBC. Flux was calculated as RBCs per second.
Measurement of vessel diameter and flux at a specific location on a blood vessel was made between two and eight times, and these trials were averaged to create a mean, which we call a series. All analyses presented here are performed on series data. The full dataset contains 204 series from 47 rats.
Response onset time.
Response onset time of a vessel was defined as the time to 20% of the peak diameter response. The peak response was calculated as the largest diameter within the first 4 s after stimulus onset, a procedure designed to isolate the first phase of the dilatory response (Fig. 3A shows a biphasic dilation in arterioles). The 20% onset time was measured only for those series in which the peak response within 4 s of stimulus onset was >3 SDs above the baseline. Onset time was not calculated for capillaries in the intermediate and deep capillary layers because these vessels lacked a clearly defined peak during the first 4 s of the stimulus.
Figure 3.

Flicker-evoked dilation of retinal vessels. A, Time course of flicker-evoked dilation of superficial layer vessels. Mean ± SEM are shown. The open horizontal bar in this and other figures indicates the flicker stimulus. B, Scatter plot of flicker-evoked vasodilation (maximum change during the first 4 s of stimulation) versus baseline vessel diameter for superficial layer vessels. Data are color coded by vessel order. C, Mean baseline diameter of retinal vessels by vessel order. D, Mean flicker-evoked dilation (maximum change during the first 4 s of stimulation) by vessel order. ***p < 0.001, compared with first order; ##p < 0.01, compared with second order. E, Time course of flicker-evoked dilation in the three vascular layers. F, Scatter plot of flicker-evoked vasodilation (mean dilation during the 15 s stimulus) versus baseline vessel diameter for the three vascular layers. G, Mean flicker-evoked dilations for the three vascular layers. ***p < 0.001. Order 1-3 vessels are in the superficial vascular layer. D, deep layer capillaries; I, intermediate layer capillaries; S, superficial layer capillaries (order 4 and higher vessels); V, venule. Abbreviations apply to subsequent figures.
Immunohistochemistry.
Immediately after the animals were killed, the right (experimental) retina was prepared using an established whole-mount protocol (Chan-Ling, 1997). After fixation (4% paraformaldehyde for 1 h) and blocking (10% donkey serum and 1% Triton X-100 in PBS for 4-12 h), retinas were incubated for 3 d with primary antibodies for rabbit-NG2 (1:1000; Millipore AB5320) and mouse-α-smooth muscle actin (α-SMA; 1:800; Dako M0851). Retinas were then washed and incubated for 2 d with the secondary antibodies donkey anti-rabbit-488 and donkey anti-mouse-594 (both 1:750 and from Jackson ImmunoResearch) and the blood vessel marker Isolectin GS-IB4-647 (1:75; Invitrogen I32450). Retinas were mounted on slides and imaged with confocal microscopy. The area of the retinal whole mount that matched the area we measured in vivo was imaged to determine vessel branch order, the strength of α-SMA expression, and the distance of each in vivo measurement location to the nearest pericyte soma. The distinctive pattern of vessel branching facilitated matching the in vivo and whole-mount retinal areas (see Fig. 7A).
Figure 7.

Expression of α-SMA decreases with increasing vessel order in the retinal vasculature. A, A retinal region imaged in vivo (first panel) and as a whole-mount, labeled for the pericyte marker NG2, the contractile protein α-SMA, and with the vessel marker Isolectin-IB4. The three labels are merged in the last panel. Scale bar, 400 μm. B, Retinal vessels are labeled for NG2 and α-SMA with no enzymatic digestion (left panels) and with digestion with collagenase/dispase (right panels). Arrows indicate first-order vessels in which strong α-SMA labeling is observed after enzyme digestion. High branch order vessels often express low levels of α-SMA (arrowheads). Scale bars, 100 μm. C, The strength of α-SMA expression (low, medium, or high) is indicated for vessels of each order.
We measured α-SMA expression by assigning each measured vessel segment an α-SMA expression level of low, medium, or high. This assignment was based on the intensity of α-SMA staining relative to the rest of the vascular tree and the intensity of the fluorophores that labeled NG2 and isolectin. To reveal α-SMA expression in first-order arterioles, antibody penetrance was increased by enzymatically digesting the retinas with collagenase/dispase (2 mg/ml in PBS for 30 min; Roche 269 638) before blocking.
Vessel density.
Vessel density in the three vascular layers was quantified in five immunohistochemically labeled retinas in regions near in vivo-imaged areas that did not contain large arterioles or venules. Vascular layers were easily distinguished from one another by their retinal depth and unique vessel morphologies. Confocal z-stacks of NG2, α-SMA, and isolectin labeling were acquired for each layer. z-stacks were summed and further processed using NIH ImageJ (version 1.46r) to isolate blood vessels from the background. Vessels were skeletonized, and the total blood vessel length in each vascular layer was calculated using the Montpellier ROI ImageJ macro (http://www.mri.cnrs.fr/index.php?m=67&c=110).
Statistical methods.
Data are expressed as mean ± SEM, with n representing the number of series unless otherwise noted. P values for group comparisons are from ANOVA with post hoc Bonferroni's tests for parametric data and from Kruskal–Wallis tests with post hoc Dunn's tests for nonparametric data. A repeated-measures ANOVA was performed to identify differences in capillary layer density (Fig. 2C). Least-squares linear regression was performed to test for an effect of pericyte distance on capillary dilation (see Fig. 6B). Because of a high degree of skew, onset time data are reported as median ± median absolute deviation and presented in Figure 4D as box plots. For all analyses, significance was defined as p < 0.05. Statistical analysis was performed using GraphPad Prism (version 5) and MATLAB.
Figure 6.

Pericyte proximity does not determine dilation amplitude. A, Whole-mount confocal image of superficial layer vessels labeled for α-SMA (red) and NG2 (green). Pericyte somata are indicated by arrowheads. Scale bar, 20 μm. B, Scatter plot of flicker-evoked dilation versus distance from pericyte somata for capillaries in the three vascular layers. C, Time course of flicker-evoked capillary dilation for each of the three vascular layers, measured at sites close (≤10 μm), at a medium distance (>10 and ≤25 μm), and far (>25 μm) from pericyte somata. D, Mean distance from pericyte somata for capillaries in each vascular layer that responded to flicker with a dilation (Dil), a constriction (Con), or no change in diameter (NC).
Figure 4.

Flicker-evoked response frequency and onset time in the retinal vasculature. A, Percentage of vessels responding to flicker stimulation, defined as a response >3 SDs above baseline. B, Time course of flicker-evoked dilation of vessels in the superficial vascular layer. Note that the flicker stimulus (open bar) continues beyond the end of the traces. C, Vessel diameter traces in B are normalized for comparison of onset times. D, The onset time of vessels of different order, shown as box plots, with the + symbol indicating outliers. For details of onset time calculation, see Materials and Methods.
Results
The retinal vasculature is composed of three distinct vascular layers. The central retinal artery and vein branch at the optic disc to form arterioles and venules, which lie on the retinal surface adjacent to the vitreous humor. Branches of the arterioles make up the superficial vascular layer. We define these vessels by order. First-order arterioles branch directly off of the central retinal artery, and each subsequent branch has an incrementally higher order (Fig. 1A). We define first-, second-, and third-order vessels as arterioles and vessels of fourth order and greater as capillaries. The vast majority of capillaries in the superficial layer dive into the retina to form the intermediate vascular layer, a network of capillaries at the border of the inner nuclear and the inner plexiform layers. Capillaries in the intermediate layer traverse parallel to the retinal surface for only a short distance before they dive farther into the retina to form the deep vascular layer, which is a dense, interconnected meshwork of capillaries at the border of the inner nuclear and the outer plexiform layers. The deep layer capillaries connect to small draining venules, which rise back to the retinal surface and connect to large venules. Diving capillaries and draining venules were not characterized in this study. The connectivity of the trilaminar vascular network is schematized in Figure 2A. Morphological analysis suggests that 70% of the blood entering the retina initially flows through the superficial capillaries and then through the intermediate and deep layer capillaries before exiting the retina (Paques et al., 2003).
Vessel density in the trilaminar vascular network
We quantified the density of blood vessels in each of the three vascular layers in the rat retina. Immunohistochemically labeled images of the superficial, intermediate, and deep vascular layers were skeletonized (Fig. 2B), and the linear density of the vessels in each layer was quantified (n = 5 retinas). The vast majority of vessels analyzed were capillaries, although some second- and third-order arterioles were present in the superficial vascular layer, and draining venules were occasionally present in the deep vascular layer. The deep vascular layer had the highest linear density of the three layers (2.85 ± 0.18 μm/100 μm2; p < 0.001), whereas the superficial and intermediate vascular layer densities did not differ (1.74 ± 0.10 and 1.56 ± 0.13 μm/100 μm2; Fig. 2C). These values are very similar to those measured in adult mice (Ganesan et al., 2010, 2011) and humans (Tan et al., 2012).
The total blood volume in the three vascular layers can be estimated by multiplying the mean cross-sectional area of the blood vessels in each layer by the linear vascular density in that layer. The mean baseline diameters of arterioles, capillaries, and venules are given in Figure 3C and Table 2. We find that total blood volume in the superficial, intermediate, and deep layers is 41.3, 28.2, and 65.3 μm3/100 μm2, respectively. These values are only estimates because they do not include the arterioles of the superficial layer or the draining venules of the deep layer.
Table 2.
Vessel properties
| Vessel order | Arterioles |
Capillaries |
Venules V | ||||
|---|---|---|---|---|---|---|---|
| 1 | 2 | 3 | S | I | D | ||
| Number of series (n rats) | 17 (16) | 17 (13) | 29 (22) | 74 (33) | 29 (18) | 18 (12) | 12 (12) |
| Baseline diameter (μm) | 28.1 ± 1.0 | 10.5 ± 0.8 | 7.6 ± 0.4 | 5.5 ± 0.1 | 4.8 ± 0.1 | 5.4 ± 0.2 | 39.7 ± 3.1 |
| Dilation (%) | 7.5 ± 0.7 | 5.0 ± 0.9 | 2.7 ± 0.4 | 1.8 ± 0.2 | 2.3 ± 0.2 | 1.9 ± 0.3 | 1.1 ± 0.2 |
| % responding | 100.0 | 91.7 | 85.7 | 75.7 | 93.1 | 61.1 | 100.0 |
Vessel orders 1, 2, and 3 are the first, second, and third branches off the central retinal artery. D, Deep layer capillaries; I, intermediate layer capillaries; S, superficial layer vessels of order 4 and higher, defined as capillaries; V, venules are the first branch off the central retinal vein. Dilation indicates mean dilation during the first 4 s of the stimulus, and % responding indicates the percentage of series that showed stimulus-evoked dilations that rose at least 3 SDs above baseline.
Retinal vessels dilate in response to flicker stimulation
We used a 5 Hz diffuse flickering light to evoke functional hyperemia, a stimulus that is known to effectively activate neurons in the inner retina (Miller, 2001). The magnitude of flicker-evoked dilation differed according to vessel order. In the superficial vascular layer, response amplitude decreased with vessel order, with the largest dilations seen in first-order arterioles (Fig. 3A,B,D). The response profile of vessel dilation also varied according to vessel order. First-, second-, and third-order arterioles displayed a clear biphasic response (Fig. 3A), with a first peak occurring within a few seconds of light onset and a second phase developing slowly and peaking at ∼13 s after light onset. Superficial capillaries and venules had more subtle biphasic response profiles. We have observed previously similar flicker-evoked biphasic increases in diameter (Mishra and Newman, 2011), Müller cell Ca2+ signaling (Newman, 2005), and blood velocity (Srienc et al., 2010) in the rat. In contrast, biphasic responses have not been observed in the cat (Buerk et al., 1995) and human (Polak et al., 2002; Garhöfer et al., 2003) retinas. When we quantified dilation as the percentage increase in diameter during the first 4 s after light onset (capturing the first peak), we found that dilations in the first-order arterioles were larger than in third-order arterioles and all other downstream vessels (p < 0.001; Fig. 3D, Table 2). The second-order arteriole dilations were larger than superficial capillaries and venules (p < 0.01).
We then compared the dilatory responses of capillaries in the three vascular layers. Unexpectedly, we found dramatic differences in flicker-evoked capillary dilation in the three layers (Fig. 3E–G). The time courses of flicker-evoked capillary dilation were strikingly different. Dilation of superficial layer capillaries resembled the biphasic dilatory response of upstream arterioles, whereas dilation of deep layer capillaries resembled the downstream venule response. In contrast, the slow, continuously increasing dilation of intermediate layer capillaries resembled neither the responses of superficial or deep layer capillaries nor the responses of arterioles or venules. To quantify the capillary responses in the three vascular layers, we calculated the mean dilation during the entire 15 s stimulus. Intermediate layer capillaries dilated more than twice as much as superficial and deep layer capillaries (2.55 ± 0.30 vs 0.89 ± 0.16 and 0.66 ± 0.28%; p < 0.001; Fig. 3G). In summary, we find that arterioles dilate more than other retinal vessels and likely drive blood flow in the retinal vasculature. Furthermore, the large, slow dilations of capillaries in the intermediate vascular layer suggest the presence of a unique regulatory mechanism.
Arterioles respond rapidly and consistently to flicker stimulation
The location within the vascular network in which functional hyperemia is initiated remains an open question. In the brain, evidence suggests that blood flow first increases in the middle cortical layers before spreading toward the pial surface (Silva and Koretsky, 2002; Tian et al., 2010; Lindvere et al., 2013), although it remains to be determined which vessels are responsible for the initial increase (Hall et al., 2014). We found that, in the retina, arterioles dilate more reliably and faster than downstream capillaries and venules. We first calculated the fraction of vessels that dilated in response to a flicker stimulus. Vessels were considered to respond if their diameter during the stimulus rose at least 3 SDs above baseline. First-order arterioles responded 100% of the time (n = 7). The likelihood of vessel dilation tended to decrease with distance along the vascular tree (Fig. 4A, Table 2). The percentage of vessels responding was 92% (n = 12) for second-order arterioles and fell to as low as 61% (n = 18) for capillaries in the deep vascular layer. Deviating from this trend, 93% (n = 29) of capillaries in the intermediate layer and 100% (n = 5) of venules dilated.
We calculated the time at which vessels began to dilate, the onset time, to determine which vessels responded first to flicker stimulation. We first estimated the onset time by examining the average response profile for each type of vessel (Fig. 4B). When these traces were normalized to the peak response (Fig. 4C), we observed that first- and second-order arterioles dilate most rapidly. Venules had a noticeable delay in their rising phase. A more quantitative assessment was obtained by defining onset as the time it takes for a vessel to reach 20% of its peak dilation (Fig. 4D). There was a general trend for onset time to be shortest for first-, second-, and third-order arterioles (0.73 ± 0.08, 0.70 ± 0.16, and 0.60 ± 0.34 s, n = 7, 11, and 23, respectively) and longer for superficial capillaries (0.97 ± 0.49 s, n = 46). Venules had the longest onset time (1.06 ± 0.49 s, n = 5). However, none of these groups were significantly different from each other.
RBC flux increases in response to flicker stimulation
RBC flux is a direct and sensitive measure of blood flow. If functional hyperemia is controlled solely by the active dilation of retinal arterioles, then the flicker-evoked RBC flux increase in all downstream vessels should be equal. However, this was not what we observed. RBC flux in first-order arterioles and venules, measured using ultrafast line scans with a 2 s flicker stimulus, increased to a peak value of 11% and had nearly identical time courses (Fig. 5A). RBC flux in smaller vessels was measured with standard line scans and a 15 s flicker stimulus. Although the initial flicker-evoked flux increase was equal in second- and third-order arterioles and superficial capillaries, flux changes during the second phase of the response decreased with vessel order (Fig. 5B). We calculated the mean flicker-evoked RBC flux change in superficial layer vessels during the first 2 s of the stimulus. Restricting our analysis to the first 2 s allowed us to include short trials in which only a 2 s stimulus was used. Light-evoked flux increases averaged 4.67 ± 1.71% (n = 8) in first-order arterioles, 8.19 ± 0.71% (n = 5) in second-order arterioles, 6.74 ± 0.75% (n = 6) in third-order arterioles, 11.33 ± 1.47% (n = 32) in capillaries, and 3.94 ± 1.71 (n = 8) in venules (Fig. 5C,D). These flux increases were not significantly different from each other.
Figure 5.

Flicker-evoked increases in RBC flux. A, Time course of flicker-evoked RBC flux increases in first-order arterioles and venules. B, Time course of RBC flux increase in second- and third-order vessels and superficial layer capillaries (S). C, Scatter plot of RBC flux increase (mean during the first 2 s of stimulation) versus baseline vessel diameter, color coded by vessel order. D, Mean increase in flicker-evoked RBC flux (mean during the first 2 s of stimulation) by vessel order. E, Time course of RBC flux increases in the capillaries of the three vascular layers. F, Scatter plot of RBC flux increases in capillaries (mean during the 15 s stimulus) versus baseline flux in the three vascular layers. G, H, Baseline RBC flux (G) and flux increases (H) for capillaries in the three vascular layers. *p < 0.05; ***p < 0.001.
We then characterized flux in the capillaries of the three vascular layers. Baseline flux in superficial, intermediate, and deep vascular layers did not differ (61.0 ± 5.3, 42.2 ± 3.2, and 39.4 ± 3.2 RBCs/s, n = 32, 18, and 12, respectively; Fig. 5G). However, flicker-evoked flux increases were dramatically different (Fig. 5E,F,H). When averaged over the 15 s stimulus period, the flux increase in the intermediate vascular layer was much greater than the increases in the superficial and deep layers (25.65 ± 5.16 vs 0.82 ± 2.17 and 11.27 ± 2.85%; p < 0.001 and p < 0.05, respectively; Fig. 5H).
The time course of flicker-evoked capillary flux changes also differed in the three vascular layers (Fig. 5E). After an initial peak, flux in intermediate capillaries continued to rise throughout the stimulus period, similar to the intermediate layer dilatory response (Fig. 3E). The time course of the flux increase in the deep capillaries also paralleled the dilation in vessels of the deep vascular layer. However, the flux change in superficial layer capillaries did not match the dilatory response. This was particularly evident at the end of the 15 s stimulus period. At this time, flux had increased by 34% in the intermediate vascular layer and 10% in the deep capillary layer. Strikingly, flux had actually decreased by 7% in the superficial capillaries. Because the superficial capillaries remained dilated for the duration of the stimulus, the decrease in flux must reflect a decrease in perfusion pressure in these vessels. This is likely attributable to the diversion of flow to the intermediate and deep layer capillaries.
Pericyte proximity does not predict dilation amplitude
Active regulation of blood flow in capillaries remains a controversial issue (Fernández-Klett et al., 2010; Hall et al., 2014). Active regulation in capillaries would occur via pericytes, because they are the only contractile cells associated with these vessels. We tested whether pericytes in the retina actively regulate blood flow by measuring flicker-evoked capillary dilation as a function of distance from pericyte somata. If pericytes actively regulate blood flow, we would expect flicker-evoked dilation to be greater near pericyte somata, where the circumferential pericyte processes are located, rather than farther away (Nehls and Drenckhahn, 1991; Peppiatt et al., 2006; Kotecki et al., 2010; Dore-Duffy and Cleary, 2011).
We measured flicker-evoked capillary dilation at different sites along capillaries in the three vascular layers. After in vivo experimentation, retinas were removed and labeled for the chondroitin sulfate proteoglycan NG2 to localize pericyte somata, which appeared as protrusions from the capillary wall (Fig. 6A, arrowheads). In vivo and whole-mount images of the same retinal regions were aligned, and the distance from each in vivo measurement site to the nearest pericyte soma was determined. Linear regression analysis showed that the distance from a pericyte was not predictive of the magnitude of capillary dilation, when either all capillaries were pooled together (p = 0.20, n = 105) or capillaries in each vascular layer were tested separately (p = 0.26 in the superficial layer, n = 62; p = 0.91 in the intermediate layer, n = 27; p = 0.12 in the deep layer, n = 16; Fig. 6B). Capillary measurements were sorted into one of three groups according to their distance from a pericyte soma: close (≤10 μm), medium (>10 and ≤25 μm), or far (>25 μm). No clear difference in response amplitude was observed between these groups in any of the vascular layers (n = 17, 31, and 14 for the superficial layer, n = 5, 11, and 11 for the intermediate layer, and n = 5, 7, and 4 for the deep layer; Fig. 6C).
Another way of comparing vascular responses to the proximity of pericytes is to classify each response as dilating, constricting, or not changing. Responses were classified as dilating or constricting if the peak positive or negative response was at least 3 SDs above or below the baseline. There was no difference in the mean distance to pericytes for the three response groups, when either all capillaries were pooled together or each layer was considered separately (Fig. 6D). These results are discussed below in the context of our other findings.
α-SMA expression reflects vascular responsiveness
α-SMA is a contractile protein expressed in pericytes and in the vascular smooth muscle cells that surround arteries and arterioles. Its level of expression has been correlated with the degree of vascular contractility in rat and mouse (Schildmeyer et al., 2000; Hinz et al., 2001; Tomasek et al., 2006). Other reports indicate that a subset of capillary pericytes express α-SMA (Nehls and Drenckhahn, 1991; Bandopadhyay et al., 2001), but we could not resolve α-SMA labeling to the level of individual pericytes. Instead, we categorized each vessel segment that was investigated in vivo as expressing high, medium, or low levels of α-SMA. In agreement with previously published work (Nehls and Drenckhahn, 1991; Hughes and Chan-Ling, 2004), we found that α-SMA expression decreased with increasing vessel order (Fig. 7) and was often undetectable in the smallest capillaries (Fig. 7B, arrowheads). α-SMA expression levels were lower in the intermediate and deep vascular layers than in the superficial vessels (Fig. 7C), although this may have been attributable to reduced antibody penetrance. In our initial studies using a standard immunohistochemistry protocol, α-SMA expression was unexpectedly low in most regions of first-order arterioles compared with second-order arterioles. Collagenase/dispase digestion of the retina before performing immunohistochemistry increased antibody penetration, and we observed more regions of high α-SMA labeling in the first-order arterioles (Fig. 7B, arrows). Enzyme digestion did not disrupt the binding of other antibodies, nor did it change the observation that α-SMA expression decreases with vessel order.
Discussion
Active dilation of arterioles drives functional hyperemia in the retina
We have found that flickering light evokes large, rapid, and consistent dilations in retinal arterioles but smaller, slower, and inconsistent dilations in downstream capillaries and venules. Retinal arterioles are also highly enriched with α-SMA, a protein whose expression levels correlate with contractility (Schildmeyer et al., 2000; Hinz et al., 2001; Tomasek et al., 2006). Together, these results indicate that functional hyperemia in the retina is driven principally by the active dilation of arterioles. Although the initial transient dilation in downstream capillaries and venules is likely attributable to passive stretch, we propose that more complex regulatory mechanisms are at play during prolonged stimulation. These mechanisms, discussed below, can account for the differential blood flow responses we observed in the three vascular layers.
Flicker stimulation evoked small dilations in venules compared with arterioles in our experiments. In the human retina, in contrast, venule and arteriole dilations are of similar magnitude (Polak et al., 2002; Garhöfer et al., 2004; Hammer et al., 2011; Noonan et al., 2013). The difference could arise because venule diameters are only ∼21% larger than arteriole diameters in humans but 41% larger in our rats. Thus, human venules may need to dilate more than rat venules to accommodate the same increase in blood flow.
Baseline blood flow in the three vascular layers
The intermediate vascular layer vessels had the smallest total blood vessel volume and approximately the same baseline flux as the other two vascular layers, indicating that total baseline blood flow was lower in the intermediate layer than in the other two vascular layers. This is consistent with intraretinal pO2 measurements, which reveal high pO2 near the surface of the rat retina and in the region near the deep vascular layer and lower pO2 in the region near the intermediate vascular layer (Lau and Linsenmeier, 2012). Although intermediate layer blood flow is low at baseline, it is likely adequate to support the metabolic needs of the inner retina during constant dim illumination (Miller, 2001).
Differential regulation of blood flow in the three vascular layers
We observed a striking difference in flicker-evoked regulation of capillary blood flow in the three vascular layers of the retina. Stimulation evoked much larger dilations in intermediate layer capillaries than in capillaries of the superficial and deep vascular layers. At the end of the 15 s stimulus, intermediate layer capillaries had dilated 4.4%. According to a modified version of the Hagen-Poiseuille law (Blinder et al., 2013), which accounts for vessel diameter, as well as the effects of hematocrit and RBC interactions with the vessel wall, a 4.4% dilation translates to a 16.5% decrease in vascular resistance. In comparison, the resistance decrease in the superficial and deep layer capillaries was 3.9 and 3.3%.
The intermediate layer capillary dilation had a unique time course, increasing continually for the duration of the stimulus. Dilation of the superficial and deep layer capillaries, in contrast, remained relatively constant throughout the stimulus. Flicker-evoked RBC flux in the intermediate vascular layer continued to rise for the duration of the stimulus, mirroring the dilation observed in intermediate layer capillaries. Averaged over the duration of the stimulus, the intermediate layer flux increase was more than twice that in the deep capillary layer. In contrast, after a transient increase, flux in the superficial layer capillaries declined steadily during stimulation. Third-order arterioles in the superficial vascular layer showed a similar slow flux decline. The flux decrease in the superficial layer vessels is likely attributable to a “steal” effect (Raichle, 1998), with blood being diverted to the intermediate and deep layer capillaries.
The differential regulation of blood flow in the three vascular layers will affect oxygen and nutrient delivery and may reflect differences in neuronal metabolic demand. The intermediate vascular layer supplies neuronal somata and synapses of the inner retina, which are activated more by changes in luminance than by steady illumination (Miller, 2001). Stimulus-evoked activity results in large increases in neuronal metabolism in this layer (Bill and Sperber, 1990; Lau and Linsenmeier, 2012). The large flicker-evoked blood flow increase in intermediate layer capillaries may be necessary to meet the increased metabolism of these neurons. In contrast, the deep vascular layer supplies oxygen and nutrients to the synapses in the outer plexiform layer, which are active under all stimulus conditions. Therefore, there is little metabolic need for large increases in blood flow to the deep vascular layer. The superficial capillary layer primarily supplies the retinal ganglion cells, which are activated by changes in light (Miller, 2001). However, oxygen is supplied to this layer by both the superficial layer vessels and by the vitreous humor, in which pO2 is higher than in the inner retina (Lau and Linsenmeier, 2012). pO2 near the retinal surface may be high enough at rest so that there is no need to increase blood flow during stimulation.
Our observations on blood flow in the trilaminar retinal network correspond well with investigations in the cortex. Although the cortex is a stratified tissue, there are no discrete cortical vascular layers as there are in the retina. Nevertheless, fMRI (Smirnakis et al., 2007; Kim and Kim, 2010; Goense et al., 2012), two-photon imaging (Lindvere et al., 2013), laser Doppler flowmetry (Norup Nielsen and Lauritzen, 2001), and autoradiography (Gerrits et al., 2000) studies indicate that sensory stimulation results in greater increases in blood flow in the middle cortical layers, including layer IV, where neuronal and vascular density (Smirnakis et al., 2007) and stimulation-induced neuronal signaling are highest. Similar to the retina, this differential regulation of blood flow in the cortex may serve to supply blood to regions of high metabolic need (Carroll and Wong-Riley, 1984; Norup Nielsen and Lauritzen, 2001; Goense et al., 2012).
Active capillary regulation
The large, slowly developing dilation of intermediate layer capillaries, which differs markedly from the responses of upstream arterioles, is most likely caused by active dilation. Active capillary dilation would account for the unique time course we observed in the intermediate layer capillaries, as well as for the reduction in RBC flux in superficial layer vessels. Although still controversial, studies in several brain regions, including the cortex (Chen et al., 2011), olfactory bulb (Chaigneau et al., 2003), and subventricular zone (Lacar et al., 2012), also suggest that capillaries actively regulate blood flow. Recent observations in the somatosensory cortex provide strong evidence that pericyte relaxation mediates the active capillary response (Hall et al., 2014).
Dilation of intermediate layer capillaries is presumably mediated by active relaxation of the pericytes on these vessels. However, we found no evidence for active pericyte dilation of capillaries. Furthermore, we found that α-SMA expression in the intermediate and deep layer capillaries is lower than in superficial layer vessels. These apparently contradictory findings could be attributable to several factors. First, our assumption that pericyte-mediated dilation is greater near pericyte somata than farther away could be false. This possibility is supported by recent observations in the cortex (Hall et al., 2014), where capillary dilations at pericyte somata and processes were equal but were smaller where pericytes were absent. In the retina, where pericyte density is higher than in the cortex (Frank et al., 1987), it is difficult to find regions where pericytes are absent. Given that we used a diffuse stimulus to activate the retina, that retinal pericytes are closely spaced, and that they are electrically coupled (Puro, 2007), it is not surprising that all regions of capillaries with pericyte coverage dilate to a similar extent. Second, we did not characterize flicker-evoked dilation in the diving capillaries connecting superficial layer vessels to intermediate and deep layer capillaries. It is possible that pericyte-mediated dilations are present in these vessels. Third, although α-SMA expression in the intermediate and deep layer capillaries is low, capillary pericytes may express enough actin to mediate active responses. The low levels of α-SMA expression we observed in capillaries may account for their slow dilations. Pericytes may also express other actin isoforms (Tomasek et al., 2006), although their role in capillary dilation is unclear.
Passive capillary regulation
We propose that the slow dilation observed in the intermediate layer capillaries is attributable to active dilation of the vessels. However, passive stretch may also contribute to this response. The time course of the dilation is similar to blood volume increases measured in the brain in response to sensory stimulation (Mandeville et al., 1999; Drew et al., 2011; Barrett et al., 2012). These slow volume increases have been attributed to the windkessel effect, in which active arteriole dilation results in a pressure increase that passively dilates downstream vessels (Mandeville et al., 1999; Kong et al., 2004; Huppert et al., 2007; Drew et al., 2011; Barrett et al., 2012). The windkessel effect does not, in itself, account for differential dilation of the three capillary layers. Several other factors could contribute to differential dilation. First, intermediate layer capillaries, which have a smaller total volume than capillaries in the other two layers, would also have a higher resistance. Dilation of upstream arterioles would generate greater pressure increases in intermediate layer capillaries, leading to larger passive stretch. Second, capillaries in the intermediate layer could have a higher compliance, resulting in greater stretch for a given pressure increase.
Conclusions
Our results indicate that arterioles are primarily responsible for generating functional hyperemia in the retina. These vessels display large, rapid, and consistent flicker-evoked dilations and high α-SMA expression. We also found that blood flow through the three vascular layers in the retina is differentially regulated. Prolonged flicker stimulation evokes a large, slowly developing dilation and an increase in flux in intermediate layer capillaries that are not observed in the other two vascular layers. Active capillary dilation likely contributes to this response.
Footnotes
This work was supported by National Institutes of Health Grants EY004077 and 5T32EY007133 and Fondation Leducq. We thank David Attwell, Anna Devor, and Anusha Mishra for their comments on this manuscript, Michael Burian for his invaluable technical assistance, and Kyle Biesecker, Michael Burian, Joanna Kur, and Anja Srienc for their helpful discussions and for reviewing this manuscript.
The authors declare no competing financial interests.
References
- Attwell D, Buchan AM, Charpak S, Lauritzen M, Macvicar BA, Newman EA. Glial and neuronal control of brain blood flow. Nature. 2010;468:232–243. doi: 10.1038/nature09613. [DOI] [PMC free article] [PubMed] [Google Scholar]
- Bandopadhyay R, Orte C, Lawrenson JG, Reid AR, De Silva S, Allt G. Contractile proteins in pericytes at the blood-brain and blood-retinal barriers. J Neurocytol. 2001;30:35–44. doi: 10.1023/A:1011965307612. [DOI] [PubMed] [Google Scholar]
- Barrett MJ, Tawhai MH, Suresh V. Arteries dominate volume changes during brief functional hyperemia: evidence from mathematical modelling. Neuroimage. 2012;62:482–492. doi: 10.1016/j.neuroimage.2012.05.005. [DOI] [PubMed] [Google Scholar]
- Bill A, Sperber GO. Aspects of oxygen and glucose consumption in the retina: effects of high intraocular pressure and light. Graefes Arch Clin Exp Ophthalmol. 1990;228:124–127. doi: 10.1007/BF00935720. [DOI] [PubMed] [Google Scholar]
- Blinder P, Tsai PS, Kaufhold JP, Knutsen PM, Suhl H, Kleinfeld D. The cortical angiome: an interconnected vascular network with noncolumnar patterns of blood flow. Nat Neurosci. 2013;16:889–897. doi: 10.1038/nn.3426. [DOI] [PMC free article] [PubMed] [Google Scholar]
- Boas DA, Jones SR, Devor A, Huppert TJ, Dale AM. A vascular anatomical network model of the spatio-temporal response to brain activation. Neuroimage. 2008;40:1116–1129. doi: 10.1016/j.neuroimage.2007.12.061. [DOI] [PMC free article] [PubMed] [Google Scholar]
- Buerk DG, Riva CE, Cranstoun SD. Frequency and luminance-dependent blood-flow and K+ ion changes during flicker stimuli in cat optic nerve head. Invest Ophthalmol Vis Sci. 1995;36:2216–2227. [PubMed] [Google Scholar]
- Carroll EW, Wong-Riley MT. Quantitative light and electron microscopic analysis of cytochrome oxidase-rich zones in the striate cortex of the squirrel monkey. J Comp Neurol. 1984;222:1–17. doi: 10.1002/cne.902220102. [DOI] [PubMed] [Google Scholar]
- Chaigneau E, Oheim M, Audinat E, Charpak S. Two-photon imaging of capillary blood flow in olfactory bulb glomeruli. Proc Natl Acad Sci U S A. 2003;100:13081–13086. doi: 10.1073/pnas.2133652100. [DOI] [PMC free article] [PubMed] [Google Scholar]
- Chan-Ling T. Glial, vascular, and neuronal cytogenesis in whole-mounted cat retina. Microsc Res Tech. 1997;36:1–16. doi: 10.1002/(SICI)1097-0029(19970101)36:1<1::AID-JEMT1>3.0.CO%3B2-V. [DOI] [PubMed] [Google Scholar]
- Chen BR, Bouchard MB, McCaslin AFH, Burgess SA, Hillman EMC. High-speed vascular dynamics of the hemodynamic response. Neuroimage. 2011;54:1021–1030. doi: 10.1016/j.neuroimage.2010.09.036. [DOI] [PMC free article] [PubMed] [Google Scholar]
- Devor A, Tian P, Nishimura N, Teng IC, Hillman EM, Narayanan SN, Ulbert I, Boas DA, Kleinfeld D, Dale AM. Suppressed neuronal activity and concurrent arteriolar vasoconstriction may explain negative blood oxygenation level-dependent signal. J Neurosci. 2007;27:4452–4459. doi: 10.1523/JNEUROSCI.0134-07.2007. [DOI] [PMC free article] [PubMed] [Google Scholar]
- Dore-Duffy P, Cleary K. Morphology and properties of pericytes. Methods Mol Biol. 2011;686:49–68. doi: 10.1007/978-1-60761-938-3_2. [DOI] [PubMed] [Google Scholar]
- Drew PJ, Shih AY, Kleinfeld D. Fluctuating and sensory-induced vasodynamics in rodent cortex extend arteriole capacity. Proc Natl Acad Sci U S A. 2011;108:8473–8478. doi: 10.1073/pnas.1100428108. [DOI] [PMC free article] [PubMed] [Google Scholar]
- Fernández-Klett F, Offenhauser N, Dirnagl U, Priller J, Lindauer U. Pericytes in capillaries are contractile in vivo, but arterioles mediate functional hyperemia in the mouse brain. Proc Natl Acad Sci U S A. 2010;107:22290–22295. doi: 10.1073/pnas.1011321108. [DOI] [PMC free article] [PubMed] [Google Scholar]
- Frank RN, Dutta S, Mancini MA. Pericyte coverage is greater in the retinal than in the cerebral capillaries of the rat. Invest Ophthalmol Vis Sci. 1987;28:1086–1091. [PubMed] [Google Scholar]
- Ganesan P, He S, Xu H. Development of an image-based network model of retinal vasculature. Ann Biomed Eng. 2010;38:1566–1585. doi: 10.1007/s10439-010-9942-4. [DOI] [PubMed] [Google Scholar]
- Ganesan P, He S, Xu H. Development of an image-based model for capillary vasculature of retina. Comput Methods Prog Biomed. 2011;102:35–46. doi: 10.1016/j.cmpb.2010.12.009. [DOI] [PubMed] [Google Scholar]
- Garhöfer G, Zawinka C, Huemer KH, Schmetterer L, Dorner GT. Flicker light-induced vasodilatation in the human retina: effect of lactate and changes in mean arterial pressure. Invest Ophthalmol Vis Sci. 2003;44:5309–5314. doi: 10.1167/iovs.03-0587. [DOI] [PubMed] [Google Scholar]
- Garhöfer G, Zawinka C, Resch H, Huemer KH, Dorner GT, Schmetterer L. Diffuse luminance flicker increases blood flow in major retinal arteries and veins. Vision Res. 2004;44:833–838. doi: 10.1016/j.visres.2003.11.013. [DOI] [PubMed] [Google Scholar]
- Genevois O, Paques M, Simonutti M, Sercombe R, Seylaz J, Gaudric A, Brouland JP, Sahel J, Vicaut E. Microvascular remodeling after occlusion-recanalization of a branch retinal vein in rats. Invest Ophthalmol Vis Sci. 2004;45:594–600. doi: 10.1167/iovs.03-0764. [DOI] [PubMed] [Google Scholar]
- Gerrits RJ, Raczynski C, Greene AS, Stein EA. Regional cerebral blood flow responses to variable frequency whisker stimulation: an autoradiographic analysis. Brain Res. 2000;864:205–212. doi: 10.1016/S0006-8993(00)02142-9. [DOI] [PubMed] [Google Scholar]
- Goense J, Merkle H, Logothetis NK. High-resolution fMRI reveals laminar differences in neurovascular coupling between positive and negative BOLD responses. Neuron. 2012;76:629–639. doi: 10.1016/j.neuron.2012.09.019. [DOI] [PMC free article] [PubMed] [Google Scholar]
- Hall CN, Reynell C, Gesslein B, Hamilton NB, Mishra A, Sutherland BA, O'Farrell FM, Buchan AM, Lauritzen M, Attwell D. Capillary pericytes regulate cerebral blood flow in health and disease. Nature. 2014;508:55–60. doi: 10.1038/nature13165. [DOI] [PMC free article] [PubMed] [Google Scholar]
- Hamilton NB, Attwell D, Hall CN. Pericyte-mediated regulation of capillary diameter: a component of neurovascular coupling in health and disease. Front Neuroenergetics. 2010;2.pii:5. doi: 10.3389/fnene.2010.00005. [DOI] [PMC free article] [PubMed] [Google Scholar]
- Hammer M, Vilser W, Riemer T, Liemt F, Jentsch S, Dawczynski J, Schweitzer D. Retinal venous oxygen saturation increases by flicker light stimulation. Invest Ophthalmol Vis Sci. 2011;52:274–277. doi: 10.1167/iovs.10-5537. [DOI] [PubMed] [Google Scholar]
- Hinz B, Celetta G, Tomasek JJ, Gabbiani G, Chaponnier C. Alpha-smooth muscle actin expression upregulates fibroblast contractile activity. Mol Biol Cell. 2001;12:2730–2741. doi: 10.1091/mbc.12.9.2730. [DOI] [PMC free article] [PubMed] [Google Scholar]
- Hughes S, Chan-Ling T. Characterization of smooth muscle cell and pericyte differentiation in the rat retina in vivo. Invest Ophthalmol Vis Sci. 2004;45:2795–2806. doi: 10.1167/iovs.03-1312. [DOI] [PubMed] [Google Scholar]
- Huppert TJ, Allen MS, Benav H, Jones PB, Boas DA. A multicompartment vascular model for inferring baseline and functional changes in cerebral oxygen metabolism and arterial dilation. J Cereb Blood Flow Metab. 2007;27:1262–1279. doi: 10.1038/sj.jcbfm.9600435. [DOI] [PMC free article] [PubMed] [Google Scholar]
- Ivanova E, Toychiev AH, Yee CW, Sagdullaev BT. Intersublaminar vascular plexus: the correlation of retinal blood vessels with functional sublaminae of the inner plexiform layer. Invest Ophthalmol Vis Sci. 2014;55:78–86. doi: 10.1167/iovs.13-13196. [DOI] [PMC free article] [PubMed] [Google Scholar]
- Khoobehi B, Peyman GA, Carnahan LG, Hayes RL. A novel approach for freeze-frame video determination of volumetric blood flow in the rat retina. Ophthalmic Surg Lasers Imaging. 2003;34:505–514. [PubMed] [Google Scholar]
- Kim T, Kim SG. Cortical layer-dependent arterial blood volume changes: improved spatial specificity relative to BOLD fMRI. Neuroimage. 2010;49:1340–1349. doi: 10.1016/j.neuroimage.2009.09.061. [DOI] [PMC free article] [PubMed] [Google Scholar]
- Kong Y, Zheng Y, Johnston D, Martindale J, Jones M, Billings S, Mayhew J. A model of the dynamic relationship between blood flow and volume changes during brain activation. J Cereb Blood Flow Metab. 2004;24:1382–1392. doi: 10.1097/01.WCB.0000141500.74439.53. [DOI] [PubMed] [Google Scholar]
- Kotecki M, Zeiger AS, Van Vliet KJ, Herman IM. Calpain- and talin-dependent control of microvascular pericyte contractility and cellular stiffness. Microvasc Res. 2010;80:339–348. doi: 10.1016/j.mvr.2010.07.012. [DOI] [PMC free article] [PubMed] [Google Scholar]
- Lacar B, Herman P, Hartman NW, Hyder F, Bordey A. S phase entry of neural progenitor cells correlates with increased blood flow in the young subventricular zone. PLoS One. 2012;7:e31960. doi: 10.1371/journal.pone.0031960. [DOI] [PMC free article] [PubMed] [Google Scholar]
- Lau JC, Linsenmeier RA. Oxygen consumption and distribution in the Long-Evans rat retina. Exp Eye Res. 2012;102:50–58. doi: 10.1016/j.exer.2012.07.004. [DOI] [PMC free article] [PubMed] [Google Scholar]
- Lindvere L, Janik R, Dorr A, Chartash D, Sahota B, Sled JG, Stefanovic B. Cerebral microvascular network geometry changes in response to functional stimulation. Neuroimage. 2013;71:248–259. doi: 10.1016/j.neuroimage.2013.01.011. [DOI] [PubMed] [Google Scholar]
- Mandeville JB, Marota JJ, Ayata C, Zaharchuk G, Moskowitz MA, Rosen BR, Weisskoff RM. Evidence of a cerebrovascular postarteriole windkessel with delayed compliance. J Cereb Blood Flow Metab. 1999;19:679–689. doi: 10.1097/00004647-199906000-00012. [DOI] [PubMed] [Google Scholar]
- Miller RF. The physiology and morphology of the vertebrate retina. In: Ryan SJ, editor. Retina. St. Louis: Mosby; 2001. pp. 138–170. [Google Scholar]
- Mishra A, Newman EA. Aminoguanidine reverses the loss of functional hyperemia in a rat model of diabetic retinopathy. Front Neuroenergetics. 2011;3:10. doi: 10.3389/fnene.2011.00010. [DOI] [PMC free article] [PubMed] [Google Scholar]
- Nehls V, Drenckhahn D. Heterogeneity of microvascular pericytes for smooth muscle type alpha-actin. J Cell Biol. 1991;113:147–154. doi: 10.1083/jcb.113.1.147. [DOI] [PMC free article] [PubMed] [Google Scholar]
- Newman EA. Calcium increases in retinal glial cells evoked by light-induced neuronal activity. J Neurosci. 2005;25:5502–5510. doi: 10.1523/JNEUROSCI.1354-05.2005. [DOI] [PMC free article] [PubMed] [Google Scholar]
- Noonan JE, Nguyen TT, Man RE, Best WJ, Wang JJ, Lamoureux EL. Retinal arteriolar dilation to flicker light is reduced on short-term retesting. Invest Ophthalmol Vis Sci. 2013;54:7764–7768. doi: 10.1167/iovs.13-12525. [DOI] [PubMed] [Google Scholar]
- Norup Nielsen A, Lauritzen M. Coupling and uncoupling of activity-dependent increases of neuronal activity and blood flow in rat somatosensory cortex. J Physiol. 2001;533.3:773–785. doi: 10.1111/j.1469-7793.2001.00773.x. [DOI] [PMC free article] [PubMed] [Google Scholar]
- Paques M, Tadayoni R, Sercombe R, Laurent P, Genevois O, Gaudric A, Vicaut E. Structural and hemodynamic analysis of the mouse retinal microcirculation. Invest Ophthalmol Vis Sci. 2003;44:4960–4967. doi: 10.1167/iovs.02-0738. [DOI] [PubMed] [Google Scholar]
- Peppiatt CM, Howarth C, Mobbs P, Attwell D. Bidirectional control of CNS capillary diameter by pericytes. Nature. 2006;443:700–704. doi: 10.1038/nature05193. [DOI] [PMC free article] [PubMed] [Google Scholar]
- Polak K, Schmetterer L, Riva CE. Influence of flicker frequency on flicker-induced changes of retinal vessel diameter. Invest Ophthalmol Vis Sci. 2002;43:2721–2726. [PubMed] [Google Scholar]
- Puro DG. Physiology and pathobiology of the pericyte-containing retinal microvasculature: new developments. Microcirculation. 2007;14:1–10. doi: 10.1080/10739680601072099. [DOI] [PubMed] [Google Scholar]
- Raichle ME. Behind the scenes of functional brain imaging: a historical and physiological perspective. Proc Natl Acad Sci U S A. 1998;95:765–772. doi: 10.1073/pnas.95.3.765. [DOI] [PMC free article] [PubMed] [Google Scholar]
- Schildmeyer LA, Braun R, Taffet G, Debiasi M, Burns AE, Bradley A, Schwartz RJ. Impaired vascular contractility and blood pressure homeostasis in the smooth muscle alpha-actin null mouse. FASEB J. 2000;14:2213–2220. doi: 10.1096/fj.99-0927com. [DOI] [PubMed] [Google Scholar]
- Schönfelder U, Hofer A, Paul M, Funk RH. In situ observation of living pericytes in rat retinal capillaries. Microvasc Res. 1998;56:22–29. doi: 10.1006/mvre.1998.2086. [DOI] [PubMed] [Google Scholar]
- Silva AC, Koretsky AP. Laminar specificity of functional MRI onset times during somatosensory stimulation in rat. Proc Natl Acad Sci U S A. 2002;99:15182–15187. doi: 10.1073/pnas.222561899. [DOI] [PMC free article] [PubMed] [Google Scholar]
- Smirnakis SM, Schmid MC, Weber B, Tolias AS, Augath M, Logothetis NK. Spatial specificity of BOLD versus cerebral blood volume fMRI for mapping cortical organization. J Cereb Blood Flow Metab. 2007;27:1248–1261. doi: 10.1038/sj.jcbfm.9600434. [DOI] [PubMed] [Google Scholar]
- Srienc AI, Kurth-Nelson ZL, Newman EA. Imaging retinal blood flow with laser speckle flowmetry. Front Neuroenergetics. 2010;2.pii:128. doi: 10.3389/fnene.2010.00128. [DOI] [PMC free article] [PubMed] [Google Scholar]
- Srienc AI, Kornfield TE, Mishra A, Burian MA, Newman EA. Assessment of glial function in the in vivo retina. In: Milner R, editor. Astrocytes: methods and protocols. New York: Springer; 2012. pp. 499–514. [DOI] [PMC free article] [PubMed] [Google Scholar]
- Stahl A, Connor KM, Sapieha P, Chen J, Dennison RJ, Krah NM, Seaward MR, Willett KL, Aderman CM, Guerin KI, Hua J, Löfqvist C, Hellström A, Smith LE. The mouse retina as an angiogenesis model. Invest Ophthalmol Vis Sci. 2010;51:2813–2826. doi: 10.1167/iovs.10-5176. [DOI] [PMC free article] [PubMed] [Google Scholar]
- Tan PE, Yu PK, Balaratnasingam C, Cringle SJ, Morgan WH, McAllister IL, Yu DY. Quantitative confocal imaging of the retinal microvasculature in the human retina. Invest Ophthalmol Vis Sci. 2012;53:5728–5736. doi: 10.1167/iovs.12-10017. [DOI] [PubMed] [Google Scholar]
- Tian P, Teng IC, May LD, Kurz R, Lu K, Scadeng M, Hillman EM, De Crespigny AJ, D'Arceuil HE, Mandeville JB, Marota JJ, Rosen BR, Liu TT, Boas DA, Buxton RB, Dale AM, Devor A. Cortical depth-specific microvascular dilation underlies laminar differences in blood oxygenation level-dependent functional MRI signal. Proc Natl Acad Sci U S A. 2010;107:15246–15251. doi: 10.1073/pnas.1006735107. [DOI] [PMC free article] [PubMed] [Google Scholar]
- Tomasek JJ, Haaksma CJ, Schwartz RJ, Vuong DT, Zhang SX, Ash JD, Ma JX, Al-Ubaidi MR. Deletion of smooth muscle a-actin alters blood-retina barrier permeability and retinal function. Invest Ophthalmol Vis Sci. 2006;47:2693–2700. doi: 10.1167/iovs.05-1297. [DOI] [PubMed] [Google Scholar]
- Unthank JL, Lash JM, Nixon JC, Sidner RA, Bohlen HG. Evaluation of carbocyanine-labeled erythrocytes for microvascular measurements. Microvasc Res. 1993;45:193–210. doi: 10.1006/mvre.1993.1018. [DOI] [PubMed] [Google Scholar]
- Vanzetta I, Hildesheim R, Grinvald A. Compartment-resolved imaging of activity-dependent dynamics of cortical blood volume and oximetry. J Neurosci. 2005;25:2233–2244. doi: 10.1523/JNEUROSCI.3032-04.2005. [DOI] [PMC free article] [PubMed] [Google Scholar]