

Abstract
Lactation is associated with significant alterations in both body composition and bone mass. Systemic and local skeletal factors such as receptor activator of nuclear factor κ-B ligand (RANKL), PTHrP, calcitonin, and estrogen are known to regulate bone remodeling during and after lactation. Fibroblast growth factor 21 (FGF-21) may function as an endocrine factor to regulate body composition changes during lactation by inducing gluconeogenesis and fatty acid oxidation. In this study, we hypothesized that the metabolic changes during lactation were due in part to increased circulating FGF-21, which in turn could accentuate bone loss. We longitudinally characterized body composition in C57BL/6J (B6) mice during (day 7 and day 21 of lactation) and after normal lactation (day 21 postlactation). At day 7 of lactation, areal bone density declined by 10% (P < .001), bone resorption increased (P < .0001), percent fat decreased by 20%, energy expenditure increased (P < .01), and markers of brown-like adipogenesis were suppressed in the inguinal depot and in preformed brown adipose tissue. At day 7 of lactation there was a 2.4-fold increase in serum FGF-21 vs baseline (P < .0001), a 8-fold increase in hepatic FGF-21 mRNA (P < .03), a 2-fold increase in undercarboxylated osteocalcin (Glu13 OCn) (P < .01), and enhanced insulin sensitivity. Recovery of total areal bone density was noted at day 21 of lactation, whereas the femoral trabecular bone volume fraction was still reduced (P < .01). Because FGF-21 levels rose rapidly at day 7 of lactation in B6 lactating mice, we next examined lactating mice with a deletion in the Fgf21 gene. Trabecular and cortical bone masses were maintained throughout lactation in FGF-21−/− mice, and pup growth was normal. Compared with lactating control mice, lactating FGF-21−/− mice exhibited an increase in bone formation, but no change in bone resorption. In conclusion, in addition to changes in calciotropic hormones, systemic FGF-21 plays a role in skeletal remodeling and changes in body composition during lactation in B6 mice.
Lactation is essential for mammalian survival (1, 2). Previous work established that there was uncoupling of bone remodeling during the early phases of lactation in mice, rats, and humans, with high rates of bone resorption and decreased bone formation (3–7). Uncoupling in skeletal remodeling has been variously ascribed to high circulating receptor activator of nuclear factor κ-B ligand (RANKL) concentrations, low estrogen levels, and increased PTHrP, although other factors are likely to be operative (8–10). The postlactation period is characterized by skeletal recovery through poorly understood mechanisms although it has been related to osteoclast apoptosis, refilling of lacunae by osteocytes, and an independent anabolic-rebuilding period (4, 11, 12). Several candidates have been suggested as mediators of the latter state, including estrogen, oxytocin, PTHrP, IGF-I, and others (11, 13, 14). Conditional deletion of PTHrP in mammary tissue reduced the magnitude of bone loss between days 4 and 12 of lactation but the extent of skeletal recovery was not examined (8, 15). It is also not clear what factors regulate the body composition changes that accompany lactation. Fibroblast growth factor (FGF) 21 is a member of a subfamily of FGFs (which include FGF-15/19 and FGF-23) that lack the FGF heparin-binding domain. FGF-21 functions as an endocrine factor by inducing gluconeogenesis and fatty acid oxidation during stressful conditions such as fasting, when increased substrate utilization is required to maintain homeostasis (16). In this study, we hypothesized that the metabolic changes during lactation were due in part to increased circulating FGF-21, which in turn could accentuate bone loss.
Immediately after lactation, there are dramatic changes in body composition and a shift in energy utilization from mammary tissue toward bone to ensure skeletal restoration. In this study, we systematically examined whether the skeletal changes during lactation could be related to metabolic determinants as well as calciotropic factors. Our results confirm that there are profound, but reversible, changes in whole-body and skeletal metabolism during and after lactation. We also found that FGF-21 is one of several factors modulating substrate utilization and bone turnover during lactation.
Materials and Methods
Animals
C57BL/6J (B6) mice were purchased from The Jackson Laboratory. Eight-week-old B6 female mice were mated, and after the mice became pregnant, males were removed. After birth, lactating females were studied at day 7 of lactation (d7Lac), at day 21 of lactation (d21Lac), and at day 21 postlactation (d21Post). Mice were weaned at 21 days after birth; therefore, the d7Lac time point examines early lactation and the d21Lac time point examines late lactation, assuming lactation ends shortly after weaning at 21 days after birth. The d21Post time point examines the effect of lactation 21 days postweaning. Age-matched nonlactating B6 control mice were also maintained for each time point (d7Lac vs 12-week-old nonlactating control, d21Lac vs 15 weeks nonlactating control, and d21Post vs 20 weeks nonlactating control). All age-matched animals were ±5 days of lactating animals; this allowed us to take into consideration variations in the time of conception. FGF-21–null mice have been described (16). The FGF-21–null mice were kept on a B6 background (backcrossed for at least 6 generations). FGF-21 knockout (KO) and wild-type (WT) littermates from the last backcross were then bred as WT × WT and KO × KO, which provided the mice for all the FGF-21 studies. FGF-21 KO and WT mice were set up for mating at 10 weeks of age, and samples were harvested at day 14 of lactation (d14Lac) with age-matched nonlactating virgin controls (16 weeks old). Mice were maintained at 25°C on a 14-hour dark/10-hour light cycle with standard regular chow (Harlan Tekland). All the mice were fed standard chow containing 4% fat ad libitum. All experimental studies and procedures involving mice were reviewed and approved by the institutional animal care and use committees of the Maine Medical Center Research Institute (Scarborough, Maine) and The University of Texas Southwestern Medical Center (Dallas, Texas).
Dual-energy X-ray absorptiometry (DXA)
DXA scans for whole-body and femoral areal bone mineral density (aBMD (milligrams per square centimeter) and body composition exclusive of the head were performed using the PIXImus densitometer (GE Lunar) as described previously (10). The PIXImus was calibrated daily with a phantom provided by the manufacturer.
Microcomputed tomography (μCT)
The microarchitecture of the distal trabecular bone and midshaft cortical bone of the femur were analyzed by μCT (resolution 10 μm, VivaCT-40 scanner; Scanco Medical AG) as published previously (17). The VivaCT-40 scanner was calibrated weekly using a phantom provided by Scanco Medical AG. Trabecular bone volume/total volume (BV/TV) and microarchitecture were evaluated in the secondary spongiosa, starting proximately at 0.6 mm proximal to the distal femoral growth plate and extending proximally 1.5 mm. Measurements included BV/TV, trabecular number, trabecular thickness, and trabecular separation. Scans for the cortical region were measured at the midpoint of each femur, measuring the average bone area, total cross-sectional area, bone area/total area, cortical thickness, and cortical porosity.
Osmium μCT analysis for marrow adipose tissue
Staining for marrow fat requires the use of osmium tetroxide (OsO4) in a 4-step procedure as reported previously as a modification of the μCT protocol (17, 18). Mouse tibia were isolated and then fixed in 10% neutral buffered formalin. Tibias were then decalcified with EDTA at 4°C for 14 days. The decalcified bones were immersed in OsO4 for 48 hours at room temperature before imaging with a VivaCT-40 scanner using a voxel size of 10 μm. In brief, 4 volumes of interest (VOIs) within the marrow space, extending 230 mm, were defined by their position along the z-axis. The first VOI began 230 mm from the proximal end of the tibia, and each subsequent VOI began 1.2 mm distal to the previous VOI. The fractional volume of osmium-stained fat within the VOIs was determined using the Scanco 3-dimensional bone morphometry evaluation program with a threshold of 420 and Gaussian filtering (s = 0.8, support = 1).
Bone histomorphometry
Static and dynamic histomorphometry measurements were analyzed between lactating and age-matched nonlactating control B6 mice at 12 weeks vs d7Lac, 15 weeks vs d21Lac, and 20 weeks vs d21Post. FGF-21 KO and WT mice were analyzed at d14Lac vs 13-week-old nonlactating controls. Mice were injected with 20 mg/kg calcein and demeclocycline intraperitoneally 9 and 2 days, respectively, before sample collection. Femurs were analyzed as described, and standard nomenclature was used (17, 19).
RNA isolation and quantitative real-time PCR
Total RNA was prepared using an RNeasy Mini Kit (QIAGEN) for liver and mammary tissue or using a standard TRIzol (Sigma-Aldrich) method for tibias. Total RNA was extracted from lipid depots using an RNeasy Lipid Tissue Mini Kit (QIAGEN). cDNA was generated using a random hexamer and reverse transcriptase (SuperScript III; Invitrogen), according to the manufacturer's instructions. mRNA expression analysis was carried out using an iQ SYBR Green Supermix with an iQ5 thermal cycler and detection system (Bio-Rad Laboratories). Relative expression of mRNA was determined after normalization to hypoxanthine guanine phosphoribosyl transferase (Hprt) levels in addition to β-2 microglobulin (B2M) (inguinal fat and liver), 18s (interscapular fat), or ribosomal protein L13A (Rpl13a) (mammary tissue and tibia). Primers were designed and tested to be 95% to 100% efficient by PrimerDesign (Southampton, UK) unless otherwise noted. All primer sequences are listed in Supplemental Table 1.
Serum biochemical parameters
Serum concentrations of the amino-terminal propeptide of type 1 procollagen (P1NP), cross-linked C-telopeptide (CTX), and IGF-I were measured with the rat/mouse P1NP enzyme immunoassay, the RatLaps EIA, and the mouse IGF-I high-sensitivity immunoassay, respectively (Immunodiagnostic Systems). The assay sensitivities were 0.7, 2, and 63 ng/mL for P1NP, CTx, and IGF-I, respectively. The intraassay variations were 6.3%, 6.9%, and 6.8%, and the interassay variations were 8.5%, 12%, and 7.3%, respectively. Serum concentrations of insulin and sclerostin were measured with the mouse insulin immunoassay, and mouse sclerostin immunoassay, respectively (ALPCO). The assay sensitivities were 0.12 ng/mL and 17.4 pg/mL for insulin and sclerostin, respectively. The intraassay variations were 3.7% and 6.4%, and the interassay variations were 3.2% and 10.3%, respectively. The serum concentration of FGF-21 was measured with the mouse/rat FGF-21 immunoassay (BioVendor). The assay sensitivity was 18.4 pg/mL, the intraassay variation was 8.4%, and the interassay variation was 8.7%. The serum concentration of osteocalcin was measured with the mouse osteocalcin immunoassay (Biomedical Technologies). The assay sensitivity was 1 ng/mL, the intraassay variation was 6%, and the interassay variation was 8%. Undercarboxylated osteocalcin (Glu13 OCn) was measured as described previously (20). All measurements were performed in duplicate.
Indirect calorimetry
Indirect calorimetry measurements were performed using the Promethion Metabolic Cage System (Sable Systems) located in the Physiology Core Department of the Maine Medical Research Institute as described previously (21). Mice were subjected to a standard 14-hour light/10-hour dark cycle during the study, which consisted of a 12-hour acclimation period followed by a 72-hour sampling duration. Data shown are representative of the 24-hour averages of this period. Correlations between energy expenditure (EE) and lean, fat, and total body mass were analyzed to determine whether these variables could explain changes in EE (22, 23)
Insulin tolerance tests (ITTs)
B6 mice were tested for insulin tolerance at d7Lac, and results were compared with those of age-matched 12-week-old nonlactating controls. Mice were fed ad libitum and injected intraperitoneally with insulin at a dose of 1 U/kg. Glucose was measured at 0, 15, 30, 45, 60, and 120 minutes postinjection using a OneTouch Ultra Glucometer (LifeScan, Inc.) (24).
Statistical analysis
Data are expressed as means ± SEM. Results were analyzed for statistically significant differences using the Student t test or ANOVA followed by the Tukey multiple comparison test or Kruskal-Wallis test with the Dunn multiple comparison test where appropriate. Multiple regression analysis was used to adjust for group and lean mass for EE studies. All statistics, including regression analysis, were performed with Prism 6 statistical software (Graph Pad Software, Inc.). Statistical significance was set at a value of P < .05.
Results
aBMD was lost and then regained in lactating mice
For aBMD measurements by DXA, B6 mice (n = 9–11/group) were measured longitudinally at biweekly intervals during and after lactation. The controls were nonlactating B6 mice of the same age and sex measured longitudinally. Total aBMD was significantly reduced at d7Lac (P < .001) compared with that of nonlactating controls at 12 weeks of age and by d21Lac had returned to d7Lac levels (Table 1). At d21Lac, the difference in aBMD (femoral and total) compared with that of nonlactating controls at 15 weeks persisted (P < .001) (Table 1). During the weaning period at d21Post, total and femoral aBMD increased significantly compared with either d7Lac or d21Lac measurements, but femoral aBMD did not reach these levels in the 20-week-old nonlactating controls (Table 1).
Table 1.
Body Composition Measured by DXA During Lactation in B6 Mice
| d7Lac | d21Lac | d21Post | |
|---|---|---|---|
| Total aBMD, mg/cm2 | |||
| Control | 48.9 ± 0.3 | 51.3 ± 0.5 | 51.0 ± 0.4 |
| Lactating | 43.9 ± 0.6a | 45.0 ± 1.1a | 49.8 ± 0.06b,c |
| Femoral aBMD, mg/cm2 | |||
| Control | 59.7 ± 0.9 | 61.6 ± 0.8 | 63.9 ± 0.8 |
| Lactating | 55.8 ± 1.4 | 48.5 ± 1.4a,d | 57.3 ± 0.8a,c |
| Body weight, g | |||
| Control | 21.6 ± 0.3 | 22.6 ± 0.5 | 23.1 ± 0.7 |
| Lactating | 27.1 ± 0.4a | 27.9 ± 0.5a | 24.8 ± 0.4b,c |
| % Fat | |||
| Control | 14.8 ± 0.3 | 14.9 ± 0.8 | 18.3 ± 1.8 |
| Lactating | 11.9 ± 0.6 | 14.2 ± 1.7 | 12.8 ± 0.9a |
| Fat mass, g | |||
| Control | 3.15 ± 0.08 | 3.36 ± 0.23 | 4.21 ± 0.52 |
| Lactating | 3.14 ± 0.18 | 3.90 ± 0.43 | 3.08 ± 0.24 (aP = 0.06) |
| Lean mass, g | |||
| Control | 17.7 ± 0.20 | 19.0 ± 0.36 | 18.4 ± 0.35 |
| Lactating | 23.2 ± 0.47a | 23.8 ± 0.83a | 20.9 ± 0.41a,b,c |
Values are means ± SEM (n = 9–11/group).
Statistical analyses were performed using a two-way ANOVA, P < .05:
lactating vs age-matched nonlactating controls (12 weeks vs d7Lac, 15 weeks vs d21Lac, 20 weeks vs d21Post);
d7Lac vs d21Post;
d21Lac vs d21Post;
d7Lac vs d21Lac.
Lactation alters microarchitecture through trabecular and cortical bone loss
B6 mice were killed at specific time intervals during and after lactation, identical to the longitudinal studies by DXA. Hence, the μCT and histomorphometry studies were cross-sectional studies of cohorts at distinct ages. Femoral BV/TV was lower in the lactating mice vs controls at all time points (P < .05) (Table 2 and Figure 1A). Consistent with the changes in the trabecular bone volume fraction, lactating mice had lower connectivity density and lower trabecular number at d7Lac than controls (P < .05) (Table 2). At d7Lac, mice also displayed a nonsignificant trend for higher trabecular spacing and thinner trabeculae than controls (Table 2). Trabecular BV/TV and trabecular number continued to decrease, and trabecular spacing continued to increase at both d21Lac and d21Post (compared with d7Lac and age-matched controls). In the femoral midshaft, lactating mice had a nonsignificant increase in total cross-sectional area (Table 2) but reduced cortical thickness and cortical area fraction at d7Lac (Table 2). At d21Lac, cortical thickness was reduced further (P < .005 compared with d7Lac) and remained significantly lower than the control value. However, at d21Post, cortical thickness was significantly improved compared with that at d21Lac (Table 2). Cortical porosity was significantly higher in lactating animals than in controls; however, by d21Post porosity was reduced compared with that at d21Lac (Table 2). At d21Post, trabecular bone mass and microarchitecture did not fully recover and remained lower than those of age-matched nonlactating controls, unlike aBMD, which was restored but remained slightly but not significantly lower than that of age-matched controls (Tables 1 and 2).
Table 2.
Femoral μCT Phenotypes for Lactating B6 mothers at d7Lac, d21Lac, and d21Post Compared With Those of Age-Matched Nonlactating Controls (12 15, and 20 Weeks)
| 12 Weeks (n = 5) | d7Lac (n = 10) | 15 Weeks (n = 5) | d21Lac (n = 10) | 20 Weeks (n = 5) | d21Post (n = 58) | |
|---|---|---|---|---|---|---|
| Distal femur | ||||||
| BV/TV, % | 6.3 ± 0.43 | 4.4 ± 0.42a | 5.8 ± 0.32 | 3.3 ± 0.32a | 6.0 ± 0.38 | 2.7 ± 0.35a,b |
| Tb.Th, μm | 40.3 ± 1.3 | 35.8 ± 1.0 | 38.9 ± 1.4 | 36.7 ± 1.3 | 41.9 ± 0.87 | 36.9 ± 1.5 |
| Tb.N, 1/mm | 3.7 ± 0.05 | 3.3 ± 0.12a | 3.5 ± 0.05 | 2.9 ± 0.09a | 3.3 ± 0.10 | 2.6 ± 0.10a,b,c |
| Tb.Sp, μm | 264.9 ± 3.5 | 308.6 ± 11.5 | 275.3 ± 3.7 | 336.4 ± 10.1a | 302.2 ± 9.9 | 393 ± 17.4a,b,c |
| SMI | 2.1 ± 0.08 | 3.3 ± 0.09a | 2.1 ± 0.10 | 3.6 ± 0.08a | 2.1 ± 0.05 | 3.5 ± 0.07a |
| Conn.D | 62.1 ± 5.9 | 33.4 ± 6.8a | 65.6 ± 3.6 | 20.6 ± 5.5a | 60.7 ± 5.8 | 16.8 ± 3.1a |
| Femur midshaft | ||||||
| Ct.Th, μm | 216.6 ± 2.2 | 197.8 ± 2.2a | 218.6 ± 1.6 | 188.4 ± 3.1a,d | 227.8 ± 3.0 | 212.1 ± 4.0b,c |
| Ct.Ar/Tt.Ar, % | 49.5 ± 0.42 | 45.1 ± 0.62a | 49.8 ± 0.35 | 42.6 ± 1.0a | 51.6 ± 0.58 | 47.4 ± 1.0a,c |
| Tt.Ar, mm2 | 1.73 ± 0.01 | 1.85 ± 0.03 | 1.75 ± 0.02 | 1.81 ± 0.03 | 1.72 ± 0.01 | 1.83 ± 0.04 |
| Ct.Ar, mm2 | 0.86 ± 0.01 | 0.83 ± 0.01 | 0.87 ± 0.01 | 0.77 ± 0.01a,d | 0.89 ± 0.01 | 0.86 ± 0.01c |
| Ma.Ar, mm2 | 0.87 ± 0.01 | 1.02 ± 0.02a | 0.88 ± 0.01 | 1.04 ± 0.03a | 0.83 ± 0.01 | 0.96 ± 0.04 |
| Ct.Po, % | 7.9 ± 0.13 | 9.0 ± 0.06a | 7.9 ± 0.05 | 9.2 ± 0.16a | 7.9 ± 0.19 | 8.6 ± 0.18c |
Abbreviations: Conn.D, connectivity density; Ct.Ar, cortical area; Ct.Po, cortical porosity; Ct.Th, cortical thickness; Ma.Ar, marrow area; SMI, structural model index; T.Ar, total area; Tb.N, trabecular number; Tb.Sp, trabecular separation; Tb.Th, trabecular thickness. Values are means ± SEM.
Statistical analyses were performed using two-way ANOVA, P < .05:
lactating vs age-matched nonlactating control (12 weeks vs d7Lac, 15 weeks vs d21Lac, 20 weeks vs d21Post);
d7Lac vs d21Post;
d21Lac vs d21Post;
d7Lac vs d21Lac.
Figure 1.

Bone turnover during lactation in controls and dams. Serum and bones harvested from lactating B6 females (n = 5–10) at d7Lac, d21Lac, and d21Post (■) were compared with those from 12-week-old nonlactating controls (Ctrl; □). A, Representative μCT images of the distal femur microarchitecture in lactating dams compared with that in age-matched nonlactating controls. Scale bars correspond to 100 μm. B, Erosion surface/bone surface (ES/BS) histomorphometry in femur. C, Bone formation rate/bone surface (BFR/BS) histomorphometry in femur. D, RatLaps (CTX). E, Total osteocalcin. F, P1NP. G, Sclerostin. H, Relative mRNA expression of Rankl and Opg in tibia. I, Relative mRNA expression of Osterix, Runx2, and Atf4 in tibia. Bars represent means ± SEM. Statistical analyses were performed with the Student t test for B and C and H and I and ANOVA for D to G, P < .05: *, compared with controls (vs d7Lac for ES/BS and BFR/BS); a, d7Lac vs d21Lac; b, d7Lac vs d21Post; c, d21Lac vs d21Post.
Lactation is associated with uncoupled bone remodeling
Histomorphometry of the proximal tibia was done at d7Lac, d21Lac, and d21Post using calcein and demeclocycline labeling for trabecular bone surface. The bone formation rate was increased by 33% between d7Lac and d21Post (P < .05), whereas eroded surfaces/bone surfaces dropped dramatically from 2% at d7Lac to 0.37% at d21Post (P < .05) consistent with trends toward reduced osteoclast number per bone perimeter (2.27–0.47; P = .069) and reduced percent osteoclast surface (5.85–1.36; P = .09) (Figure 1, B and C, and Supplemental Table 2).
Bone turnover markers generally confirmed the changes seen by histomorphometry. Notably, serum CTX (RatLaps) showed a marked increase at d7Lac (peak resorption) vs 12-week-old nonlactating controls (P < .001) (Figure 1D) and then returned to prelactation levels at d21Lac and d21Post. On the other hand, RANKL concentrations were unchanged between baseline and d7Lac of lactation (data not shown). Total serum osteocalcin showed a marked increase at d7Lac and d21Lac compared with that of 12-week-old nonlactating controls (P < .001) (Figure 1E). For P1NP, another marker of bone formation, there was a statistically significant doubling at d7Lac (P < .001) compared with that of age-matched nonlactating controls, similar to the increase in CTX at d7Lac (Figure 1F). Serotonin, a hormone that regulates PTHrP in mammary tissue (9, 10), increased at d7Lac compared with that of age-matched controls (P < .001) (Table 3). Serum sclerostin at d21Lac was 50% lower in the lactating animals than in the controls (P < .001) (Figure 1G).
Table 3.
Metabolic Markers Measured in Lactating B6 Mothers at d7Lac, d21Lac, and d21Post Compared With Those of Nonlactating Controls (12 Weeks)
| 12 Weeks | d7Lac | d21Lac | d21Post | |
|---|---|---|---|---|
| Leptin, pg/mL | 1023.3 ± 202.6 | 989.7 ± 74.9 | 1310.9 ± 176.4 | 1147.7 ± 150.2 |
| Adiponectin, μg/mL | 38.1 ± 1.4 | 22.5 ± 1.2a | 32.6 ± 2.0b | 25.9 ± 1.3a,c |
| Serotonin, ng/mL | 2223.0 ± 67.6 | 3165.3 ± 185.9a | 3197.7 ± 281.7a | 3936.9 ± 356.6a |
| Insulin, ng/mL | 0.445 ± 0.06 | 0.563 ± 0.09 | 0.729 ± 0.11a | 0.445 ± 0.06 |
| IGF-I, ng/mL | 411.3 ± 25.9 | 360.9 ± 41.9 | 445.9 ± 46.2 | 646.2 ± 39.6a,c,d |
| FGF-21, pg/mL | 224.2 ± 8.17 | 551.0 ± 65.9a | 447.6 ± 66.3a | 505.4 ± 70.3a |
Values are means ± SEM (n = 5–11).
Statistical analyses were performed using one-way ANOVA, P < .05:
vs 12 weeks control;
d7Lac vs d21Lac;
d21Lac vs d21Post;
d7Lac vs d21Post.
Gene expression was determined by whole-bone plus marrow analysis using quantitative real-time PCR at d7Lac and d21Lac as well as d21Post compared to 12-week-old nonlactating controls. Osterix and Atf4, markers of osteoblast differentiation, were markedly suppressed at d7Lac compared to baseline (P < .008 and P < .04) (Figure 1I). The osteoclastogenesis inhibitory factor Opg was also down-regulated by 45% at d7Lac vs baseline (P < .002 (Figure 1H). Osterix and Atf4 expression levels returned to normal by d21Lac (Supplemental Table 3). The expression of osteoclast recruitment factor Rankl was unchanged for all time points (Supplemental Table 3). In respect to markers of fat metabolism in the bone marrow, Pparα, a mediator of fatty acid oxidation and a regulator of FGF-21, and PDK4, a marker of fatty acid metabolism, were both slightly but not significantly increased at d7Lac (Supplemental Table 3). Despite the marked decrement in trabecular bone volume fraction, the absolute volume of marrow adipose tissue using osmium staining with μCT of the tibia at 4 distinct sites demonstrated a significant reduction at d21Lac vs age-matched controls (15 weeks old) for 3 sites (VOI and adipocyte volume/total volume): VOI1, 0.0047 ± 0.0007 vs 0.001 ± 0.0002; VOI2, 0.4874 ± 0.05 vs 0.0489 ± 0.02; and VOI4, 0.0012 ± 0.0001 vs 0.0002 ± 0.0001 (P < .05) (Figure 2).
Figure 2.
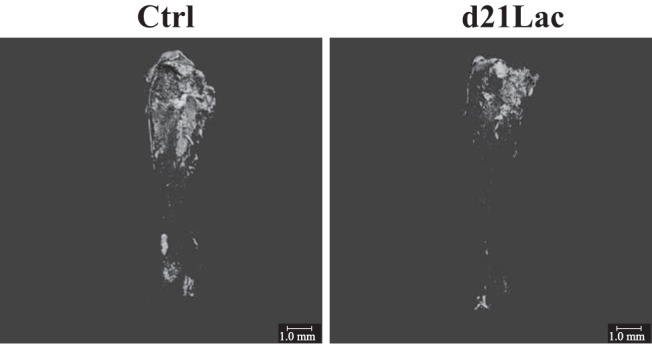
Lactation induces decline in marrow adiposity. Representative images of osmium staining for marrow adiposity. B6 females at d21Lac were compared with 15-week-old nonlactating age-matched controls (Ctrl). Tibias were stained for marrow fat using OsO4 and then imaged using μCT with a voxel size of 10 μm. Scale bars correspond to 1.0 mm.
Body composition and metabolic changes were present during and after lactation
Total body weight in grams was higher in the lactating dams vs age-matched controls at d7Lac and d21Lac (Table 1). There was a 21% reduction in percent body fat at d7Lac in lactating mice vs 12-week-old nonlactating controls; however, percent body fat was not different at d21Lac. By d21Post, percent body fat was 30% lower in the dams that had lactated vs controls (P < .05) (Table 1). Changes in percent fat were not due to changes in absolute fat mass, which was not different at d7Lac and d21Lac (Table 1). Lean mass was similar from d7Lac to d21Lac but higher than that of controls at all time points, and this was associated with a marked increase in EE (P < .005) in the lactating mice vs controls (Supplemental Figure 1A). At d21Post, lean mass decreased significantly compared with that in d7Lac and d21Lac mice, yet was still higher than that of age-matched nonlactating controls. Adjustment of EE for group and lean mass revealed no difference between lactating and control mice when a multiple regression model was used (r2 for lean = 0.65; P = .03; f value of model = 0.0018) (Supplemental Figure 1B). However, food consumption of the lactating mice was markedly increased, and total activity was slightly reduced without a longitudinal change in total body weight, consistent with a shunting of nutrients toward mammary tissue (Supplemental Figure 1, C and D).
To determine the mechanism for lactation-induced changes in body composition, we next investigated the effects of lactation on gene expression in inguinal white adipose tissue, interscapular brown adipose tissue, and the mammary gland. In inguinal fat, there was global suppression of Pgc1α and Ucp1, markers of brown-like adipogenesis at d7Lac vs 12-week-old nonlactating control mice (P < .002) (Figure 3, A and B). This reduction persisted for Pgc1α at d21Lac but returned to comparable expression levels relative to those for the controls by d21Post. Ucp1 mRNA expression levels increased 2-fold by d21Post (Figure 3B). Pdk4, an enzyme that can promote fatty acid generation, was >2-fold increased in inguinal fat relative to that in controls at d7Lac (P < .0001). In brown adipose tissue, a similar pattern was noted; there was global suppression of Ucp1 mRNA (85% reduction, P < .0001), and Pgc1β, a transcriptional coactivator that modulates mitochondrial biogenesis and energy homeostasis, was suppressed by 40% (P < .0002) at d7Lac vs 12-week-old nonlactating control mice (Figure 3, D and E). In mammary tissue, Ucp1 and Pgc1β mRNA were up-regulated significantly (P < .0001) at d7Lac, whereas Pgc1α transcripts were suppressed (P < .002) (Figure 3, F–I).
Figure 3.

Lactation induces alterations in gene expression of metabolic markers in fat depots. Adipose tissues harvested from lactating B6 females (n = 8–10) at d7Lac, d21Lac, and d21Post lactation (■) were compared with those from 12-week-old nonlactating controls (Ctrl; □). A–C, Inguinal white adipose tissue (WAT) mRNA expression of Pgc1α, Ucp1, and Pdk4. D and E, Interscapular brown adipose tissue (BAT) mRNA expression of Ucp1 and Pgc1β. F–I, Mammary tissue (MAM) mRNA expression of Ucp1, Pgc1β, Pdk4, and Pgc1α. Bars represent means ± SEM. Statistical analyses were performed with ANOVA, P < .05: *, compared with controls; a, d7Lac vs d21Lac, b, d7Lac vs d21Post, c, d21Lac vs d21Post.
Because of the magnitude and acceleration of changes in body composition associated with the high rates of bone resorption during lactation, we next investigated factors that might contribute to those effects. Glu13 OCn, a peptide fragment that enhances insulin sensitivity and secretion, was 25.1 ± 1.2 ng/mL at d7Lac, the peak of bone resorption. However, at d21Lac and then at d21Post, Glu13 OCn levels declined to 12.1 ± 3.3 ng/mL (P < .01, d21Lac vs d7Lac) and 12.0 ± 2.5 ng/mL respectively (P < .01, d21Post vs d7Lac). Serum leptin was not different at d7Lac, a time when fat mass was lost (Table 3). Adiponectin levels at d7Lac were nearly 50% lower than baseline levels (P < .001), reflecting the acute changes in adipose tissue; in contrast, serotonin concentrations increased significantly at d7Lac vs controls (P < .001) (Table 3).
Insulin concentrations were lowest at baseline and d7Lac but by d21Lac were increased significantly from baseline: 0.445 ± 0.066 vs 0.729 ± 0.119 (P < .05) (Table 3). In the postlactation phase, serum insulin levels returned to baseline values. IGF-I serum levels increased nearly 50% from d7Lac to d21Post (P < .0002) and were greater than those of the controls at d21Post (P = .01) (Table 3). FGF-21, a counter-regulatory factor secreted by the liver during states of substrate insufficiency, revealed a different pattern: serum levels of FGF-21 rose more than 2.4-fold from baseline to d7Lac (P < .0001) and then remained elevated at d21Lac (P = .005) and d21Post (P = .0001), although less than at d7Lac (Table 3). Consistent with circulating changes, hepatic Fgf21 mRNA was increased 8-fold in the liver at d7Lac over baseline (P < .03, data not shown).
Because of changes in serum insulin during lactation and the rise in endogenous insulin-sensitizing peptides such as Glu3 OCn and FGF-21, we performed an ITT at d7Lac in nonlactating age-matched B6 controls (n = 8) and lactating B6 mice (n = 6). Random-fed glucose at d7Lac was significantly lower than glucose in control serum from age-matched mice (P < .05) (Figure 4A). During ITTs, the blood glucose levels of lactating mice reached the nadir sooner, and the nadir was lower than that of nonlactating B6 mice (P < .001) (Figure 4B). After d14Lac, the increase in insulin sensitivity was no longer present, with a glucose pattern nearly identical to that of age-matched controls (data not shown).
Figure 4.
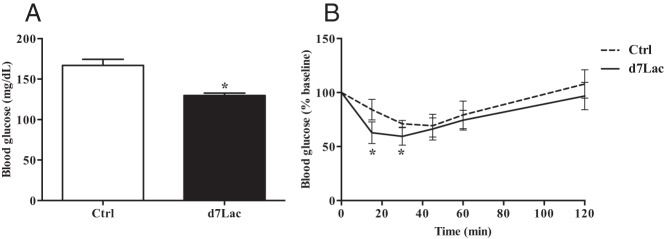
Lactation induces increases in insulin sensitivity. Serum from lactating B6 females (n = 5–10) at d7Lac (■) was compared with that from 12-week-old nonlactating controls (Ctrl.; □) for random-fed glucose (A) and ITTs (B), in which blood glucose was monitored for 120 minutes in random-fed control (– – –) and d7Lac (——) mice that were injected intraperitoneally with 1 U/kg insulin at time 0. Blood glucose values are expressed as a percentage of baseline. All data points represent means ± SEM. Statistical analyses were performed with the Student t test, P < .05: *, compared with controls.
FGF-21-null mice (F21-KO) do not lose bone with lactation
To determine whether FGF-21 was a major mediator of lactation-induced changes in bone remodeling and energy metabolism, we next compared F21-KO lactating dams at day 14 (d14Lac) with age-matched nonlactating virgin controls (Ctrl, 16 weeks old). d14Lac was chosen as a time point because a priori we expected to see peak lactation-induced bone loss. Pup size and growth were similar between the 2 genotypes across lactation and postweaning. μCT analyses revealed that significant lactation-induced trabecular and cortical bone loss occurred in WT mice but was not present in F21-KO mice (Figure 5, A–D). Histomorphometry showed that osteoclast number and surface were significantly increased in d14Lac WT mice compared with those in age-matched controls, but not in F21-KO mice (P < .005) (Figure 5E); similarly, osteoblast number and surface were decreased on d14Lac compared with those for age-matched controls in WT mice but not in F21-KO mice (P < .001) (Figure 5F). Serum CTX-1 (RatLaps) was increased on d14Lac in WT mice compared with that in age-matched controls (P < .05), but this response was largely absent in F21-KO mice (Figure 5G). Serum P1NP on d14Lac was comparable to that for age-matched controls in WT mice despite the increased bone resorption; in contrast, P1NP was increased on d14Lac compared with that for age-matched controls in F21-KO mice (P < .001) (Figure 5H).
Figure 5.

FGF-21 is essential for lactation-induced skeletal and metabolic changes. FGF21-KO (F21-KO) mice and WT controls (16-week-old females, n = 5) were dissected on d14Lac. Bone and metabolic parameters on d14Lac (■) were compared with age-matched nonlactating virgin controls (Ctrl; □). A–D, μCT analyses of proximal tibiae, scale bars correspond to 1.0 mm. Tb.N, trabecular number. E and F, Histomorphometry analyses of distal femurs. Oc.S/BS, osteoclast surface/bone surface; N.Oc./B.Ar, osteoclast number/bone area; Ob.S/BS, osteoblast surface/bone surface; N.Ob/B.Ar, osteoclast number/bone area. G, Serum CTX-1. H, Serum P1NP. Bars represent means ± SEM. Statistical analyses were performed with the Student t test, P < .05 (B–H): *, d14Lac compared with virgin controls in the same genotype; +, F21-KO compared with WT controls under the same physiological conditions.
Discussion
In the current study, we demonstrated that lactation affects not only skeletal remodeling but also whole-body metabolism in mice. In addition, we noted several features of lactation in B6 mice that are potentially relevant and translatable. First, bone loss in lactating mice is significant and involves both cortical and trabecular elements, although each compartment responds distinctly. Remarkably, the global loss of bone mass is associated with a compensatory increase in femoral cross-sectional area, a mechanism that probably maintains bone strength during lactation and recovery (11–12, 25–27). A recent longitudinal study in humans confirmed that repetitive and prolonged lactation protects against hip fractures late in life, possibly due to this compensation in the cortical compartment (28). In contrast to the cortex where bone mass recovered completely, trabecular bone was lost and was never fully restored in the B6 mice, possibly because there is normally some concomitant age-related bone loss in B6 females during the observation period (29). It would be important to know, through the use of high-resolution μCT imaging whether lactating mothers have full trabecular bone recovery after lactation and whether the compensatory increase in femoral cross-sectional area is responsible for the reduction in hip fractures late in life among women with repeated and prolonged lactation periods.
The bone loss of lactation is due to both accelerated bone resorption and suppressed bone formation. The mechanisms that lead to a reduction in bone formation during the early phases of lactation are multifactorial. However, high levels of FGF-21, suppressed IGF-I, increased circulating serotonin, or changes in local or circulating sclerostin might all contribute to a down-regulation in bone formation. For example, serotonin regulates local PTHrP production in mammary tissue in response to elevated prolactin levels (9, 10). Increased circulating serotonin from mammary tissue rather than from the gut could lead to lower bone formation via inhibition of the Wnt signaling pathway. Sclerostin is released from osteocytes within the remodeling unit and could suppress bone formation at a time when calcium requirements in other tissues are very high (30). Increased circulating FGF-21 is another possible cause of reduced bone formation because transgenic FGF-21 mice have markedly suppressed rates of bone formation primarily due to the increased activity of peroxisome proliferator–activated receptor γ as well as suppression of Wnt signaling (31).
A second notable finding in our study was the skeletal recovery of B6 mice postweaning and the relationship to changes in metabolic factors. Interestingly, the restoration of bone mass is time and site specific such that total aBMD is recovered more rapidly than femoral aBMD, which may be due to the contribution from trabecular elements in the proximal and distal femur to femoral aBMD measurements. Although skeletal recovery has been reported previously after lactation, the association with systemic and local metabolic factors has not been described (32, 33). There were only modest changes in gene expression within the bone marrow for genes related to adiposity, but these were consistent with the decline in bone marrow adiposity quantitated by osmium μCT in the lactating dams. Importantly, serum sclerostin levels declined at d21Lac, and these changes were reflected in the histomorphometry at d21Lac and changes in biochemical markers of bone turnover. In contrast to these data, another recent examination of lactation found that sclerostin gene expression was reduced somewhat later in the process of lactation, at day 7 postweaning (27).
Third, in this study we found that high levels of FGF-21 are related to changes in body composition and skeletal remodeling. The high metabolic demand during lactation is also reflected by the reduction in marrow adipose tissue at d21Lac. At the same time there was a marked increase in circulating FGF-21 and an increase in insulin sensitivity at d7Lac. The timing of this sensitivity is remarkable in that it also coincided with the greatest bone resorption (ie, d7Lac) during lactation. Both the Karsenty and Clemens groups have shown that insulin secretion and sensitivity are increased during states of accelerated bone turnover in mice through release of Glu13 OCn from the bone matrix (34–37). Glu13 OCn peaked at d7Lac vs baseline and returned to control values at d21Lac and d21Post. Thus, insulin sensitivity during lactation could be related to high concentrations of circulating FGF-21 and the release of matrix peptides such as Glu13 OCn as well as other hormonal factors.
In the FGF-21–null mice, the cellular mechanism for skeletal resistance during the high calcium demand of lactation is probably related to a relative reduction in bone resorption compared with that in WT lactating mice. This finding was confirmed by the near absence of change in CTX levels during lactation in the FGF-21–null mice. Similarly, it was reported that in both male and female FGF-21–null mice, bone resorption was consistently reduced, and the RANKL/osteoprotegerin ratio was low, although the mechanism for these changes was not well delineated (31). Moreover, it is uncertain why FGF-21–null osteoclasts do not respond to changes in calciotropic hormones and the absence of estrogen during the high calcium demands of lactation. Interestingly, despite the absence of significant bone resorption in the FGF-21–null mice, bone formation was not suppressed (Figure 5F) suggesting an uncoupling in the remodeling unit favoring skeletal protection rather than loss. It is conceivable that the FGF-21–null mice have a pattern of sclerostin expression different from that of lactating B6 mice, which have high levels during early lactation but which decrease by d21Lac. Alternatively, the osteoclast number is not altered in FGF-21–null mice. Hence, these cells may continue to release coupling factors that enhance bone formation even though the osteoclasts are not actively resorbing bone. Furthermore, we could not determine from our studies whether osteocytic osteolysis during lactation was the chief mechanism for calcium release from the skeleton in these mice, although this is a strong possibility (26). Finally, changes in FGF-21 could also be important in the recovery phase postlactation. It is conceivable that a drop in FGF-21 could lead to a rebound enhancement in bone formation and subsequent decline in bone resorption, although several factors are probably involved. For example, circulating IGF-I was increased postlactation in B6 mice (33). Because FGF-21 can regulate hepatic IGF-I through suppression of GH-mediated signal transducer and activator of transcription 5 signaling, a decline in FGF-21 and an increase in IGF-I may combine to allow recovery of BMD postlactation.
In conclusion, we established that whole-body metabolic changes accompany uncoupling in bone remodeling during lactation. Increased circulating FGF-21 affects whole-body metabolism, insulin sensitivity, and skeletal remodeling during this period. Further studies are needed to define the mechanisms implicit in the FGF-21 skeletal response and to determine other skeletal factors that may regulate whole-body metabolism.
Acknowledgments
We thank Terry Henderson, Ellen McMonagle, Elizabeth McMenamin, and Kathleen Bishop for technical assistance and Katherine Motyl for critical reading of the article.
This work was supported by the National Institute of Diabetes and Digestive and Kidney Diseases (Grant R24 092759 to C.J.R.), National Institutes of Health (Grant K23 AR051483-06 to S.A.B.), Canadian Institutes of Health Research (Grant 84253 to C.K.), National Institute of Arthritis & Musculoskeletal & Skin Diseases (Grant 5R01AR45548 to G.K.), and National Institute of Diabetes and Digestive and Kidney Diseases (Grant R01DK089113), March of Dimes (6-FY13-137), and Welch Foundation (Grant I-1751 to Y.W.). Additional support was provided by the Maine Medical Center Research Institute Bioinformatics Core Facility as supported by the National Institutes of Health (Grant P20 GM103465) to Don M. Wojchowski and the Small Animal Imaging Core Facility as supported by National Institutes of Health (P30 GM103392) to Robert Friesel.
Current address for M.F.: Département de Médecine, Université de Montréal, QC, Canada, H3C 3J7.
Disclosure Summary: The authors have nothing to disclose.
Footnotes
- aBMD
- areal bone mineral density
- B6
- C57BL/6J
- BV/TV
- bone volume/total volume
- CTX
- C-telopeptide
- d7Lac
- day 7 of lactation
- d14Lac
- day 14 of lactation
- d21Lac
- day 21 of lactation
- d21Post
- day 21 postlactation
- DXA
- dual-energy X-ray absorptiometry
- EE
- energy expenditure
- FGF
- fibroblast growth factor
- Glu13 OCn
- undercarboxylated osteocalcin
- ITT
- insulin tolerance test
- KO
- knockout
- μCT
- microcomputed tomography
- P1NP
- propeptide of type 1 procollagen
- RANKL
- receptor activator of nuclear factor κ-B ligand
- VOI
- volume of interest
- WT
- wild-type.
References
- 1. Glasier A, McNally AS. Physiology of lactation. Bailliere's Clin Endocrinol Metab. 1990;4:379–395 [DOI] [PubMed] [Google Scholar]
- 2. Neville MC. The physiological basis of milk secretion. Ann NY Acad Sci. 1990;586:1–11 [DOI] [PubMed] [Google Scholar]
- 3. Thomas E, Lee-Pullen T, Rigby P, Hartmann P, Xu J, Zeps N. Receptor activator of NF-κB ligand promotes proliferation of a putative mammary stem cell unique to the lactating epithelium. Stem Cells. 2012;30:1255–1264 [DOI] [PubMed] [Google Scholar]
- 4. Kovacs CS, Kronenberg HM. Maternal-fetal calcium and bone metabolism during pregnancy, puerperium, and lactation. Endocr Rev. 1997;18:832–872 [DOI] [PubMed] [Google Scholar]
- 5. Sowers M, Corton G, Shapiro B, Jannausch ML, et al. Changes in bone density with lactation. JAMA. 1993;269:3130–3135 [PubMed] [Google Scholar]
- 6. Sowers M, Zhang D, Hollis BW, et al. Role of calciotrophic hormones in calcium mobilization of lactation. Am J Clin Nutr. 1998;67:284–291 [DOI] [PubMed] [Google Scholar]
- 7. Sowers M, Eyre D, Hollis BW, et al. Biochemical markers of bone turnover in lactating and nonlactating postpartum women. J Clin Endocrinol Metab. 1995;80:2210–2216 [DOI] [PubMed] [Google Scholar]
- 8. Ardeshirpour L, Brian S, Dann P, VanHouten J, Wysolmerski J. Increased PTHrP and decreased estrogens alter bone turnover but do not reproduce the full effects of lactation on the skeleton. Endocrinology. 2010;151:5591–5601 [DOI] [PMC free article] [PubMed] [Google Scholar]
- 9. Hernandez LL, Gregerson KA, Horseman ND. Mammary gland serotonin regulates parathyroid hormone-related protein and other bone-related signals. Am J Physiol Endocrinol Metab. 2012;302:E1009–E1515 [DOI] [PMC free article] [PubMed] [Google Scholar]
- 10. Collier RJ, Hernandez LL, Horseman ND. Serotonin as a homeostatic regulator of lactation. Domest Anim Endocrinol. 2012;43:161–170 [DOI] [PubMed] [Google Scholar]
- 11. Kirby BJ, Ma Y, Martin HM, et al. Upregulation of calcitriol during pregnancy and skeletal recovery after lactation do not require parathyroid hormone. J Bone Miner Res. 2013;28:1987–2000 [DOI] [PubMed] [Google Scholar]
- 12. Liu XS, Ardeshirpour L, VanHouten JN, Shane E, Wysolmerski JJ. Site-specific changes in bone microarchitecture, mineralization, and stiffness during lactation and after weaning in mice. J Bone Miner Res. 2012;27:865–875 [DOI] [PubMed] [Google Scholar]
- 13. Kirby BJ, Ardeshirpour L, Woodrow JP, et al. Skeletal recovery after weaning does not require PTHrP. J Bone Miner Res. 2011;26:1242–1251 [DOI] [PMC free article] [PubMed] [Google Scholar]
- 14. Carneiro RM, Prebehalla L, Tedesco MB, et al. Lactation and bone turnover: a conundrum of marked bone loss in the setting of coupled bone turnover. J Clin Endocrinol Metab. 2010;95:1767–1776 [DOI] [PMC free article] [PubMed] [Google Scholar]
- 15. VanHouten JN, Dann P, Stewart AF, et al. Mammary-specific deletion of parathyroid hormone-related protein preserves bone mass during lactation. J Clin Invest. 2003;112:1429–1436 [DOI] [PMC free article] [PubMed] [Google Scholar]
- 16. Potthoff MJ, Inagaki T, Satapati S, et al. FGF21 induces PGC-1α and regulates carbohydrate and fatty acid metabolism during the adaptive starvation response. Proc Natl Acad Sci USA. 2009;106:10853–10858 [DOI] [PMC free article] [PubMed] [Google Scholar]
- 17. DeMambro VE, Clemmons DR, Horton LG, et al. Gender-specific changes in bone turnover and skeletal architecture in Igfbp-2-null mice. Endocrinology. 2008;149:2051–2061 [DOI] [PMC free article] [PubMed] [Google Scholar]
- 18. Scheller EL, Troiano N, Vanhoutan JN, et al. Use of osmium tetroxide staining with microcomputerized tomography to visualize and quantify marrow adipocytes. Methods Enzymol. 2014;537:123–139 [DOI] [PMC free article] [PubMed] [Google Scholar]
- 19. Dempster DW, Compston JE, Drezner MK, et al. Standardized nomenclature, symbols, and units for bone histomorphometry: a 2012 update of the report of the ASBMR Histomorphometry Nomenclature Committee. J Bone Miner Res. 2013;28:2–17 [DOI] [PMC free article] [PubMed] [Google Scholar]
- 20. Ferron M, Wei J, Yoshizawa T, Ducy P, Karsenty G. An ELISA-based method to quantify osteocalcin carboxylation in mice. Biochem Biophys Res Commun. 2010;397:691–696 [DOI] [PMC free article] [PubMed] [Google Scholar]
- 21. Motyl KM, Bishop KA, DeMambro VE, et al. Altered thermogenesis and impaired bone remodeling in Misty mice. J Bone Miner Res. 2013;28:1885–1897 [DOI] [PMC free article] [PubMed] [Google Scholar]
- 22. Kaiyala KJ, Schwartz MW. Toward a more complete (and less controversial) understanding of energy expenditure and its role in obesity pathogenesis. Diabetes. 2011;60:17–23 [DOI] [PMC free article] [PubMed] [Google Scholar]
- 23. Kaiyala KJ, Morton GJ, Leroux BG, Ogimoto K, Wisse B, Schwartz MW. Identification of body fat mass as a major determinant of metabolic rate in mice. Diabetes. 2010;59:1657–1666 [DOI] [PMC free article] [PubMed] [Google Scholar]
- 24. Weitgasser R, Gappmayer B. Newer portable glucose meters—analytical improvement compared with previous generation devices. Clin Chem. 1999;45:1821–1825 [PubMed] [Google Scholar]
- 25. Colleran HL, Wideman L, Lovelady CA. Effects of energy restriction and exercise on bone mineral density during lactation. Med Sci Sports Exerc. 2012;44:1570–1579 [DOI] [PubMed] [Google Scholar]
- 26. Qing H, Ardeshirpour L, Pajevic PD, et al. Demonstration of osteocytic perilacunar/canalicular remodeling in mice during lactation. J Bone Miner Res. 2012;27:1018–1029 [DOI] [PMC free article] [PubMed] [Google Scholar]
- 27. Collins JN, Kirby BJ, Woodrow JP, et al. Lactating Ctcgrp nulls lose twice the normal bone mineral content due to fewer osteoblasts and more osteoclasts, whereas bone mass is fully restored after weaning in association with up-regulation of Wnt signaling and other novel genes. Endocrinology. 2013;154:1400–1413 [DOI] [PMC free article] [PubMed] [Google Scholar]
- 28. Bjørnerem A, Ahmed LA, Jørgensen L, Størmer J, Joakimsen RM. Breastfeeding protects against hip fracture in postmenopausal women: the Tromsø study. J Bone Miner Res. 2011;26:2843–2850 [DOI] [PubMed] [Google Scholar]
- 29. Turner CH, Hsieh YF, Müller R, et al. Genetic regulation of cortical and trabecular bone strength and microstructure in inbred strains of mice. J Bone Miner Res. 2000;15:1126–1131 [DOI] [PubMed] [Google Scholar]
- 30. Keller H, Kneissel M. SOST is a target gene for PTH in bone. Bone. 2005;37:148–158 [DOI] [PubMed] [Google Scholar]
- 31. Wei W, Dutchak PA, Wang X, et al. Fibroblast growth factor 21 promotes bone loss by potentiating the effects of peroxisome proliferator-activated receptor γ. Proc Natl Acad Sci USA. 2012;109:3143–3148 [DOI] [PMC free article] [PubMed] [Google Scholar]
- 32. Ardeshirpour L, Dann P, Adams DJ, et al. Weaning triggers a decrease in receptor activator of nuclear factor-κB ligand expression, widespread osteoclast apoptosis, and rapid recovery of bone mass after lactation in mice. Endocrinology. 2007;148:3875–3886 [DOI] [PubMed] [Google Scholar]
- 33. Bowman BM, Siska CC, Miller SC. Greatly increased cancellous bone formation with rapid improvements in bone structure in the rat maternal skeleton after lactation. J Bone Miner Res. 2002;17:1954–1960 [DOI] [PubMed] [Google Scholar]
- 34. Lundåsen T, Hunt MC, Nilsson LM, et al. PPARα is a key regulator of hepatic FGF21. Biochem Biophys Res Commun. 2007;360:437–440 [DOI] [PubMed] [Google Scholar]
- 35. Ferron M, Wei J, Yoshizawa T, et al. Insulin signaling in osteoblasts integrates bone remodeling and energy metabolism. Cell. 2010;142:296–308 [DOI] [PMC free article] [PubMed] [Google Scholar]
- 36. Fulzele K, Clemens TL. Novel functions for insulin in bone. Bone. 2012;50:452–456 [DOI] [PubMed] [Google Scholar]
- 37. Clemens TL, Karsenty G. The osteoblast: an insulin target cell controlling glucose homeostasis. J Bone Miner Res. 2011;26:677–680 [DOI] [PubMed] [Google Scholar]