

Abstract
Heparin is a naturally occurring polysaccharide known to interact with complement proteins and regulate multiple steps in the complement cascade. Quantitative information, in the form of affinity constants for heparin-complement interactions, is not generally available and there are no reports of a comprehensive analysis using the same interaction method. Such information should improve our understanding of how exogenously administered pharmaceutical heparin and the related endogenous polysaccharide, heparan sulfate, regulate complement activation. The current study provides the first comprehensively analysis of the binding of various complement proteins to heparin using surface plasmon resonance (SPR). Complement proteins C1, C2, C3, C4, C5, C6, C7, C8, C9, C1INH, factor I, factor H, factor B and factor P all bind heparin but exhibit different binding kinetics and dissociation constants (Kd) ranging from 2 to 320 nM. By taking into account these Kd values and the serum concentrations of these complement proteins, the percentage of each binding to exogenously administered heparin was calculated and found to range from 2% to 41%. This study provides essential information required for the rational design of new therapeutic agents capable of regulating the complement activation.
Keywords: Complement, Polysaccharide, Interaction, SPR, Heparin
1. Introduction
Complement plays an important role in host defense against infection and in the clearance of antigen–antibody complexes from the bloodstream. Complement consists of a system of approximately 35 different serum and cellular proteins, including positive and negative regulators that interact in a cascade fashion. Many of the early components are serine proteases that sequentially activate one another [1–3]. The complement system can be activated through the classical, alternative and mannose–lectin binding (MBL) pathways (Fig. 1). The most potent activation, associated with the classical pathway, occurs when a complex of cell surface antigen and IgG (or IgM) antibody binds to the first complement component C1. A second means of activation, associated with the alternative, or properdin pathway, is activated by direct contact with activated C3 that is deposited on a variety of surfaces including pathogens such as viruses and fungi, but also host cells in auto-immune disorders [2]. Complement activation can also be initiated via the MBL pathway after contact with mannose on the cell surface of pathogens such as bacteria [4]. Once activated, a cascade of events follows until all three pathways converge at C3, ultimately leading to the assembly of a multi-protein complex (C5b6789) on a cell membrane known as the membrane attack complex (MAC), resulting in cell lysis.
Fig. 1.

Current view of heparin effects on the classical and alternative pathways.
Deficiencies of almost all the components of the complement system have been found in humans, including Factor D, properdin, and complement regulatory proteins C1INH, Factor I, Factor H, DAF (decay accelerating factor for complement), and CD59. Complement deficiencies are linked to autoimmune disorders, immune complex disease, and increased risk of infections, especially by Pneumococcal and Neisseria species, due to reduced opsonization and phagocytosis [5–7]. Immune complex disease is caused by complement mediated inflammation in response to persisting antigen–antibody complexes in the circulation and the tissues. A series of inflammatory activities, including the induction of smooth muscle contraction, vasodilation, and increase in vascular permeability are mediated by C3a and C5a released by proteolysis of C3 and C5.
Complement activity is regulated by the serum levels of complement components, natural decay of the activated fragments, specific complement inhibitors, and by some polysaccharides including heparin and heparan sulfate. A report over 75 years ago by Ecker and Gross first suggested that heparin-like polyanions exhibit anti-complementary activity [8]. Rosenberg and coworkers [9] reported that heparin interacted with C1q. Kazatchkine and coworkers [10] demonstrated multiple sites in the classical and the alternative amplification pathways of complement at which heparin may act. Sahu and Pangburn [11] studied heparin binding of the complement proteins in serum using heparin-agarose affinity chromatography. In Sahu and Pangburn’s study [11], 13 complement proteins (C1q, C2, C4, C4bp, C1INH, B, D, H, P, C6, C8, C9, and vitronectin) were identified that bound heparin, and 9 complement proteins (C1r, C1s, C3, Factor I, C5, C7, C3b, Ba, and Bb) did not. Weiler and coworkers [12] showed heparin interacted with a much higher affinity to C1INH that did heparan sulfate Edens and coworkers [13] reviewed the multiple effects of heparin on the classical and alternative pathways (Fig. 1).
Heparin, a clinical anticoagulant, is a polydisperse (chains ranging in molecular weight from 5000 to 40,000), highly sulfated (average negative charge of 100/chain), linear polysaccharide (Fig. 2). Endogenous heparin is primarily an intracellular polysaccharide, localized in the granules of mast cells. Heparan sulfate, structurally related to heparin, is an extracellular poly-saccharide found both in the plasma and on the endothelium, and is probably responsible for most of the normal physiological activities also ascribed to heparin [14–17].
Fig. 2.
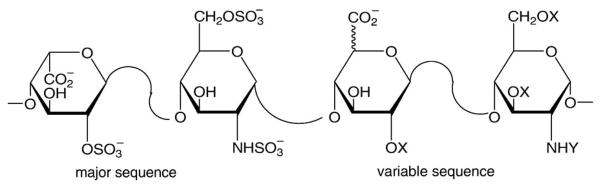
Structure of heparin showing the major and variable disaccharide sequences, where or H and , COCH3 or H.
Although structural and biochemical studies have provided some insight into the specificity and affinity of complement proteins for heparin [18], little is known about the binding affinities and kinetics that underlie their interactions. Heparin-complement protein complexes are dynamic, and kinetics of binding and release could influence many processes, such as the ability of complement proteins to compete for binding sites, their sequential assembly of MAC, and their clearance.
Surface plasmon resonance (SPR) instrumentation measures biomolecular interactions in real-time in a label-free environment, providing both equilibrium and kinetic information about complex formation. One of the interactants is immobilized to the sensor surface and the other, in solution, is passed over the surface by flow. The binding between an analyte in solution and its ligand immobilized on the gold surface of the sensor chip results in a change in the refractive index of light reflected on the gold chip surface. Association and dissociation is measured by detecting changes in the angle of incident light at which SPR occurs and is reported in resonance units (RUs) in a sensorgram [19–23]. SPR has been previously used to study the interactions between various complement proteins [24], but the use of SPR to examine complement protein interactions with sulfated polysaccharides is very limited [12,23,24]. In the current study, detailed measurements on the interaction between heparin and various complement proteins are reported and their importance in understanding the complement cascade is discussed.
2. Materials and methods
2.1. Materials
Streptavidin (SA) and gold (Au) sensor chips, 1-ethyl-3-(3-dimethylaminopropyl)-carbodiimide hydrochloride (EDC), N-hydroxysuccinimide (NHS), ethanolamine–HCl and HBS–EP buffer (0.01 M HEPES, pH= 7.4, 0.15 M NaCl, 3 mM EDTA, 0.005% surfactant P20) were from BIAcore (Biacore AB, Uppsala, Sweden). Phosphate buffered saline (PBS) was 50 mM in sodium phosphate solution, pH 7.2 containing 100 mM NaCl. Sulfo-N-hydroxysuccinimide-long chain-biotin (SNHS- LC-biotin) and neutravidin were from Pierce (Rockford, IL, USA). Porcine intestinal heparin (sodium salt) and 3, 3′-dithio-bis(propionic acid N-hydroxysuccinimide ester) (DTSP-NHS) were from Sigma (St. Louis, MO, USA). mPEG-SH and HCl·H2N-PEG-COOH were from Nektar (Huntsville, AL, USA). Purified human complement proteins: C1 (MW 774 KD), C2 (MW 93 KD) and C3 (MW 190 KD) were from Calbiochem (La Jolla, CA) and are functionally pure; C5 (MW 190 KD, 1 mg/ml in PBS), C6 (MW 128 KD, 1 mg/ml in PBS), C7 (MW 121 KD, 1 mg/ml in PBS), C8 (MW 163 KD, 1 mg/ml in PBS), C9 (MW 79 KD, 1 mg/ml in PBS), factor I (MW 88 KD, 1.8 mg/ml in PBS), factor P (MW 220 KD, 1.0 mg/ml in PBS), factor B (MW 85.5 KD, 1.09 mg/ml in PBS pH 7.2), factor H (MW 150 KD, 1.05 mg/ml in PBS), and factor D (24 KD, 0.1–0.12 mg/ml in PBS pH 7.2) were all purchased from QUIDEL Corp (San Diego, CA, USA). Factors P, B, H, D and I were ≥85% and the remaining complement proteins from QUIDEL were ≥95% pure by SDS-PAGE. Human complement protein C4 (MW 204 KD, 1.0 mg/ml in 25 mM sodium phosphate, 100 mM sodium chloride, pH 7.2 containing 0.02% (w/v) sodium azide), was from Sigma (St. Louis, MO, USA) and is functionally pure. C1 INH was purified from human plasma as previously described [25]. Double distilled water was used and all other reagents were analytical grade. SPR experiments were performed on a BIAcore 3000 instrument operated by BIAcore 3000 control software, version 4.0.1. All the buffers were filtered (0.22 μm) and degassed prior to using. The sensorgrams were analyzed using the BIAe-valuation software, version 4.0.1.
2.2. Methods
2.2.1. Biotinylation of heparin
The heparin–biotin conjugate was prepared by reaction of SNHS-LC-Biotin with the free amino groups of unsubstituted glucosamine residues normally present at low levels in pharmaceutical heparin [26,27]. Heparin (34 mg) was dissolved in 3.4 ml of 50 mM sodium bicarbonate at pH =8.3 and incubated at 4 °C for 2 h with SNHS-LC-Biotin (8.2 mg in 34 μl of dimethylformamide). The reaction mixture was dialyzed (3500 MWCO) to remove unreacted biotin and the biotinylated heparin was freeze-dried and stored at −20 °C. The 1H-NMR spectrum showed peaks characteristics of the incorporation of less than one biotin per heparin chain.
2.2.2. Immobilization of biotinylated heparin onto SA chip
A streptavidin sensor chip was pretreated with three injections, 5 μL each, of 50 mM NaOH in 1M NaCl, to remove any nonspecifically bound contaminants. A 5-μl injection of biotinylated heparin (100 μg/ml in HBS-EP running buffer, flow rate =5 μL/min) was made in flow cell 2, followed by a 10-μl injection of 2M NaCl. The other three flow cells of the sensor chip were similarly treated with buffer in the absence of biotinylated heparin (control). Approximately 320 RU of biotinylated heparin was immobilized in flow cell 2.
2.2.3. Synthesis of -(S-CH2-CH2-CONH-PEG-COOH)2
A solution of DTSP-NHS in CH2Cl2 (1.2 mg in 4 ml, 0.75 mM) was added to a solution of HCl·H2N-PEG-COOH in CH2Cl2 (15 mg in 1 ml, 3 mM). The mixture was incubated for 12 h at 4 °C. The solvent was evaporated and the residual solid was redissolved with a minimum amount of H2O, filtered (0.22 μm), dialyzed (3500 MWCO) and lyophilized. The lyophilized residue consisted of a mixture of -(S-CH2-CH2-CONH-PEG-COOH)2 and HCl·H2N-PEG-COOH (confirmed by NMR analysis).
2.2.4. Preparation of the neutravidin-PEG sensor chip
First, a chip with PEG-COOH matrix was prepared by incubating the gold sensor chip with a solution of -(S-CH2- CH2-CONH-PEG-COOH)2 (6 mg/ml in H2O) for 24 h at 4 °C. The chip was then exhaustively rinsed with H2O. The neutravidin was immobilized following general BIAcore procedure for amine coupling. Briefly, the surface immobilized with PEG-COOH was activated by incubating the PEG-COOH sensor chip for 30 min at 4 °C with an equimolar mixture of NHS/EDC (final concentration 50 μM, mixed immediately prior to using). The chip was rinsed with 50 mM sodium acetate buffer (pH 4) and then incubated for 24 h, at 4 °C in a solution of neutravidin (2 mg/ml in pH 4 sodium acetate buffer). The chip was exhaustively rinsed with water, and the surface was incubated with ethanolamine (1.0 M) for 2 h, to deactivate carboxyl groups that had not reacted with neutravidin.
2.2.5. Immobilization of heparin–biotin to the neutravidin–PEG sensor chip
A solution of heparin–biotin conjugate was passed over flow cell 2 of the neutravidin-PEG sensor chip (1 mg/ml in HBS-EP running buffer, flow rate =5 μl/min). The binding of the heparin–biotin to flow cell 2 of the sensor chip was confirmed by the observation of a 100 RU response in flow cell 2.
2.2.6. Kinetic measurement of complement protein–glycosaminoglycan interactions
The BIAcore instrument was programmed for iterative cycles in the kinetic experiments. Typically, 90 μl of complement protein or factor was injected into the BIAcore 3000 at a flow rate of 30 μl/min over a range of concentrations in either PBS buffer or sodium phosphate (pH 7.4) or HBS-EP buffer. At the end of the sample plug, the same running buffer was flowed over the sensor surface to allow dissociation. After a suitable dissociation phase, the sensor surface was regenerated for the next sample using a 5–30 μl of regeneration solutions having different washing strengths, including SDS (0.1%) (strongest), followed by 1 M NaCl in 50 mM NaOH (strong), 1 M NaCl in 50 mM sodium acetate (pH 4.5) (moderate), and 2 M NaCl (weak). The same solution was flowed past ligand cell and control cell in sequence and the response was monitored as a function of time (sensorgram) at room temperature 25 °C. Flow cell 1, where no ligand (heparin) was immobilized, was used as control. Each injection was repeated at least four times.
2.2.7. Data processing and analysis
All sensorgrams were processed using a double-referencing method. First, the responses from the control cell were subtracted from the binding responses collected over the reaction cells to correct for bulk refractive index changes. Second, the response from the blank injection was subtracted to remove response observed due to the change in running buffer and other system artifacts. Kinetic parameters were evaluated using BIA Evaluation software. The interaction between an analyte (A) and ligand (B) can be represented as Eq. (1)
| (1) |
The dissociation rate constant kd [s−1] was evaluated using equation dRU/dt =−kdRU, where RU represents the sensor response. The association rate constant is determined from the slope of a plot of the observed association rate constant kobs as a function of ligand concentration, according to kobs = kd + kaC, where ka [M−1 s−1] is a association rate constant and C represents the ligand concentration. The dissociation constant, Kd, was obtained from the ratio of kd/ka.
3. Results
3.1. Heparin surface attachment chemistry
The streptavidin–biotin linkage was selected to attach heparin to the chip surface since it had been previously shown to be an effective method for immobilizing heparin onto a dextran chip [27] Heparin was biotinylated through its unsubstituted amino groups. These occur at a frequency of ~1 unsubstituted amino group/3 heparin chains [28], and prevent double labeling affording a neoproteoglycan that resembles the proteoglycan forms of heparin and heparan sulfate. Interaction experiments on factor B and factor P using this sensor chip resulted in high, non-specific binding between the analyte and the sensor chip surface and a very low response of interest (the interaction of factor B or P with heparin) following subtraction of the control cell response.
These sensorgrams also appeared abnormally shaped and could not be fit into any standard stoichiometry models using BIAcore Evaluation software. The results suggested that the affinity of factor B and factor P [11] for heparin was comparable to or less than their affinity for the control cell of the standard streptavidin chip. Thus, a poly(ethylene glycol) (PEG)-based chip showing low non-specific protein interaction [29] was used to obtain interpretable, high quality SPR data for factor B and P.
3.2. Binding of heparin to complement proteins
Sensorgrams for the binding of heparin to the complement proteins are presented in Figs. 3–5. These sensorgrams were adjusted by subtracting the responses from the control cell of the same chip. The profiles of the SPR signal for each of the complement proteins were distinctive. Sensorgrams of C5, C7, C8, and factor I showed a rapid climb in SPR signal during the association phase corresponding to a fast on-rate (kon), and a gradual signal reduction during the dissociation phase corresponding to a slow off-rate (koff). A relatively slower kon was observed for C2, C3, C4, C6, C9, and C1INH, with faster koff observed in the sensorgrams of C4, C9, and C1INH and slower koff for C2, C3, C6. The atypical curves for C2–heparin interaction may result from their weak binding. The binding curves for C1 were similar in shape to those for factor H, both of which revealed a similarly fast association leading to an equilibrium, but faster dissociation kinetics for factor H than that for C1. Sensorgrams for factor B and factor P interactions with heparin are shown in Figs. 5C and D. These curves show flat association phases and very flat dissociation phases, indicating the slow rate of complex formation and a very slow breakdown of the heparin–factor B and heparin–factor P complexes. None of the experiments on any of the complement proteins reached surface saturation during the 180-s kinetic injection.
Fig. 3.

Sensorgrams showing the interaction of heparin with: C1 at 6.25, 12.5, 25, 50 and 100 nM; C2 at 75, 100, 150, 200 and 250 nM; C3 at 12.5, 25, 50, and 100 nM.
Fig. 5.

Sensorgrams showing the interaction of heparin with: C1INH at 100, 200, 400, 600, and 750 nM; factor I at 31.25, 62.5, 125, 250 and 500 nM; factor B at 12.5, 50, 75 and 100 nM); factor P at 20, 30, 40 and 50 nM; factor H at 75, 125, 250, 500 and 700 nM; C1INH and factor I were injected over an heparinized SA sensor chip. Factor B, factor H and factor P were injected over a heparinized PEG-neutravidin sensor chip.
The formation and breakdown of the heparin–complement protein complex are dictated by both on-rates (kon) and off-rates (koff). The apparent on and off rate constants for all complement proteins were determined by fitting into a 1:1 Langmuir binding model. Kinetic analysis of the interactions yielded kon, koff, and Kd values that are listed in Table 1. This study showed that each of these complement proteins gave kinetics that fit a 1:1 Langmuir binding model confirming a stoichiometry of 1:1.
Table 1.
Kinetic and affinity constants for heparin– complement proteins interaction
| Complement protein | kon (1/Ms) | koff (1/s) | Kd (nM) |
|---|---|---|---|
| C1 | 1.95×10⁵ | 5.39×10⁻³ | 27.6 |
| C2 | 4.13×10³ | 1.32×10⁻³ | 320 |
| C3 | 1.83×10⁴ | 5.73×10⁻⁴ | 31.2 |
| C4 | 9.64×10⁴ | 3.46×10⁻³ | 60.8 |
| C5 | 2.43×10⁵ | 1.35×10⁻³ | 21.9 |
| C6 | 1.72×10⁴ | 5.58×10⁻⁴ | 31.3 |
| C7 | 6.25×10⁴ | 9.60×10⁻⁴ | 12.8 |
| C8 | 4.17×10⁴ | 5.74×10⁻³ | 44.6 |
| C9 | 3.43×10⁴ | 4.51×10⁻³ | 131 |
| C1INH | 1.58×10⁴ | 4.64×10⁻⁴ | 29.4 |
| Factor I | 4.45×10⁴ | 1.03×10⁻³ | 36.2 |
| Factor H | 3.19×10⁴ | 3.23×10⁻² | 9.2 |
| Factor B | 2.58×10⁵ | 2.77×10⁻⁴ | 2.10 |
| Factor P | 3.84×10⁴ | 8.74×10⁻⁵ | 26.8 |
4. Discussion
Heparins are known to be highly variable with animal species and organs. The structural differences, such as the amounts of sulfo groups, greatly influence the ability of heparin to interact with proteins. The heparin used in this study is derived from porcine intestine, which is the major source of pharmaceutical heparin. Heparin interacts with the complement proteins C1, C2, C3, C4, C5, C6, C7, C8, C9, C1INH, factor I, factor H, factor B and factor P with nM affinity affording Kd values ranging from 10−7 to 10−9. Factor B showed a fast on-rate and a very slow off-rate giving the strongest heparin binding of all the proteins studied. In contrast, C2 gave the slowest on-rate with relatively slow off-rates giving the weakest binding to heparin compared to the other complement proteins. The remaining complement proteins C1, C3–C7, C1INH, factor I and factor P showed comparable binding kinetics and dissociation constants.
All the binding data of heparin with complement proteins are best analyzed in light of the relative concentrations that these proteins are found within the serum (Table 2). The dissociation constant Kd represents the ratio of free complement components in equilibrium with complement protein–heparin complex (a smaller Kd indicates high affinity). The ratio of Kd (nM)/serum concentration (nM) gives a dimensionless value (Table 2). For a given Kd, the higher the protein concentration is, the smaller percentage of serum complement protein is bound to heparin or heparan sulfate. For example, the Kd of heparin–C4 binding is 60.8 nM and the reported serum concentration is 2047 nM giving a ratio of 0.03. The ratio of Kd/serum concentration for the 14 complement proteins studied mostly ranged from 0.001 to 0.53 (Table 2). Thus, these data suggest as much as a 60-fold difference in the fraction of heparin bound complement proteins in the serum. Neither the soluble concentration of endogenous heparin (or heparan sulfate) in human blood, nor its concentration on the endothelium, is known. Thus, we decided to consider the effect, on complement, of exogenous heparin, administered at two standard therapeutic doses.
Table 2.
Serum concentrations of selected complement proteins and their relationship to Kd
| Complement protein | Conc. in serum (μg/ml) | nM | Kd (nM)/ Serum Conc. (nM) | [AB]/[A]+[AB] at 0.1 U/ml heparin | [AB]/[A]+[AB] at 1.0 U/ml heparin |
|---|---|---|---|---|---|
| C1 | <17 | <89 | >0.31 | 0.406– 1 | 0.944– 1 |
| C2 | 15–20 | 130–173 | 1.85–2.46 | 0.104– 0.11 | 0.58– 0.60 |
| C3 | 1500 | 8333 | 0.004 | 0.0066 | 0.066 |
| C4 | 430 | 2047 | 0.03 | 0.03 | 0.26 |
| C5 | 75 | 394 | 0.06 | 0.13 | 0.90 |
| C6 | 60 | 468 | 0.07 | 0.11 | 0.84 |
| C7 | 60 | 495 | 0.03 | 0.11 | 0.89 |
| C8 | 80 | 490 | 0.35 | 0.10 | 0.79 |
| C9 | 58 | 734 | 0.53 | 0.05 | 0.16 |
| C1INH | 262.5 | 2500 | 0.01 | 0.02 | 0.22 |
| B | 120–300 | 1290–3225 | 0.0006– 0.0016 | 0.02– 0.04 | 0.17– 0.43 |
| P | 20 | 90 | 0.30 | 0.41 | 0.95 |
| I | 34 | 386 | 0.09 | 0.13 | 0.86 |
| H | 470 | 3133 | 0.003 | 0.018 | 0.17 |
The concentration of complement protein bound to heparin [AB] is divided by the total (free and bound) concentration of complement protein ([A]+[AB]) at two concentrations 0.1 U/ml (55 nM) and 1.0 U/ml (550 nM).
Heparin is normally administered at doses designed to result in plasma concentrations ranging from 0.1 to 1.0 U/ml corresponding to 55 to 550 nM, based on a specific activity of 150 U/mg and an average molecular weight of 12,000 Da. It should be noted that heparin is a polydisperse mixture containing many chain sizes of molecular weights above and below the average value of 12,000 Da From these two concentrations and the Kd/ serum concentration value, the fraction of bound complement protein ([AB]/[A] +[AB]) was calculated and is presented in Table 2. Among all the complement proteins examined, factor P binds to heparin in the highest proportion, followed by C1. Low dose heparin results in 41% of the heparin bound to factor P and that value increases to 95% bound at a plasma heparin concentration of 1U/ml. In contrast, even at a 1 U/ml heparin concentration, we calculate ≤26% of C3, C4, C9, C1INH and factor H are bound to heparin, among which C3 binds to heparin with the smallest proportion. These values only represent estimated values as they do not take into account heparin’s polydispersity, the competition for heparin for binding to other complement proteins and non-complement heparin-binding proteins, such us antithrombin and heparin cofactor II, present in the circulation. Despite these complications, it is clear that some complement proteins are certainly present primarily in their bound state while others in their unbound state in heparinized patients.
The studies reported here are the first to use surface plasmon resonance (SPR) biosensors to provide quantitative data including affinity constants for the numerous interactions between complement proteins and sulfated polysaccharides. The major advantage of biosensors over conventional solid-phase assays is that in SPR, the formation and breakdown of complexes can be monitored in real time, which offers the possibility to determine the interaction mechanism and kinetic rate constants associated with a binding event. While all the complement proteins examined showed good fits to a 1:1 Langmuir binding model, more detailed studies relying on structurally defined oligosacchar-ides will be necessary to fully understand these interaction. The data presented in this report represent the essential first step for understanding how heparin regulates multiple steps in the complement system, including ones in all three pathways. Furthermore, these data provide insights at the molecular level required for the design of new therapeutic agents capable of regulating complement activation.
Fig. 4.

Sensorgrams showing the interaction of heparin with: C4 at 50, 100, 200, and 300 nM; C5 at 6.25, 12.5, 25, 50, and 75 nM; C6 at 31.25, 62.5, 125 and 250 nM; C7 at 25, 50, 100, 200 and 300 nM; C8 at 25, 50, 100, 200 and 300 nM; C9 at 50, 100, 200 and 300 nM.
Acknowledgments
These studies were supported by National Institutes of Health Grants HL52622 and GM38060.
References
- 1.Makrides S. Therapeutic inhibition of the complement system. Pharmacol Rev. 1998;50:59–88. [PubMed] [Google Scholar]
- 2.Muller-Eberhard H. Complement. Annu Rev Biochem. 1969;38:389– 414. doi: 10.1146/annurev.bi.38.070169.002133. [DOI] [PubMed] [Google Scholar]
- 3.Muller-Eberhard H. Molecular organization and function of the complement system. Annu Rev Biochem. 1988;57:321–347. doi: 10.1146/annurev.bi.57.070188.001541. [DOI] [PubMed] [Google Scholar]
- 4.Gadjeva M, Thiel S, Jensenius JC. The mannan-binding– lectin pathway of the innate immune response. Curr Opin Immunol. 2001;13:74– 78. doi: 10.1016/s0952-7915(00)00185-0. [DOI] [PubMed] [Google Scholar]
- 5.Colten H, Rosen FS. Complement deficiencies. Annu Rev Immunol. 1992;10:809– 834. doi: 10.1146/annurev.iy.10.040192.004113. [DOI] [PubMed] [Google Scholar]
- 6.Whaley K, Schwaeble W. Complement and complement deficiencies. Semin Liver Dis. 1997;17:297– 310. doi: 10.1055/s-2007-1007206. [DOI] [PubMed] [Google Scholar]
- 7.Frank M. Complement deficiencies. Pediatr Clin N Am. 2000;47:1339–1354. doi: 10.1016/s0031-3955(05)70274-1. [DOI] [PubMed] [Google Scholar]
- 8.Ecker E, Gross P. Anticomplementary power of heparin. J Infect Dis. 1929;44:250– 253. [Google Scholar]
- 9.Almeda S, Rosenberg RD, Bing DH. The binding properties of human complement component C1q interaction with mucopolysac-charides. J Biol Chem. 1983;258:785– 791. [PubMed] [Google Scholar]
- 10.Blondin C, Fischer E, Boisson-Vidal C, Kazatchkine MD, Jozefonvicz J. Inhibition of complement activation by natural sulfated polysaccharides (fucans) from brown seaweed. J Mol Immunol. 1994;31:247–253. doi: 10.1016/0161-5890(94)90121-x. [DOI] [PubMed] [Google Scholar]
- 11.Sahu A, Pangburn MK. Identification of multiple sites of interaction between heparin and the complement system. Mol Immunol. 1993;30:679– 684. doi: 10.1016/0161-5890(93)90079-q. [DOI] [PubMed] [Google Scholar]
- 12.Caldwell EE, Andreasen AM, Blietz MA, Serrahn JN, Vander Noot V, Park Y, Yu G, Linhardt RJ, Weiler JM. Heparin binding and augmentation of C1 inhibitor activity. Arch Biochem Biophys. 1999;361:215– 222. doi: 10.1006/abbi.1998.0996. [DOI] [PubMed] [Google Scholar]
- 13.Edens R, Linhardt RJ, Weiler JM. Heparin is not just an anticoagulant anymore: six and one-half decades of studies on the ability of heparin to regulate complement activity. Complement Profiles. 1993;1:96– 120. [Google Scholar]
- 14.Linhardt R, Claude S. Hudson award address in carbohydrate chemistry. Heparin: structure and activity. J Med Chem. 2003;46:2551– 2564. doi: 10.1021/jm030176m. [DOI] [PubMed] [Google Scholar]
- 15.Casu B, Lindahl U. Structure and biological interactions of heparin and heparan sulfate. Adv Carbohydr Chem Biochem. 2001;57:159–206. doi: 10.1016/s0065-2318(01)57017-1. [DOI] [PubMed] [Google Scholar]
- 16.Gunay NS, Linhardt RJ. Heparinoids: structure, biological activities and therapeutic applications. Planta Med. 1999;65:301– 306. doi: 10.1055/s-1999-13990. [DOI] [PubMed] [Google Scholar]
- 17.Rabenstein D. Heparin and heparan sulfate: structure and function. Nat Prod Rep. 2002;19:312– 331. doi: 10.1039/b100916h. [DOI] [PubMed] [Google Scholar]
- 18.Linhardt R, Rice KG, Kim YS, Engelken JD, Weiler JM. Homogeneous, structurally defined heparin-oligosaccharides with low anticoagulant activity inhibit the generation of the amplification pathway C3 convertase in vitro. J Biol Chem. 1988;263:13090–13096. [PubMed] [Google Scholar]
- 19.Homola J. Present and future of surface plasmon resonance biosensors. Anal Bioanal Chem. 2003;377:528–539. doi: 10.1007/s00216-003-2101-0. [DOI] [PubMed] [Google Scholar]
- 20.Rich R, Myszka DG. Advances in surface plasmon resonance biosensor analysis. Curr Opin Biotechnol. 2000;11:54– 61. doi: 10.1016/s0958-1669(99)00054-3. [DOI] [PubMed] [Google Scholar]
- 21.Myszka D. Kinetic, equilibrium, and thermodynamic analysis of macromolecular interactions with BIACORE. Methods Enzymol. 2000;323:325– 340. doi: 10.1016/s0076-6879(00)23372-7. [DOI] [PubMed] [Google Scholar]
- 22.Morton T, Myszka DG. Kinetic analysis of macromolecular interactions using surface plasmon resonance biosensors. Methods Enzymol. 1998;295:268–294. doi: 10.1016/s0076-6879(98)95044-3. [DOI] [PubMed] [Google Scholar]
- 23.McDonnell J. Surface plasmon resonance: towards an understanding of the mechanisms of biological molecular recognition. Curr Opin Chem Biol. 2001;5:572– 577. doi: 10.1016/s1367-5931(00)00251-9. [DOI] [PubMed] [Google Scholar]
- 24.Jokiranta TS, Westin J, Nilsson UR, Nilsson B, Hellwage J, Lofas S, Gordon DL, Ekdahl KN, Meri S. Complement C3b interactions studied with surface plasmon resonance technique. Int Immunopharmacol. 2001;1:495– 506. doi: 10.1016/s1567-5769(00)00042-4. [DOI] [PubMed] [Google Scholar]
- 25.Pilatte Y, Hammer CH, Frank MM, Fries LF. A new simplified procedure for C1 inhibitor purification. A novel use for jacalin-agarose. J Immunol Methods. 1989;120:37– 43. doi: 10.1016/0022-1759(89)90286-x. [DOI] [PubMed] [Google Scholar]
- 26.Hernaiz M, Liu J, Rossenberg RD, Linhardt RJ. Enzymatic modification of heparin sulfate on a biochip promotes its interaction with antithrombin III. Biochem Biophys Res Comm. 2000;276:292–297. doi: 10.1006/bbrc.2000.3453. [DOI] [PubMed] [Google Scholar]
- 27.Osmond R, Kett WC, Skett SE, Coombe DR. Protein– heparin interactions measured by BIAcore 2000 are affected by the method of heparin immobilization. Anal Biochem. 2002;310:199–207. doi: 10.1016/s0003-2697(02)00396-2. [DOI] [PubMed] [Google Scholar]
- 28.Toida T, Yoshida H, Toyoda H, Koshiishi I, Imanari T, Hileman RE, Fromm JR, Linhardt RJ. Structural differences and the presence of unsubstituted amino groups in heparan sulphates from different tissues and species. Biochem J. 1997;322:499–506. doi: 10.1042/bj3220499. [DOI] [PMC free article] [PubMed] [Google Scholar]
- 29.Munoz EM, Yu H, Hallock J, Edens RE, Linhardt RJ. Poly(ethylene glycol) based biosensor chip to study heparin protein interactions. Anal Biochem. 2005;343:176– 178. doi: 10.1016/j.ab.2005.04.031. [DOI] [PMC free article] [PubMed] [Google Scholar]