Abstract
Time-reversed ultrasonically encoded (TRUE) optical focusing in turbid media was previously implemented using both analog and digital phase conjugation. The digital approach, in addition to its large energy gain, can improve the focal intensity and resolution by iterative focusing. However, performing iterative focusing at each focal position can be time-consuming. Here, we show that by gradually moving the focal position, the TRUE focal intensity is improved, as in iterative focusing at a fixed position, and can be continuously scanned to image fluorescent targets in a shorter time. Also, our setup is the first demonstration of TRUE focusing using a digital phase conjugate mirror in reflection mode, which is more suitable for practical applications.
Dynamic light focusing into biological tissue — a turbid medium — is desirable for biomedical imaging, sensing, manipulation, and therapy. However, focusing is impeded by multiple photon scattering events, which randomize light propagation in such media. Previously, time-reversed ultrasonically encoded (TRUE) optical focusing was demonstrated to overcome this hurdle. In TRUE focusing, an ultrasonic (US) pulse modulates, or ‘encodes’, light passing through it within the turbid medium. The encoded light reaching a phase-conjugate mirror (PCM) is then time-reversed, focusing light back to the original US volume. The optical focus can be formed dynamically at different locations by translating the US volume.
Both analog and digital PCMs have been used for TRUE focusing [1–5]. An analog PCM uses a photorefractive material to holographically reproduce the wavefront of the encoded light. Photorefractive materials can be made with large surface areas, and can provide more independent controls than digital PCMs, and thereby they have the potential to generate higher intensity and narrower foci [5]. However, erasure of the hologram during its readout limits the attainable energy gain [5]. Alternatively, a digital PCM uses a camera for wavefront recording and a spatial light modulator (SLM) for reproducing the phase-conjugated wavefront. Since the SLM is not affected during readout, digital PCMs have unlimited attainable energy gain as long as the incident optical power remains below the SLM’s optical damage threshold and the readout is within the speckle correlation time.
Also, by using the digital approach, TRUE focusing can be repeated, with the previous recorded wavefront used to generate the new recording at a fixed position of the US volume (‘iterative focusing’) [4]. Although iterative focusing increases the intensity and reduces the size of the optical focus, its longer operation time can be a drawback in applications requiring fast scanning. Here, we gradually move the position of the US volume, while again using the previously recorded wavefront to generate the next recording, thus continuously scanning the TRUE focus (‘continuous scanning’). The intensity and focal size improvements were comparable to those achieved using iterative focusing. We have also used a reflection-mode digital PCM, which was not previously explored in TRUE focusing, and is more practical in biomedical applications. Furthermore, in reflection mode, only a single PCM is needed to enable iterative focusing, whereas in transmission mode, two PCMs are required [4].
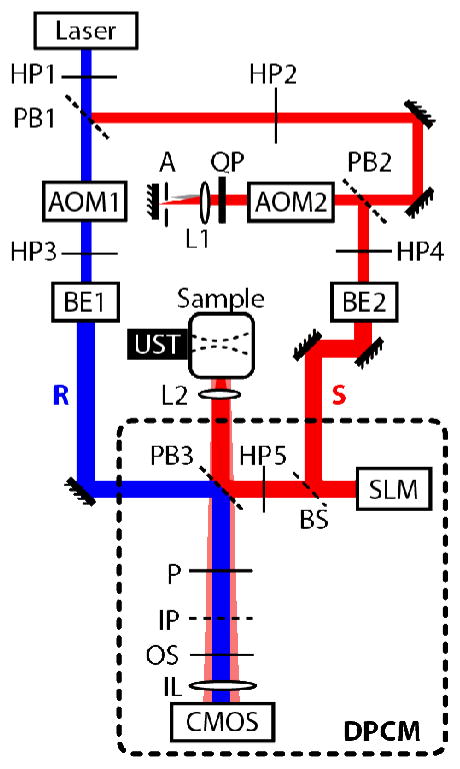
Our TRUE focusing system is schematically illustrated in Fig. 1. The digital PCM, whose principal components are a polarizing beamsplitter (PB3), SLM, and CMOS camera, is shown in the dotted rectangle. We used a 1920×1080 pixel phase-only SLM (PLUTO, Holoeye), which was calibrated to provide a linear phase shift over a 2π-rad range [6]. The phase distortions due to the SLM curvature were measured using a Michelson interferometer, and were compensated for in the experiment [7]. The SLM surface and the image plane (IP) of the CMOS camera (pco.edge, PCO AG) were arranged symmetrically about PB3, and the two devices were 1:1 pixel matched using an imaging lens (IL).
Fig. 1.
Schematic of the reflection-mode digital TRUE focusing optical system. AOM, acousto-optic modulators; A, aperture; BE, beam expanders; BS, beam splitter; HP, halfwave plates; IL, imaging lens for CMOS camera; IP, imaging plane of the CMOS camera; L, lenses; OS, optical shutter; P, polarizer; PB, polarizingbeam splitters; QP, quarterwave plate; R, reference beam; S, sample beam; SLM, spatial light modulator; UST, ultrasonic transducer. The digital phase-conjugate mirror (DPCM) is enclosed in a dotted frame for clarity.
The TRUE focusing procedure consisted of two stages: recording and readout. During the recording stage, optical pulses for the reference (R) and sample beams (S) were generated by turning on acousto-optic modulators (AOM) 1 and 2 (AOM2 was in a double-pass configuration) for 160 ns. The two beams were frequency shifted by fR = +75 MHz and fS = +125.00000625 MHz, respectively. S was reflected off the SLM before impinging on the sample. A 4-cycle US pulse with a center frequency fUS = 50 MHz modulated the diffuse light within the sample. The probing depth was determined by the delay between the US and the optical pulses. The backward-propagating portion of the diffused S from the sample interfered with R on the CMOS sensor. We tuned the polarizer (P) so that R and the diffused S had a similar intensity. To achieve sufficient light energy, the optical and US pulses were fired repeatedly at 500 kHz during the camera exposure time of 35 ms. We chose fR, fS, and fUS so that the phase difference between R and the US-encoded (or spectrally downshifted) S cycled through 0, π/2, π and 3π/2 in four consecutive frames of the CMOS camera, which operated at fCMOS = 25 Hz. This cycling was accomplished by setting where is the frequency of the ultrasonically downshifted S. The other frequency components of S contributed to the stationary background speckle pattern. In this way, the interferogram between R and the downshifted portion of S was captured by the CMOS sensor as an intensity oscillation which could be spectrally isolated from the stationary background. We recorded 64 frames, corresponding to 16 cycles of the intensity oscillation. The phase of the oscillation at each pixel, which corresponded to the wavefront of the encoded light, was measured from the recorded frames by taking the argument of the Fourier spectrum at the oscillation frequency. The calculation took ~10 s. In the readout stage, the measured wavefront was sign-reversed and displayed on the SLM after correction for the SLM’s curvature. Then AOM2 was turned on to generate a continuous-wave readout beam, which in turn generated a phase-conjugated beam of S when reflected by the SLM. The shutter in front of the camera was simultaneously closed to prevent over-exposure.
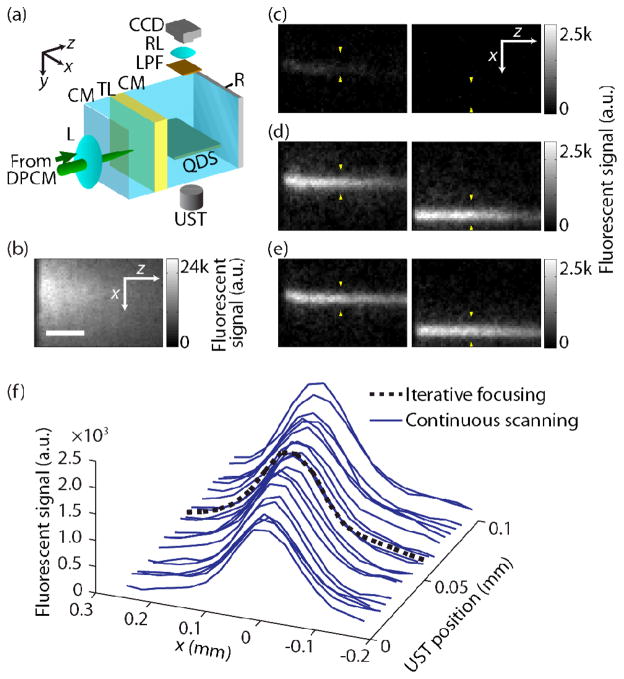
Our sample consisted of a 0.7-mm-thick turbid layer (gelatin and intralipid) with a reduced scattering coefficient μs’ = 10 cm−1 and a scattering anisotropy g = 0.9 [8], i.e., the thickness of the layer was approximately 0.7 transport mean free paths (lt′). As illustrated in Fig. 2(a), a polished aluminum reflector was placed 6.5 mm behind the turbid layer to aid the diffuse light collection. The ultrasound was focused on a ~400 μm thick fluorescent sheet containing quantum dots (QSA-600-2, Ocean Nanotech) mixed with gelatin, and inserted between the turbid layer and the reflector to record the light propagation through the turbid layer. The fluorescent sheet had an acoustic impedance similar to that of the surrounding clear medium. The distance of the US encoding region from the turbid layer was 2 mm. Note that, between the two known US encoding mechanisms of coherent diffuse light, the use of a clear medium simulates only the effect of refractive index changes and neglects that of displacements of scatterers. Nevertheless, we used a clear medium because the latter contribution is negligible for the US wavelength used (30 μm) and the typical scattering mean free path (100 μm) of biological tissue [12]. A 60-mm-focal-length lens focused light onto the turbid layer when the SLM displayed a uniform pattern. A CCD camera imaged the excited fluorescence from above. Although the turbid layer was thinner than 1lt′, the focused light was effectively scrambled when it reached the fluorescent layer, as shown in Fig. 2(b), which was acquired with a uniform SLM pattern.
Fig. 2.
Fluorescent images from single-shot TRUE focusing, iterative focusing, and continuous scanning. (a) Schematic of experimental configuration. CM, clear medium; DPCM, digital phase-conjugate mirror; L, lens; LPF, longpass filter; QDS, quantum-dot sheet; R, reflector; RL, relay lens; TL, turbid layer; UST, ultrasonic transducer. (b) CCD image of excited fluorescent signal on QD sheet when SLM pattern is uniform. Scale bar, 500 μm. (c)–(e) CCD images of excited fluorescent signal by (c) single- shot TRUE focusing, (d) 20-times iterative focusing, and (e) continuous scanning with step size Δx = 5 μm (see Media 1). The US positions are indicated by two yellow arrows in each figure. (f)Cross sections of excited foci by 20-times iterated TRUE focusing and continuous scanning with Δx = 5 μm.
As shown in Fig. 2(c)–(e), for different US pulse locations, we imaged the optical foci formed by TRUE focusing from single wavefront recordings (‘single-shot TRUE focusing’), iterative focusing, and continuous scanning. Adaptive background subtraction [2] was applied to compensate for the diffuse background caused by incomplete phase conjugation, by alternately adding 0 and π rad in 5×5 blocks across the recorded wavefront. In single-shot TRUE focusing, the focus is only vaguely observed, as shown in Fig. 2(c). Nevertheless, the intensity of the TRUE focus increased after 20 iterations, as shown in Fig. 2(d), similar to the transmission-mode demonstration [4]. However, each iteration took about 13 seconds, which is undesirable when fast scanning is needed. Instead, here we continuously scanned the TRUE focus by translating the US pulse position in Δx = 5 μm steps, which are less than the 70 μm focal width of the ultrasonic transducer. Images of the TRUE focus formed by the continuous scanning are shown in Fig. 2(e). The focal intensities are comparable to those achieved by iterative focusing. Also, compared to stepwise scanning by iterative focusing, continuous scanning achieves finer spatial sampling for the same number of wavefront recordings. To emphasize these points, in Fig. 2(f), we show the single focal cross section of the TRUE foci obtained from iterating 20 times at a static point, and the 20 cross sections from continuous scanning over 100 μm in 5 μm steps. Supplemental videos of the scans in Figs. 2(d) and (e) are also available (Media 1).
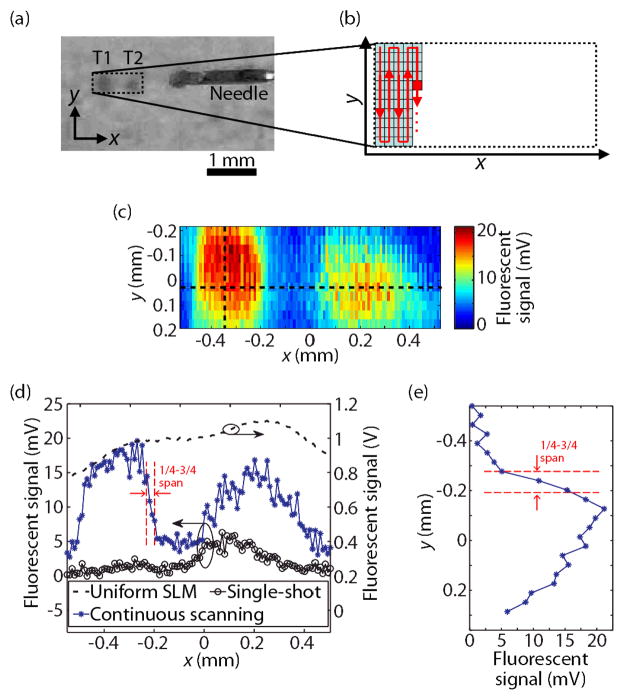
To demonstrate the usefulness of continuous scanning, we imaged two fluorescent objects T1 and T2, with dimensions of 0.3×0.4×1.3 mm3 and 0.3×0.3×1.2 mm3 along the x, y, and z dimensions, respectively. A photograph of the targets is shown in Fig. 3(a). The sample was made in the same configuration as shown in Fig. 2(a), but with the quantum-dot sheet replaced by the fluorescent targets.
Fig. 3.
Fluorescent imaging of QD targets through a turbid layer. (a) Photo of QD targets (T1, T2) placed behind a turbid layer. (b) Path of continuous scanning. (c) Fluorescent image obtained by continuous scanning with intervals Δx = 10 μm and Δy = 37.5 μm. (d) Cross-sectional image along the horizontal dashed line in (c), shown together using 1-D images using single-shot TRUE focusing and with a uniform SLM pattern. (e) 1-D image along the vertical dashed line in (c), using continuous scanning with an interval Δy = 37.5 μm.
To form a 2-D image, we continuously scanned the TRUE focus in both x and y directions, starting at the top left corner, as shown in Fig. 3(b). The scanning along the y direction was performed by changing the time delay between the US and optical pulses, with a step size of Δt = 25 ns, which corresponded to Δy = 37.5 μm. To scan along the x direction, the US transducer was translated by Δx = 10 μm. The fluorescent emission was measured by a photodiode, which replaced the CCD camera in Fig. 2(a). The signal from the diffuse background was subtracted in the same manner as before. Fig. 3(c) shows that the two objects were successfully resolved. We note that obtaining an image with the same spatial sampling using iterative focusing would have required a substantially longer measurement time, especially as each wavefront acquisition took about 13 s in our setup.
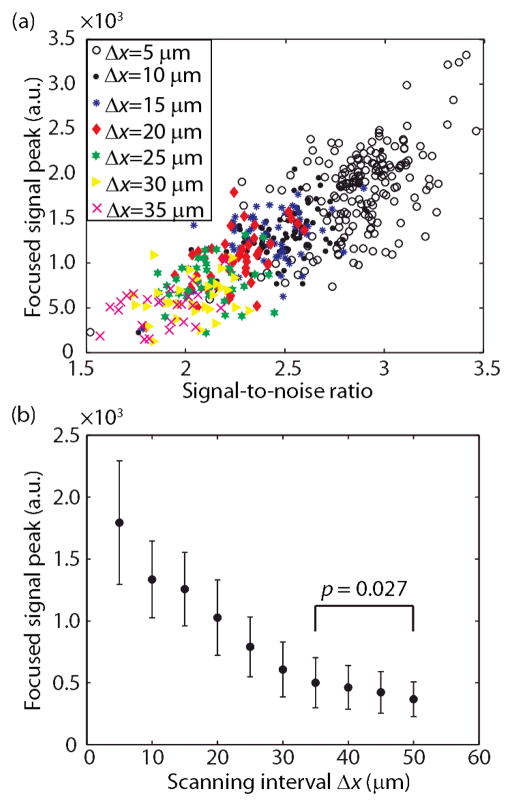
The cross-section along the horizontal dashed line in Fig. 3(c) is plotted in Fig. 3(d), along with similarly obtained fluorescent measurements using either single-shot TRUE focusing, or uncontrolled light illumination (i.e., the SLM pattern is uniform). For the uncontrolled illumination, the sample was scanned across the same range as the transducer in the TRUE focusing measurements. The uncontrolled illumination did not resolve the two targets, showing that the turbid layer effectively scrambled the light. Also, single-shot TRUE focusing produced a weaker signal, resulting in poorer contrast-to-noise ratios of the two targets. Target T2 appears brighter than T1 in single-shot TRUE focusing due to the illuminating beam being centered around x = 0 mm during the recording stage. In contrast, continuous scanning clearly visualized the two signal peaks corresponding to the two targets. It was previously shown that iterative focusing refines the resolution by a factor of n1/2 over single-shot TRUE focusing [4], where n is the number of iterations. Of course, such improvement continues until the noise becomes a limiting factor. For single-shot focusing, the resolution along the x direction was estimated to be 70 μm, using the full width at half maximum (FWHM) of the measured amplitude profile of the US focus. The resolution along the y axis was estimated from the FWHM of the convolution between the optical and US pulse envelopes. For an US pulse length of 80 ns and an optical pulse length of 160 ns, we estimated the y resolution to be 240 μm. Comparatively, the resolution from continuous scanning was estimated as 30 μm and 100 μm along the x and y directions, evaluated from the distance between 25 % and 75 % of the peak contrast for the left target as indicated in Figs. 3(d) and 3(e). The improved resolution over single-shot TRUE focusing can be explained as the result of the iterative property of continuous scanning, and was comparable to iterative focusing at n = 6. Using iterative focusing (n = 6) to obtain an image with similar spatial resolution (100 μm) over an 800 μm range, as in Fig. 3(e), would have required 48 iterations, while continuous scanning required only 23. We observed a correlation between the maximum intensity of the TRUE focus and the SNR of the subsequent wavefront recording, as shown in Fig. 4(a). The SNR was calculated from the interferogram by taking the ratio of the power spectral density of the Fourier spectrum at the preset intensity oscillation frequency (at fCMOS/4) and the mean power spectral density of the noise for each pixel, then averaging over all the pixels. The correlation coefficient was 0.82, implying that the relationship is close to linear, which is understandable because higher intensity at the encoding region increases the SNR of the subsequent recording. Therefore, the SNR of the recording can be used to qualitatively evaluate the TRUE focus hidden within the turbid medium without actually visualizing it, which is useful in practical applications.
Fig. 4.
Performance of continuous scanning with different scanning step sizes Δx. (a) SNR-to-peak relationship for different Δx’s. (b) Dependency of the focused signal peak on Δx. Error bars indicate the standard deviations.
We also see in Fig. 4(a) that the focused intensity is inversely related to the scanning step size Δx. The means of the focused intensities are plotted against Δx in Fig. 4(b). The standard deviation for each scanning interval is shown as an error bar. We see improvements in the intensity for Δx < 35 μm relative to Δx = 50 μm (p < 0.05, based on a Welch’s t-test). This is understood by noting that a smaller scanning step size compared to the TRUE focal spot results in larger overlap between the TRUE focus and the translated US volume in the subsequent recording, which would result in higher photon-encoding efficiency.
Further, we see in Fig. 4(a) that the intensity continues to increase at higher SNR values (> 3), implying that low SNR limits our system performance. The low SNR is mainly due to low photon-encoding efficiency, as well as to phase fluctuations from the interferometer, and is the reason we used a reflector in our samples. Because the encoded signal is weaker than the background, the bit depth of our recording camera (16 bits) can also limit the SNR. However, this was not the case for our experiment, where the signal-to-background ratio ranged between 0.4 % and 0.9 %. In comparison, the weakest resolvable signal-to-background ratio for our camera was ~0.002 %.
To penetrate deeper without a reflector, we could increase the number of encoded photons by using higher intensity US transducers, and reduce the fluctuations by actively stabilizing the interferometer. We could also filter the background light by using spectral hole burning [9], photorefractive materials [10], or Fabry-Perot cavities [11], all of which have previously been used to improve the SNR of encoded-light detection. Although we used a reflector to assist encoded-light detection during the recording phase, it is non-ideal for biological applications. While the low amount of encoded light is still a challenge, the proposed method improves both the SNR and the scanning speed. This is a promising step towards biological applications.
In summary, we have demonstrated continuous scanning of the TRUE focus by gradually moving the transducer, using a reflection-mode digital PCM. With a focal intensity similar to that of iterative focusing, the continuous scanning resolved fluorescent targets through a turbid medium, which were not resolvable by uncontrolled illumination or by single-shot TRUE focusing. Further, we have proposed using the SNR of the wavefront recording to evaluate the otherwise inaccessible optical focus formed within a turbid medium. The demonstration of continuous-scanning of the TRUE focus using a reflection-mode digital PCM is an encouraging step toward practical applications of TRUE focusing in biomedicine.
Acknowledgments
We thank James Ballard and Xiao Xu for editing the manuscript. This work was sponsored in part by National Institutes of Health grants DP1 EB016986 (NIH Director’s Pioneer Award) and R01 CA186567 (NIH Director’s Transformative Research Award). L.W. has a financial interest in Microphotoacoustics, Inc. and Endra, Inc., which, however, did not support this work.
Footnotes
OCIS Codes: (170.3880) Medical and biological imaging, (110.0113) Imaging through turbid media, (070.5040) Phase conjugation, (110.7050) Turbid media. http://dx.doi.org/10.1364/OL.99.099999
References
- 1.Xu X, Liu HL, Wang LV. Time-reversed ultrasonically encoded optical focusing into scattering media. Nature Photonics. 2011;5:154–157. doi: 10.1038/nphoton.2010.306. [DOI] [PMC free article] [PubMed] [Google Scholar]
- 2.Wang YM, Judkewitz B, DiMarzio CA, Yang CH. Deep-tissue focal fluorescence imaging with digitally time-reversed ultrasound-encoded light. Nature Communications. 2012;3:928–935. doi: 10.1038/ncomms1925. [DOI] [PMC free article] [PubMed] [Google Scholar]
- 3.Si K, Fiolka R, Cui M. Fluorescence imaging beyond the ballistic regime by ultrasound-pulse-guided digital phase conjugation. Nature Photonics. 2012;6:657–661. doi: 10.1038/nphoton.2012.205. [DOI] [PMC free article] [PubMed] [Google Scholar]
- 4.Si K, Fiolka R, Cui M. Breaking the spatial resolution barrier via iterative sound-light interaction in deep tissue microscopy. Scientific reports. 2012;2:748–751. doi: 10.1038/srep00748. [DOI] [PMC free article] [PubMed] [Google Scholar]
- 5.Lai P, Suzuki Y, Xu X, Wang LHV. Focused fluorescence excitation with time-reversed ultrasonically encoded light and imaging in thick scattering media. Laser Physics Letters. 2013;10:075604. doi: 10.1088/1612-2011/10/7/075604. [DOI] [PMC free article] [PubMed] [Google Scholar]
- 6.Tay JW, Taylor MA, Bowen WP. Sagnac-interferometer-based characterization of spatial light modulators. Applied Optics. 2009;48:2236–2242. doi: 10.1364/ao.48.002236. [DOI] [PubMed] [Google Scholar]
- 7.Oton J, Ambs P, Millan MS, Perez-Cabre E. Multipoint phase calibration for improved compensation of inherent wavefront distortion in parallel aligned liquid crystal on silicon displays. Applied Optics. 2007;46:5667–5679. doi: 10.1364/ao.46.005667. [DOI] [PubMed] [Google Scholar]
- 8.Flock ST, Jacques SL, Wilson BC, Star WM, van Gemert MJC. Optical Properties of Intralipid: A phantom medium for light propagation studies. Lasers in Surgery and Medicine. 1992;12:510–519. doi: 10.1002/lsm.1900120510. [DOI] [PubMed] [Google Scholar]
- 9.Li Y, Hemmer PL, Kim C, Zhang H, Wang LHV. detection of ultrasound-modulated diffuse photons using spectral-hole burning. Optics Express. 2008;16:14862. doi: 10.1364/oe.16.014862. [DOI] [PMC free article] [PubMed] [Google Scholar]
- 10.Murray TW, Sui L, Maguluri G, Roy RA, Nieva A, Blonigen FJ, DiMarizo CA. Detection of ultrasound-modulated photons in diffuse media using the photorefractive effect. Optics Letters. 2004;29:2509–2511. doi: 10.1364/ol.29.002509. [DOI] [PubMed] [Google Scholar]
- 11.Rousseau G, Blouin A, Monchalin JP. Ultrasound-modulated optical imaging using a high-power pulsed laser and a double-pass confocal Fabry-Perot interferometer. Optics Letters. 2009;34:3445–3447. doi: 10.1364/OL.34.003445. [DOI] [PubMed] [Google Scholar]
- 12.Wang LV. Mechanisms of Ultrasonic Modulation of Multiply Scattered Coherent Light: An Analytic Model. Phys Rev Lett. 2001;87:043903. doi: 10.1103/PhysRevLett.87.043903. [DOI] [PubMed] [Google Scholar]


