We report a new therapeutic strategy using chlorin e6-functionalized gold nanostars (GNS-PEG-Ce6) to coordinate photodynamic therapy (PDT) with plasmonic photothermal therapy (PPTT) upon single continuous wave (CW) laser. PDT is a new kind of cancer treatment that involves three major components: laser, tissue oxygen and photosensitizers. Without laser irradiation, photosensitizers are nontoxic to cells. When exposed to laser at appropriate wavelength, they can emit near-infrared (NIR) fluorescence and transform endogenous oxygen to singlet oxygen (1O2) to kill cancer cells. Because this reaction is based on direct light administration to tumors, PDT treatment has remarkably improved selectivity and fewer side effects as compared to conventional chemotherapies and radiotherapies[1-3]. However, photosensitizers are prone to self-destruction upon laser irradiation[4]. Additionally, once activated by light, PDT reaction will rapidly cause severe local hypoxia by depleting tissue oxygen and disrupting tumor blood flow, and eventually cease the production of 1O [5-7]2. These issues have hindered the therapeutic efficacy of PDT and greatly restricted its potential applications in the clinic[8]. Therefore, to overcome the intrinsic limitations of PDT, a new strategy is required to improve its therapeutic index upon prolonged laser irradiation.
Gold nanostructures such as nanorods, nanocages, and nanostars, have attracted particular research interest because they can effectively transfer laser energy to generate heat[9-17]. This unique property has opened up the use of nanostructures in biomedical applications for PPTT treatment[18-21]. By loading photosensitizers on nanostructures, researchers have combined PPTT with PDT to obtain high therapeutic index via synergistic effect[9,22,23]. Unfortunately, due to the absorption mismatch of nanostructures and photosensitizers at NIR region, most previous work used two different wavelength lasers to excite PDT and PTT separately. This sequential irradiation complicates the treatment process, and it is difficult to focus the two laser beams at the same position. Alternatively, photosensitizer-coated gold nanocages were reported for simultaneous two-photon PDT/PPTT in vitro[11]. Although improved outcome from PDT/PPTT treatment was observed, the two-photon excitation requires femtosecond pulse laser, which demand sophisticated instruments. More importantly, femtosecond pulse laser can rapidly melt gold nanostructures into gold nanospheres/aggregates within seconds, and deteriorate their capacity of photothermal conversion[24-27].
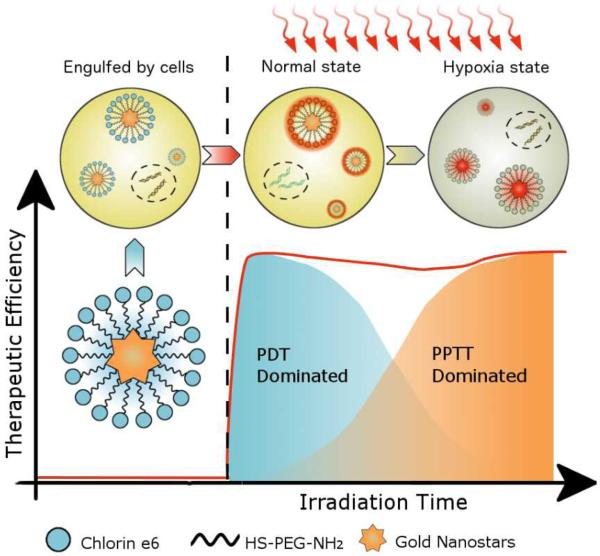
To perform simultaneous PDT/PPTT treatment upon single CW laser irradiation and overcome the internal limitations of PDT, we covalently anchored Chlorin e6 (Ce6, a commonly used photosensitizer), on the surface of gold nanostar (GNS). Due to its surface roughness and very high surface-to-volume ratio, GNS has potential of high drug loading efficiency for photosensitizer delivery[13,14]. To induce both PDT and PPTT effect by single NIR-CW laser, we adapted the localized surface plasmon resonance (LSPR) of GNS to fit that of Ce6. Upon laser irradiation, the GNS component in the nanoconjugates can continuously produce heat to kill cancer cells. Since this PPTT effect is oxygen-independent, the hypoxia environment induced by PDT reaction does not weaken the PPTT treatment[28,29]. Moreover, the GNS component is very stable upon CW laser irradiation; this enables PTT effect to accumulate over time. Since the PDT efficiency of Ce6 component decreases over time while the PTT effect gradually increases upon irradiation, we hypothesize that by adjusting irradiation time, the early-phase PDT effect can be coordinated with the late-phase PTT effect to obtain improved cancer therapy efficacy (Scheme 1). To verify our hypothesis, we compared GNS-PEG-Ce6 with free Ce6 and GNS in breast cancer and lung cancer modals at different irradiation time both in vitro and in vivo. Our results clearly demonstrate the theranostic potential of using GNS-PEG-Ce6 for coordinated PDT/PTT treatment upon single CW laser irradiation.
Scheme 1.
A schematic representation for explaining coordinated PDT/PPTT treatment upon single laser irradiation.
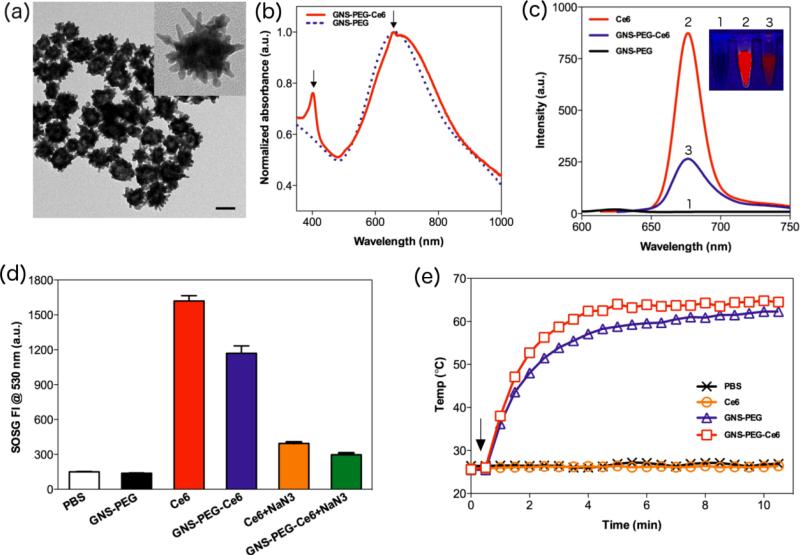
We synthesized GNS following a reported method to avoid potential cytotoxicity from cetyltrimethylammonium bromide (CTAB)[30]. The LSPR of GNS was adapted at roughly 670 nm by adjusting the concentration of AgNO3. Upon addition of thiol-PEG-amine (M.W. ≈ 2000 Da), the PEGylated GNSs (GNS-PEG) were obtained by forming Au-S bonds. The GNS-PEG exhibited excellent dispersivity and stability in a range of solutions including ultra pure water, dimethylformamide (DMF), phosphate buffered saline (PBS), and cell medium with serum (Figure S1). GNS-PEG was easily purified by centrifugation and conjugated with Ce6 by NHS-EDC reaction in DMF. As shown in Figure S1, GNS-PEG-Ce6 could be further transferred into ultra pure water, PBS, Dulbecco's modified eagle medium (DMEM) with 10% serum and Leibovitz's L-15 cell culture medium with 10% serum. The UV-Vis spectra showed that GNS-PEG and GNS-PEG-Ce6 were extremely stable in PBS with 10% serum (Figure S2). Transmission electron microscopy (TEM) images showed that the size of GNSPEG-Ce6 was 54.2 ± 3.5nm (Figure 1a). Dynamic light scattering (DLS) measurement of GNS-PEG-Ce6 exhibited a slightly larger hydrodynamic diameter of 78.0 ± 2.9 nm. This 12.0 nm increase in radius is consistent with the length of PEG chain. Successful anchoring of Ce6 was evidenced by identification of UV-Vis absorbance and Zeta potential measurement. UV-Vis spectra of GNS-PEG-Ce6 displayed the characteristic Ce6 Soret peak at 404 and Q-band at 658 nm (Figure 1b, S3). Zeta potential of purified GNS-Ce6-PEG showed a negative charge at -35.8 ± 2.4 mV, which is consistent with the previous reported data for Ce6-conjugated nanoparticles[2,31]. We then determined the gold concentration of GNS-PEG-Ce6 by inductively coupled plasma-mass spectroscopy (ICP-MS). Analysis by ICP-MS and UVVis spectroscopy showed that about 5, 800 Ce6 molecules were anchored on per GNS.
Figure 1.
(a) TEM images of GNS-PEG-Ce6 dispersed in ultra pure water. Scale bar, 50 nm. (b) Normalized UV-Vis spectra of GNS-PEG and GNS-PEG-Ce6. Arrows indicate the characteristic absorption peaks at 404 and 658 nm. (c) Fluorescence spectra of free Ce6, GNS-PEG and GNS-PEG-Ce6. (Insert are the fluorescence images of 0.175 nM GNS-PEG, 1 μM free Ce6 and 0.175 nM GNS-PEG-Ce6. From left to right: GNS-PEG, free Ce6, GNSPEG-Ce6) (d) SOSG fluorescence intensity (FI) at 530 nm in PBS, 0.175nM GNS-PEG, 1 μM free Ce6 (−/+ 10 μM NaN3) and 0.175 nM GNS-PEG-Ce6 (−/+ 10 μM NaN3) solutions after 671 nm laser irradiation (2.0 W/cm2, 10 min). (e) Heating curves of PBS, 0.7 nM GNS-PEG, 4 μM free Ce6 and 0.7 nM GNS-PEG-Ce6. Arrow indicates the start time point of laser irradiation (2.0 W/cm2, 10 min).
To explore the photophysical and photochemical properties of GNS-PEG-Ce6, we first compared the fluorescence intensity of GNS-PEG-Ce6 and Ce6. We observed that the fluorescence of Ce6 was markedly quenched once it was anchored on the surfaces of GNSPEG due to the strong GNS surface plasmonic effect (Figure 1c). Next, we investigated the 1O2 producing ability of GNS-PEG-Ce6 upon laser irradiation at 671 nm. The generation of 1O2 was determined by the fluorescence signal of singlet oxygen sensor green (SOSG). Interestingly, although the fluorescence of Ce6 was highly quenched by GNS, the 1O2 producing ability of GNS-PEG-Ce6 was considerably high (about 75% of free Ce6), implying its potential in biomedical applications. When sodium azide (NaN3, a well-known 1O2 scavenger) was added, the fluorescence signal of SOSG in both free Ce6 and GNS-PEG-Ce6 solutions were remarkably inhibited, further confirming the generation of 1O2 during laser irradiation process (Figure 1d). Finally, various concentrations of GNS-PEG-Ce6 solutions were exposed to 671 nm laser at 2.0 W/cm2. We noted that the temperature of solutions rose rapidly in the beginning 4 min of irradiation and then reached a plateau. A positive correlation between the plateaued temperature and the concentration of GNS-PEG-Ce6 was also observed (Figure S4). At the same concentration (0.7 nM), GNS-PEG solution showed similar temperature change with GNS-PEG-Ce6, while free Ce6 solution exhibited negligible temperature increase (Figure 1e). These results implied that GNS-PEG-Ce6 can produce heat upon laser irradiation, which encouraged us to apply this new nanoconjugate for coordinated PDT/PPTT treatment.
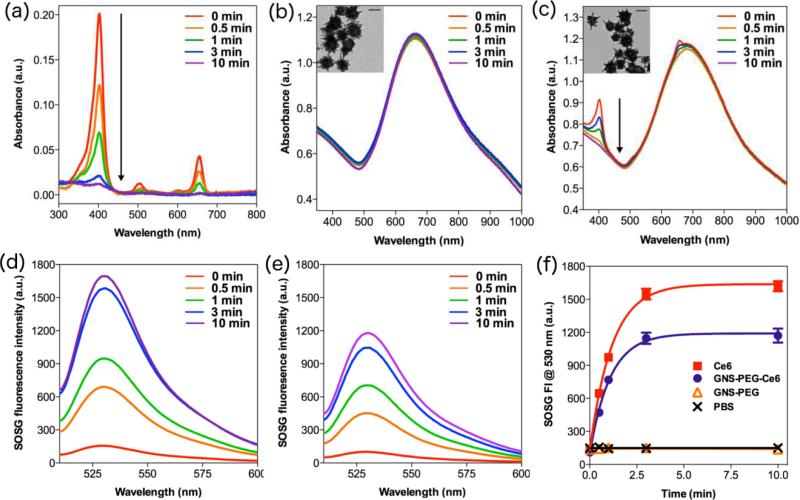
Given that photodegradation may greatly restrict the efficiency of both PDT and PPTT treatment, we investigated the photostability of Ce6, GNS-PEG, and GNS-PEG-Ce6 respectively. UV-Vis spectra were measured by spectrometer after giving different periods of laser irradiation (671 nm, 2.0 W/cm2). As shown in Figure 2a and 2c, the Soret peak of Ce6 at 404 nm decreased immediately upon the irradiation and almost disappeared after 3 min of persistent irradiation in both free Ce6 and GNS-PEG-Ce6 solutions. Since no new absorption peak appeared, this degradation was solely attributable to true photobleaching, but not to photomodification[32]. It is worth noting that the LSPR of GNS at ~670 nm didn't change after 10 min of persistent irradiation at the same experimental conditions in both GNS-PEG and GNS-PEG-Ce6 solutions (Figure 2b-c, S5). These evidences indicated that GNS is very stable upon CW laser irradiation, while Ce6 molecules would undergo photobleaching regardless of their anchoring on GNS. The 1O2 generation ability of free Ce6 and GNS-PEG-Ce6 also obviously decreased after 3 min of irradiation, which is consistent with the change of UV-Vis spectra (Figure 2d-f). Moreover, as shown in TEM images, GNS-PEG and GNS-PEG-Ce6 particles remained the typical multi-branch shape after irradiation (Figure 2b-c), which is another direct evidence to prove our hypothesis. It should be noted that the photostability of gold nanostructures is different under pulse laser and CW laser. Femtosecond or nanosecond pulse laser can melt and reshape gold nanostructures to nanospheres even in picoseconds[24-26]. This irreversible transformation of shape will dramatically deteriorate their heat producing ability[24,27]. On the contrary, gold nanostructures are extremely stable under CW laser in aqueous solutions or biological tissues[33]. We recorded the UV-Vis spectra of gold nanorods upon the laser irradiation for 1 h. As shown in Figure S6, there was no significant difference between UV-Vis spectra before and after irradiation. Therefore it is preferable to use CW laser instead of pulse laser, so that the therapeutic efficiency of PPTT treatment can accumulate to the desired level by simply adjusting the irradiation time.
Figure 2.
UV-Vis spectra of (a) 1 μM free Ce6, (b) 0.175 nM GNS-PEG, (c) 0.175 nM GNSPEG-Ce6 after different time of irradiation (671 nm, 2.0 W/cm2). Inserts are TEM images of GNS-PEG and GNS-PEG-Ce6 after irradiation. Scale bars, 50 nm. SOSG fluorescence spectra of (d) 1 μM free Ce6, (e) 0.175 nM GNS-PEG-Ce6 after different time of irradiation (671 nm, 2.0 W/cm2). (f) SOSG fluorescence intensity at 530 nm in PBS, 0.175 nM GNS-PEG, 1 μM free Ce6 and 0.175 nM GNS-PEG-Ce6 after different time of irradiation (671 nm, 2.0 W/cm2).
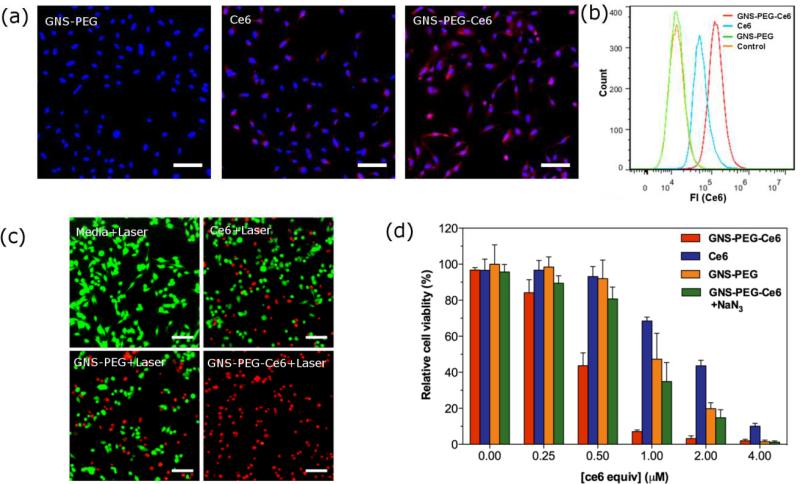
To quantify the cellular uptake of Ce6, we then conducted flow cytometry assays in breast cancer cell line MDA-MB-435. The mean intensity of fluorescence was 1.37-fold greater in GNS-PEG-Ce6 (1.45 × 10⁵) than that in free Ce6 treated cells (6.01 × 10⁴) after 24 h incubation (Figure 3b). As shown in fluorescence images in Figure 3a, cells exhibited significantly higher signal in GNS-PEG-Ce6 treated group than in free Ce6 treated group. Further analysis of fluorescence intensity profiles of fluorescence images was shown in the Supporting Information (Figure S7). These results validated the enhanced cellular uptake of GNS-PEG-Ce6.
Figure 3.
(a) Fluorescence image of MDA-MB-435 cells incubated with 0.875 nM GNS-PEG, 5 μM free Ce6 or 0.875 nM GNS-PEG-Ce6 after 24 h. Scale bars, 50 μm. (b) Flow cytometric analysis of mean fluorescence intensity (n = 10, 000 cells) in MBA-MB-435 cells incubated with media (orange), 0.875 nM GNS-PEG (green), 5 μM free Ce6 (blue), and 0.875 nM GNSPEG-Ce6 (red) for 24 h. (c) Fluorescence image of Calcein AM/Ethidium homodimer-1 stained MDA-MB-435 cells incubated with media, 1 μM free Ce6, 0.175 nM GNS-PEG or 0.175 nM GNS-PEG-Ce6 for 24 h after laser irradiation (671 nm, 2.0 W/cm2). Scale bars, 50 μm. (d) Relative viability of MDA-MB-435 cells incubated with various concentrations of free Ce6, GNS-PEG, GNS-PEG-Ce6 with or without 100 μM NaN3 after irradiation by 671 nm laser (2.0 W/cm2, 10 min).
The phototoxicity of free Ce6, GNS-PEG and GNS-PEG-Ce6 was examined by thiazolyl blue tetrazolium bromide (MTT) assay on breast cancer cell line MDA-MB-435 and lung cancer cell line A549. Because most of Ce6 molecules were photobleached upon irradiation (671nm, 2.0 W/cm2) after 3 min while GNSs still remained their PPTT activity, we hypothesized that extending irradiation time over 3 min can improve therapeutic efficiency of both GNS-PEG and GNS-PEG-Ce6, but not of Ce6. As expected, MTT assay results showed that 10 min of irradiation produced higher anti-cancer efficiency than 3 min of irradiation in GNS-PEG and GNS-PEG-Ce6 treated cells, but didn't increase cytotoxicity much in free Ce6 treated cells. This result indicates the difference of photostability between Ce6 and GNS upon CW laser (Figure S8a-b, d-e). It should be noted that GNS-PEG-Ce6 kills more cells than either free Ce6 or GNS-PEG alone after 10 min of irradiation (Figure 3d, S7f). Given that the cytotoxicity of GNS-PEG was negligible at low concentrations, this improved efficiency over free Ce6 at all concentrations may partially be attributed to the enhanced cellular uptake of GNS-PEG-Ce6. In order to confirm that the synergistic PDT/PPTT effect also contribute in GNS-PEG-Ce6 treatment, we then incubated GNS-PEG-Ce6 treated MDA-MB-435 cells with 100 mM NaN3 for 30 min before irradiation. The reason that we chose this concentration of NaN3 is that it can fully protect cells against PDT damage from high concentration of Ce6 (Figure S8c). The phototoxicity of GNS-PEG-Ce6 with NaN3 turned to be similar with that of GNS-PEG. This result suggested that both synergistic PDT/PPTT effect and enhanced cellular uptake are responsible for the improved therapeutic efficiency of GNS-PEG-Ce6. It is interesting to note that GNS-PEG-Ce6 showed higher therapeutic effect than the mixture of free Ce6 and GNS-PEG at the same concentration, which can be attributed to the enhanced cellular uptake efficiency of Ce6 after conjugation with GNS-PEG (Figure S9). The fluorescence live/dead cells staining agreed well with the MTT assay of phototoxicity (Figure 3c). Additionally, no significant dark cytotoxicity was observed in all groups (Figure S8g-i).
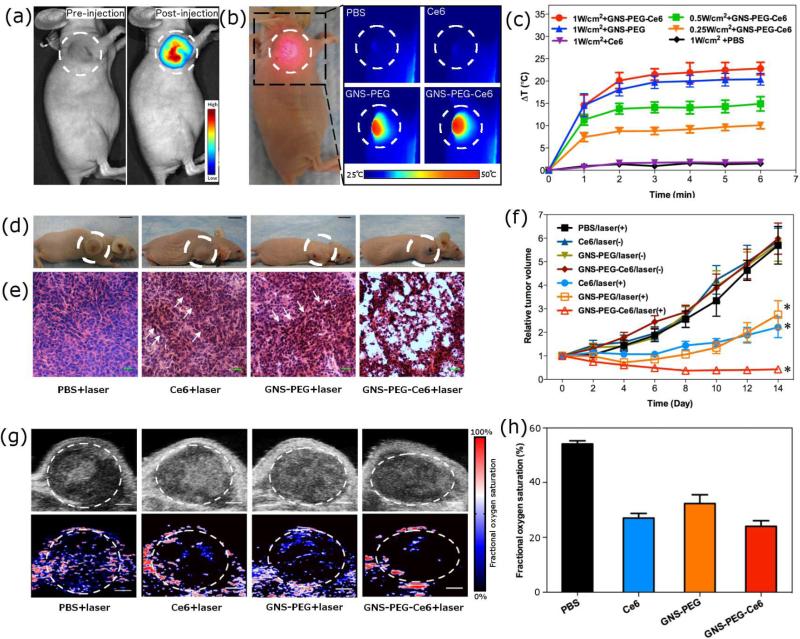
In order to demonstrate the utility of this new nanoconjugate for in vivo applications, we analyzed the theranostic ability of GNS-PEG-Ce6 in an MDA-MB-435 tumor bearing mice model. A series of images are shown in Figure 4. First, 17.5 nM GNS-PEG-Ce6 (corresponding to 100 μM Ce6) in 50 μL of PBS was administered by intratumoral injection, which is the most efficient way for delivery of both PDT photosensitizers and PPTT converters[34,35]. We then evaluated the fluorescence signal by Maestro 2 imaging system after injection of GNS-PEG-Ce6 in tumor-bearing mice. A strong fluorescence signal was observed in the tumor region within 4 h after injection (Figure 4a). Since NIR fluorescence can penetrate deep tissues, this signal is particularly useful in locating tumor and focusing laser beam under endoscopy[8]. Next we analyzed the temperature change of tumor upon laser irradiation using an infrared thermal camera. Various laser power densities at 0.25 W/cm2, 0.5 W/cm2, and 1.0 W/cm2 were tested (Figure 4b). When the laser power density was lower than 0.5 W/cm2, the GNS-PEG-Ce6-injected tumors exhibited a mild temperature increase up to 35.7 – 40.5 °C after 6 min of irradiation. Once exposed to laser at power density at 1.0 W/cm2, the temperature of tumor increased rapidly to 51.2 ± 1.4 °C, which is high enough to ablate the malignant cells. The surrounding healthy tissue showed a moderate increase to 35 – 40 °C. No significant temperature change was observed in other parts of the mouse (Figure S10). These results highlighted the tumor selectivity of PPTT upon laser irradiation. To confirm that the PPTT effect was from the GNS component in GNS-PEG-Ce6, we also tested tumor injected GNS-PEG or Ce6 (at the same dose as GNS-PEG-Ce6) upon laser irradiation at 1.0 W/cm2. For GNS-PEG, the tumor temperature increased to 49.8 ± 1.6 °C within 6 min, which is similar to GNS-PEG-Ce6. For ce6, in contrast, the tumor didn't show any significant temperature change (Figure 4b-c).
Figure 4.
In vivo theranostic applications of GNS-PEG-Ce6. (a) Fluorescence imaging of MDA-MB-435 tumor-bearing mice at pre-injection and 4 h post-injection of GNS-PEG-Ce6. (b) Thermal imaging of MDA-MB-435 tumor-bearing mice exposed to 671 nm laser (1.0 W/cm2) for 6 min at 4 h post-injection of PBS, Ce6, GNS-PEG, or GNS-PEG-Ce6. Photo in left panel indicates mice in irradiation process. Circles indicate the location of tumors. (c) Heating curves of tumors upon 671 nm laser irradiation over time. (d) Representative photos of MDA-MB-435 tumor-bearing mice from different groups 14 days after treatment. Circles indicate the location of tumors. (e) H&E stained tumor sections collected from different groups of mice eight days post treatment. Arrows indicate the sporadic necrotic areas. (f) Tumor growth curves of different groups of tumor-bearing mice after treatment. Tumor volumes were normalized to their initial sizes. Error bars represent the standard deviations of 4-6 mice per group. Asterisk means P < 0.05. (g) Ultrasound (upper row) and photoacoustic (lower row) imaging of MDA-MB-435 tumor-bearing mice exposed to 671 nm laser (1.0 W/cm2) for 6 min at 4 h post-injection of PBS, Ce6, GNS-PEG, or GNS-PEG-Ce6. Circles indicate the region of interest in tumors. Scale bars, 1 mm. (h) Quantitative analysis of fractional oxygen saturation of photoacousitc data in figure g.
We then compared the in vivo therapeutic efficiency of free Ce6, GNS-PEG, and GNS-PEG-Ce6 by measuring tumor growth rates. When the tumor size reached ~60 mm3, MDA-MB-435 tumor-bearing nude mice were divided into 7 groups. Mice in group 1, 2 and 3 received an intratumoral injection of 50 μL of 17.5 nM GNS-PEG-Ce6 (6 tumors each group), 17.5 nM GNS-PEG (6 tumors each group) or 100 μM free Ce6 (6 tumors each group), followed by 6 min of laser irradiation at 1.0 W/cm2 at 4 h post-injection. In parallel studies, mice in group 4, 5 and 6 received the intratumoral injection of 50 μL of 17.5 nM GNS-PEGCe6 (4 tumors each group), 17.5 nM GNS-PEG (4 tumors each group) or 100 μM free Ce6 (4 tumors each group), with no laser irradiation. As control groups, mice in group 7 received an intratumoral injection of 50 μL PBS (4 tumors), followed by 6 min of laser irradiation at 1.0 W/cm2. The tumor sizes were measured every two days after treatment (Figure 4f). We observed apparent anti-cancer effect in free Ce6 treated group, GNS-PEG treated group, and GNS-PEG-Ce6 treated group two weeks post-therapy (Figure 4d, 4f). Compared with the control group, the relative tumor volume was significantly reduced in free Ce6 (p = 0.001), GNS-PEG (p = 0.002) and GNS-PEG-Ce6 (p < 0.001) treated groups. In addition, the parallel groups without laser irradiation showed no apparent change of tumor size, suggesting that either free drugs or nanoconjugates by themselves cannot affect the tumor growth rate. The enhanced in vivo therapeutic efficiency was confirmed in GNS-PEG-Ce6 treated group compared with those in free Ce6 treated group (P = 0.039) and GNS-PEG treated group (P = 0.026). This result was in good agreement with in vitro studies. Since the tumor sizes of GNSPEG-Ce6 treated group began to show statistical significant difference from free Ce6 and GNS-PEG treated group on day 8 (GNS-PEG-Ce6 vs. Ce6, P=0.045; GNS-PEG-Ce6 vs. GNS-PEG, P=0.038), we carried out haematoxylin and eosin (H&E) staining of tumor sections at that time point. As shown in Figure 4e, apparent extensive cancer necrosis was noticed only in tumors with GNS-PEG-Ce6 treatment. In free Ce6 or GNS-PEG treated group, we observed sporadic necrotic areas surrounded by malignant cells with nuclear atypia, implying the remaining tumors began to regrow after treatment. In control group, H&E staining sections didn't reveal any obvious tumor necrosis (Figure 4e). Our results suggested that Ce6-modified GNS can coordinate PDT with PPTT treatment to obtain higher anti-cancer efficiency than either therapeutic modality alone. It is worth noting that this improved efficiency was obtained upon single laser irradiation, thus there's no need to switch between different wavelength lasers.
To quantify the oxygen tension in tumors after coordinated PDT/PPTT treatment, photoacoustic imaging was performed in MDA-MB-435 tumor bearing mice (Figure 4g). We intratumorally injected 50 μL of PBS, 17.5 nM GNS-PEG-Ce6 (corresponding to 100 μM of Ce6), 17.5 nM GNS-PEG, or 100 μM Ce6 into mice. The tumors were exposed to 671 nm laser at 4 h post-injection (1.0 W/cm2, 6 min). Compared to PBS injected group (52%), average fractional oxygen saturation inside tumors was remarkably decreased in free Ce6 (27%), GNS-PEG (32%) and GNS-PEG-Ce6 (25%) treated group (Figure 4h). Since hypoxia environment only cease the generation of 1O2 and leave the heat production unaffected[6,7,28,29], this result can partially explain the higher therapeutic efficiency of coordinated therapy than PDT alone.
In summary, for the first time we constructed GNS-PEG-Ce6 for coordinated photothermal/photodynamic therapy upon single CW laser irradiation both in vitro and in vivo. Our experimental results demonstrated that the difference in photostability between photosensitizers and gold nanostructures can be used to modulate PDT and PTT by adjusting irradiation time. Compared with previously reported photosensitizer-modified nanostructures[9,22,23], our strategy significantly improved the anti-cancer effect and greatly simplified the treatment process. Therefore, we believe that this GNS-PEG-Ce6 is high translational from proof-of-concept to real clinical practice.
Supplementary Material
Acknowledgements
This work was supported in part, by the National Basic Research Program of China (973 program, 2010CB933901, 2013CB733800 and 2013CB733802), the National Science Foundation of China (NSFC) (81272987, 81028009 and 30930028) and by the Intramural Research Program (IRP) of the National Institute of Biomedical Imaging and Bioengineering (NIBIB), National Institutes of Health (NIH).
Footnotes
Supporting Information
Supporting Information is available online from Wiley InterScience or from the author.
Contributor Information
Shouju Wang, Department of Medical Imaging, Jinling Hospital, Clinical School of Medical College Nanjing University, Nanjing, Jiangsu 210000 (China); Laboratory of Molecular Imaging and Nanomedicine (LOMIN), National Institute of Biomedical Imaging and Bioengineering (NIBIB), National Institutes of Health (NIH), Bethesda, Maryland 20892 (United States).
Peng Huang, Laboratory of Molecular Imaging and Nanomedicine (LOMIN), National Institute of Biomedical Imaging and Bioengineering (NIBIB), National Institutes of Health (NIH), Bethesda, Maryland 20892 (United States); Institute of Micro-Nano Science and Technology Shanghai Jiao Tong University, Shanghai 200240 (China).
Liming Nie, Laboratory of Molecular Imaging and Nanomedicine (LOMIN), National Institute of Biomedical Imaging and Bioengineering (NIBIB), National Institutes of Health (NIH), Bethesda, Maryland 20892 (United States); Center for Molecular Imaging and Translational Medicine, School of Public Health, Xiamen University, Xiamen 361005 (China).
Ruijun Xing, Laboratory of Molecular Imaging and Nanomedicine (LOMIN), National Institute of Biomedical Imaging and Bioengineering (NIBIB), National Institutes of Health (NIH), Bethesda, Maryland 20892 (United States).
Dingbin Liu, Laboratory of Molecular Imaging and Nanomedicine (LOMIN), National Institute of Biomedical Imaging and Bioengineering (NIBIB), National Institutes of Health (NIH), Bethesda, Maryland 20892 (United States).
Zhe Wang, Laboratory of Molecular Imaging and Nanomedicine (LOMIN), National Institute of Biomedical Imaging and Bioengineering (NIBIB), National Institutes of Health (NIH), Bethesda, Maryland 20892 (United States); Center for Molecular Imaging and Translational Medicine, School of Public Health, Xiamen University, Xiamen 361005 (China).
Jing Lin, Laboratory of Molecular Imaging and Nanomedicine (LOMIN), National Institute of Biomedical Imaging and Bioengineering (NIBIB), National Institutes of Health (NIH), Bethesda, Maryland 20892 (United States).
Shouhui Chen, Laboratory of Molecular Imaging and Nanomedicine (LOMIN), National Institute of Biomedical Imaging and Bioengineering (NIBIB), National Institutes of Health (NIH), Bethesda, Maryland 20892 (United States).
Gang Niu, Laboratory of Molecular Imaging and Nanomedicine (LOMIN), National Institute of Biomedical Imaging and Bioengineering (NIBIB), National Institutes of Health (NIH), Bethesda, Maryland 20892 (United States).
Guangming Lu, Department of Medical Imaging, Jinling Hospital, Clinical School of Medical College Nanjing University, Nanjing, Jiangsu 210000 (China).
Xiaoyuan Chen, Laboratory of Molecular Imaging and Nanomedicine (LOMIN), National Institute of Biomedical Imaging and Bioengineering (NIBIB), National Institutes of Health (NIH), Bethesda, Maryland 20892 (United States).
References
- 1.Dolmans DEJGJ, Fukumura D, Jain RK. Nat Rev Cancer. 2003;3:380–387. doi: 10.1038/nrc1071. [DOI] [PubMed] [Google Scholar]
- 2.Huang P, Lin J, Wang X, Wang Z, Zhang C, He M, Wang K, Chen F, Li Z, Shen G, Cui D, Chen X. Adv. Mater. 2012;24:5104–5110. doi: 10.1002/adma.201200650. [DOI] [PMC free article] [PubMed] [Google Scholar]
- 3.Huang P, Xu C, Lin J, Wang C, Wang X, Zhang C, Zhou X, Guo S, Cui D. Theranostics. 2011;1:240–250. doi: 10.7150/thno/v01p0240. [DOI] [PMC free article] [PubMed] [Google Scholar]
- 4.Hongying Y, Fuyuan W, Zhiyi Z. Dyes and Pigments. 1999;43:109–117. [Google Scholar]
- 5.Coutier S, Mitra S, Bezdetnaya LN, Parache RM, Georgakoudi I, Foster TH, Guillemin F. Photochem. Photobiol. 2001;73:297–303. doi: 10.1562/0031-8655(2001)073<0297:EOFROC>2.0.CO;2. [DOI] [PubMed] [Google Scholar]
- 6.Sitnik TM, Hampton JA, Henderson BW. Br. J. Cancer. 1998;77:1386–1394. doi: 10.1038/bjc.1998.231. [DOI] [PMC free article] [PubMed] [Google Scholar]
- 7.Tromberg BJ, Orenstein A, Kimel S, Barker SJ, Hyatt J, Nelson JS, Berns MW. Photochem. Photobiol. 1990;52:375–385. doi: 10.1111/j.1751-1097.1990.tb04193.x. [DOI] [PubMed] [Google Scholar]
- 8.Agostinis P, Berg K, Cengel KA, Foster TH, Girotti AW, Gollnick SO, Hahn SM, Hamblin MR, Juzeniene A, Kessel D, Korbelik M, Moan J, Mroz P, Nowis D, Piette J, Wilson BC, Golab J. CA Cancer J Clin. 2011;61:250–281. doi: 10.3322/caac.20114. [DOI] [PMC free article] [PubMed] [Google Scholar]
- 9.Jang B, Park J-Y, Tung C-H, Kim I-H, Choi Y. ACS Nano. 2011;5:1086–1094. doi: 10.1021/nn102722z. [DOI] [PubMed] [Google Scholar]
- 10.Huang X, El-Sayed IH, Qian W, El-Sayed MA. J. Am. Chem. Soc. 2006;128:2115–2120. doi: 10.1021/ja057254a. [DOI] [PubMed] [Google Scholar]
- 11.Khan SA, Kanchanapally R, Fan Z, Beqa L, Singh AK, Senapati D, Ray PC. Chem. Commun. (Camb.) 2012;48:6711–6713. doi: 10.1039/c2cc32313c. [DOI] [PubMed] [Google Scholar]
- 12.Chen J, Wang D, Xi J, Au L, Siekkinen A, Warsen A, Li Z-Y, Zhang H, Xia Y, Li X. Nano Lett. 2007;7:1318–1322. doi: 10.1021/nl070345g. [DOI] [PMC free article] [PubMed] [Google Scholar]
- 13.Yuan H, Fales AM, Vo-Dinh T. J. Am. Chem. Soc. 2012;134:11358–11361. doi: 10.1021/ja304180y. [DOI] [PMC free article] [PubMed] [Google Scholar]
- 14.Van de Broek B, Devoogdt N, D'Hollander A, Gijs H-L, Jans K, Lagae L, Muyldermans S, Maes G, Borghs G. ACS Nano. 2011;5:4319–4328. doi: 10.1021/nn1023363. [DOI] [PubMed] [Google Scholar]
- 15.Huang P, Bao L, Zhang C, Lin J, Luo T, Yang D, He M, Li Z, Gao G, Gao B, Fu S, Cui D. Biomaterials. 2011;32:9796–9809. doi: 10.1016/j.biomaterials.2011.08.086. [DOI] [PubMed] [Google Scholar]
- 16.El-Sayed IH, Huang X, El-Sayed MA. Cancer Lett. 2006;239:129–135. doi: 10.1016/j.canlet.2005.07.035. [DOI] [PubMed] [Google Scholar]
- 17.Huang P, Pandoli O, Wang X, Wang Z, Li Z, Zhang C, Chen F, Lin J, Cui D, Chen X. Nano Res. 2012;5:630–639. [Google Scholar]
- 18.Huang X, Jain PK, El-Sayed IH, El-Sayed MA. Lasers Med Sci. 2008;23:217–228. doi: 10.1007/s10103-007-0470-x. [DOI] [PubMed] [Google Scholar]
- 19.Seo WS, Lee JH, Sun X, Suzuki Y, Mann D, Liu Z, Terashima M, Yang PC, McConnell MV, Nishimura DG, Dai H. Nat Mater. 2006;5:971–976. doi: 10.1038/nmat1775. [DOI] [PubMed] [Google Scholar]
- 20.Robinson JT, Tabakman SM, Liang Y, Wang H, Casalongue HS, Vinh D, Dai H. J. Am. Chem. Soc. 2011;133:6825–6831. doi: 10.1021/ja2010175. [DOI] [PubMed] [Google Scholar]
- 21.Yang K, Feng L, Shi X, Liu Z. Chem Soc Rev. 2012 DOI 10.1039/c2cs35342c. [Google Scholar]
- 22.Tian B, Wang C, Zhang S, Feng L, Liu Z. ACS Nano. 2011;5:7000–7009. doi: 10.1021/nn201560b. [DOI] [PubMed] [Google Scholar]
- 23.Khlebtsov B, Panfilova E, Khanadeev V, Bibikova O, Terentyuk G, Ivanov A, Rumyantseva V, Shilov I, Ryabova A, Loshchenov V, Khlebtsov NG. ACS Nano. 2011;5:7077–7089. doi: 10.1021/nn2017974. [DOI] [PubMed] [Google Scholar]
- 24.Takahashi H, Niidome T, Nariai A, Niidome Y, Yamada S. Nanotechnology. 2006;17:4431–4435. [Google Scholar]
- 25.Link S, Burda C, Nikoobakht B, El-Sayed MA. Chemical Physics Letters. 1999;315:12–18. [Google Scholar]
- 26.Link S, Burda C, Nikoobakht B, El-Sayed MA. J. Phys. Chem. B. 2012;104:6152–6163. [Google Scholar]
- 27.Zhan Q, Qian J, Li X, He S. Nanotechnology. 2009;21:055704. doi: 10.1088/0957-4484/21/5/055704. [DOI] [PubMed] [Google Scholar]
- 28.Lal S, Clare SE, Halas NJ. Acc. Chem. Res. 2012;41:1842–1851. doi: 10.1021/ar800150g. [DOI] [PubMed] [Google Scholar]
- 29.Choi M-R, Stanton-Maxey KJ, Stanley JK, Levin CS, Bardhan R, Akin D, Badve S, Sturgis J, Robinson JP, Bashir R, Halas NJ, Clare SE. Nano Lett. 2012;7:3759–3765. doi: 10.1021/nl072209h. [DOI] [PubMed] [Google Scholar]
- 30.Yuan H, Khoury CG, Hwang H, Wilson CM, Grant GA, Vo-Dinh T. Nanotechnology. 2012;23:075102. doi: 10.1088/0957-4484/23/7/075102. [DOI] [PMC free article] [PubMed] [Google Scholar]
- 31.Huang P, Li Z, Lin J, Yang D, Gao G, Xu C, Bao L, Zhang C, Wang K, Song H, Hu H, Cui D. Biomaterials. 2011;32:3447–3458. doi: 10.1016/j.biomaterials.2011.01.032. [DOI] [PubMed] [Google Scholar]
- 32.Bonnett R, Martínez G. Tetrahedron. 2001;57:9513–9547. [Google Scholar]
- 33.Ratto F, Matteini P, Cini A, Centi S, Rossi F, Fusi F, Pini R. J Nanopart Res. 2011;13:4337–4348. [Google Scholar]
- 34.Amano T, Prout GR, Lin CW, Urol J. 1988;139:392–395. doi: 10.1016/s0022-5347(17)42441-4. [DOI] [PubMed] [Google Scholar]
- 35.Huang X, Peng X, Wang Y, Wang Y, Shin DM, El-Sayed MA, Nie S. ACS Nano. 2010;4:5887–5896. doi: 10.1021/nn102055s. [DOI] [PMC free article] [PubMed] [Google Scholar]
Associated Data
This section collects any data citations, data availability statements, or supplementary materials included in this article.


