Abstract
Hyperglycemia is common in patients undergoing cardiac surgery and is associated with poor outcomes. This is a review of the perioperative insulin protocol being used at Medanta, the Medicity, which has a large volume cardiac surgery setup. Preoperatively, patients are usually continued on their preoperative outpatient medications. Intravenous insulin infusion is intiated postoperatively and titrated using a column method with a choice of 7 scales. Insulin dose is calculated as a factor of blood glucose and patient's estimated insulin sensitivity. A comparison of this protocol is presented with other commonly used protocols. Since arterial blood gas analysis is done every 4 hours for first two days after cardiac surgery, automatic data collection from blood gas analyzer to a central database enables collection of glucose data and generating glucometrics. Data auditing has helped in improving performance through protocol modification.
Keywords: Cardiac surgery, infusion, insulin, protocol
INTRODUCTION
Type-2 diabetes is highly prevalent in India[1] and its management poses challenges especially in hospitalized patients. Patients undergoing coronary artery bypass graft surgery CABG suffer from type 2 diabetes in 30-40%[2] cases and another 50% of those without pre-existing diabetes develop hyperglycemia in the post-operative period.[3]
Glycemic management is an important predictor of outcomes in patients undergoing CABG.[4,5,6,7,8,9,10,11,12,13,14] Presence of diabetes is a risk factor for deep sternal wound infections DSWI[4,5] Although, earlier studies showed an association of diabetes with short-term morbidity and mortality in patients undergoing CABG, with improved hyperglycemia management, the immediate outcome in patients with diabetes is similar to those without diabetes.[6,7] New onset hyperglycemia in CABG patients, however, is still an important predictor of short-term mortality.[8] Also, studies done over a period of 7 to 10 years reveal that diabetes is an important risk factor for long-term morbidity and mortality after CABG.[9,10]
The management of diabetes in hospital and in patients undergoing CABG is challenging and complex. Making a simple protocol based on the assumption that glucose values vary in a linear, predictive manner with a single variable (insulin) affecting glucose in a constant manner will not work because in reality, glucose values vary in chaotic, unpredictable manner with a complex interaction between biological, behavioral and systematic factors outlined later in this article. Medanta, the Medicity is a multi-speciality tertiary care institute started in 2009 with a large cardiac surgery program. About 4,000 CABG are conducted annually. The endocrinology team takes care of the glycemic management of these patients during their hospital stay and later outpatient follow-up as an institutional policy.
Therefore, it was realized that any protocol needs to be designed to best suit our working system.
Medanta insulin protocols in patients undergoing CABG
The glucose values and insulin prescriptions are written on “glucose charts” in the patient's file [Appendix 1 (402.9KB, pdf) ], which are of two types: One for insulin infusion and other for subcutaneous insulin. The front side of glucose chart has
-
A table to fill in insulin doses by the doctors [see Appendix 1 (402.9KB, pdf) ]
- In the sub-cutaneous chart, the insulin doses need to be filled date wise before each meal, bedtime or basal and correction doses. This way, it is ensured that only scheduled insulin regimen is used and sliding scale has been eliminated from the hospital by the implementation of these charts.
- In the insulin infusion charts, date-wise insulin algorithms are written in a column manner.
Hypoglycemia standing orders
Target blood glucose values
Instructions to inform endocrinologist in case glucocorticoids or total parenteral nutrition is started or stopped; or oral intake is discontinued for any reason.
Glucose Monitoring Chart for Patients on Subcutaneous Insulin
On the reverse side of glucose charts, glucose values are recorded by the nurses (Appendix 1 (402.9KB, pdf) ), which being visualized on a single sheet are easy for the endocrinologist to see the trends and take decisions on insulin doses accordingly. For nurses, it is easy to see the insulin orders on the same chart where they enter glucose records. These charts also ensure that the only insulin orders that are followed, are the column method for insulin infusion or a scheduled insulin regimen for subcutaneous regimens. The nursing staff is well-trained and accustomed to these charts. There is a continued nursing education about hyperglycemia management and insulin.
Pre-operative assessment and management
In all patients with diabetes undergoing CABG, a glycosylated hemoglobin (HbA1c) is estimated
An endocrine consultation is done in all patients with diabetes or new onset hyperglycemia
In patients with HbA1c less than 7.5%, previous anti-diabetic medications are continued till the day before surgery
In patients with HbA1c 7.5 to 8.5%, modification in their medications is done depending on the point of care blood glucose (POC-BG) values after hospitalization. In our experience, often patients achieve better glycemic control in hospital as compared to that at home, most likely due to change in the diet
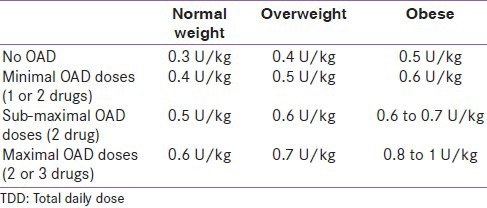
In patients with HbA1c >8.5% and if the patient is on oral anti-diabetics (OAD), insulin initiation is considered after stopping sulfonyl urea. However, if the patient had been on metformin or gliptin, these are continued along with insulin. Thiazoledindiones are avoided with insulin. Total daily dose (TDD) of insulin is estimated depending on the previous OAD doses, patient's body mass index (BMI), renal function, age and HbA1c value [Table 1]
In patients with HbA1c >8.5% and already on insulin, multiple sub-cutaneous insulin (MSI) regimen is started and doses titrated as per POC-BG values. In this case, TDD can be calculated by increasing current TDD by 20 to 40%.
Table 1.
Calculation of total daily dose preoperatively
Intra-operative management [Appendix 2 (383.6KB, pdf) ]
On the day of surgery, any oral anti-diabetic medication or sub-cutaneous insulin is withheld
Starting at 6 am, 5% dextrose is administered at 100 ml/hour with regular insulin 4 to 10 units added to 500 ml of the solution, depending on patient's insulin sensitivity and ambient blood glucose
POC-blood glucose (BG) is monitored every 2 hours. Any BG <80 mg/dl or more than 180 mg/dl, is informed to the endocrinology team and appropriate measures are taken
In patients with chronic kidney disease or heart failure, the rate of infusion of dextrose solution has to be reduced according to the patient's hydration status.
PERI–OP AND PERI2PROCEDURE ORDERS
Ideally, insulin should be administered as a 1:1 solution through an insulin pump with hourly titration. However, since these patients transiting between ward, pre-operative area and operation theater (OT) are more prone to hypoglycemia, insulin added to dextrose solution is preferred during this period [Appendix 2 (383.6KB, pdf) ].
Post-operative
On the day of surgery and the next day i.e. post-operative days (POD) 0 and 1, the patient is kept on insulin infusion. We follow the column method of insulin infusion protocol with six columns of different insulin rates [Appendix 3].
In the table, the most left-hand side column shows BG ranges. Each range is about 40 mg/dl, which is narrower than some other protocols, allowing for adjustments with small changes in BG.
The BG ranges start with less than 80 mg/dl and as we go down the column the values increase to a maximum of more than 300 mg/dl. The insulin infusion rates also progressively increase from top to bottom in each of the six columns of insulin rates, with higher rates at higher values and lower rates at lower values. But the relationship between BG and insulin infusion rate is non-linear or quadratic [Figure 1], with disproportionately higher rates at higher BG values to bring down the glucose levels faster. The aim is to bring the glucose values in the optimal range i.e., 110 to 180 mg/dl within 2 hours. At lower BG values, the insulin infusion rates are disproportionately lower to avoid hypoglycemia. The change in insulin plotted against change in BG (ΔI/ΔG) is different at different levels of glucose [Figure 2].
Figure 1.
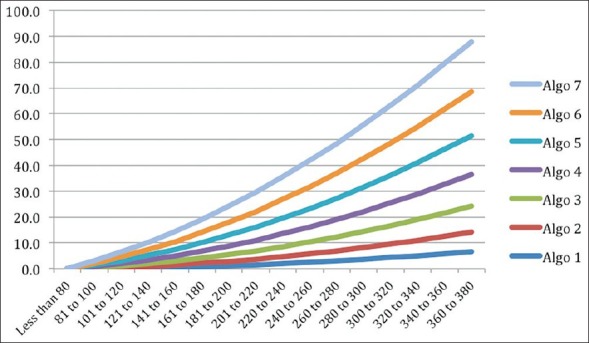
Relationship between mean of BG range and recommended insulin flow rate
Figure 2.
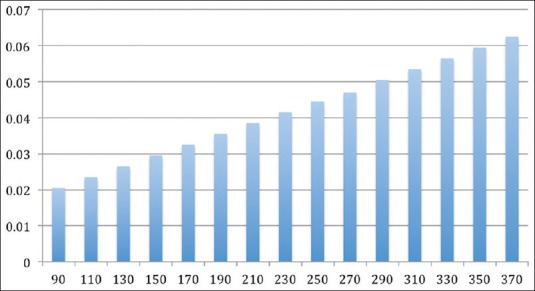
Glucose sensitivity (ΔI/ΔG) at various BG levels for column 4
When we move from left to right, at each BG level, the insulin rates increase. The first column has lowest rates of insulin for highly insulin sensitive patients or patients more prone to hypoglycemia. The last column has the highest rates of insulin for highly insulin-resistant patients or those on steroids or vasopressors. Insulin sensitivity (ΔI/ΔG) is different for different columns and that at BG level of 160 mg/dl for various columns is shown in the figure [Figure 3].
Figure 3.
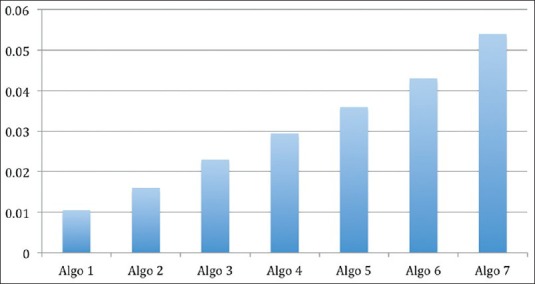
Sensitivity (ΔI/ΔG) for each of the columns at a glucose level of 150 mg/dl
The infusion is initiated at column 3 and titrated upwards or downwards in 4 hours depending on the glycemic response to the insulin infusion. If the patient is on vasopressors, the requirement is anticipated to be high and infusion is started at the highest rates (Column 6). For patient with kidney dysfunction, lower rates are administered. The doses also take into consideration the patient's medications before admission and HbA1c value.
The target BG in ICU is kept between 110 to 180 mg/dl.
Transition from insulin infusion to sub-cutaneous insulin
Usually by day 2, semisolid diet is initiated and patient is shifted to sub-cutaneous insulin. The patient's insulin TDD is calculated depending on the average of previous 4 hour infusion rates. This is multiplied by 20 to get the TDD. 40% is given as basal and 20% of TDD before each meal as prandial insulin. Correction doses for prandial insulin are also placed in the insulin chart [Appendix 1 (402.9KB, pdf) ]. The doses are then titrated depending on glycemic response. In our experience, the insulin requirement increases from day 2 to day 7, probably because of improvement in appetite and this is taken into consideration while titrating insulin doses.
The target fasting BG is 90 to 150 mg/dl. Titration of basal insulin depending on fasting BG:
If fasting BG is 150 to 200 mg/dl, basal insulin is increased by 20%
If fasting BG is 200 to 250 mg/dl, basal insulin is increased by 40%
If fasting BG is 250 to 300 mg/dl, basal insulin is increased by 60%
If fasting BG is 300+, basal insulin is increased by 80% and metformin is added, provided creatinine and patient's appetite is normal.
Since the appetite improves gradually, typically insulin requirement increases every day by 5-20% from post-operative day 3 to 10 and this is taken into consideration while doing daily insulin dose adjustments. The exception is, in patients with new onset hyperglycemia the insulin requirement usually reduces everyday and they usually do not need insulin 5 to 7 days after surgery.
Discharge planning and patient education
Patients are usually discharged by day 6. A nurse educator counsels all the patients or their primary caretakers on day 4 or 5 about insulin administration, self-monitoring of BG and hypoglycemia.
A nurse educator teaches the attendants or primary caretakers of the patients about insulin administration, self-monitoring of BG, hypoglycemia and correction doses in a room on the same floor where they are admitted. It is ensured that none of the patient is discharged without getting this basic education. They are advised to meet the endocrinologist 3 days after discharge, as they frequently need increase in insulin doses due to increased appetite and change in diet at home.
Outpatient follow-up
The patients are discharged on basal bolus insulin regimen and correction doses are given for initial 3 days. A correction dose of insulin is advised in the discharge summary for these initial 3 days. They are recalled to meet the endocrinologist three days after discharge, when addition of metformin and gliptin is considered if patient has good appetite. If the patient's TDD is low, insulin can completely be stopped and metformin or metformin and gliptin can be substituted. If insulin is continued, then the patients are counseled at length about insulin dose adjustment.
Second post-discharge visit is on day 7, when most patients can be shifted to OAD. However, since some surgeons still follow the school of thought that insulin helps in cardiac recovery, in their patients, insulin is usually continued for 6 weeks. However, not all patients manage daily self-monitoring blood glucose (SMBG) and insulin appropriately and in them, glycemic control is better with more convenient oral regimens. Hence more and more earlier initiation of OAD after CABG is advocated.
Glucometrics
Glucometrics are used to measure the efficacy of glucose control in the hospital. Since there are over 150 diabetic inpatients at any point of time, a robust data driven management system is employed to monitor and improve the performance of the protocol. Data of inpatient glucose values in non-critical wards is collected through manual entry of POC-BG values into the hospital information system. In critical care, since each patient with diabetes is tested 2 hourly for POC-BG, manual entry is difficult. Every 4th hour, arterial blood gas analysis is done in patients after CABG. Data from the blood gas analyzers is automatically transferred to a central database.
The endocrinology team is automatically alerted in case of hypoglycemic events and significant hyperglycemic exposure. Historical performance is also studied to identify opportunities for improvement and tighter control.
Comparison of commonly used algorithms
There are two broad classes of insulin infusion algorithms[15,16]
Those that adjust the sensitivity based on the observed deviation over a period of time and calculate the applicable dosage based on the current glucose value (University of Wisconsin, Glucommander)
Those, which calculate the required change in rate of insulin dosage, based on the glucose value and observed rate of change of glucose values (Portland protocol, Yale protocol).
Although, the algorithm being used at Medanta has organically developed and evolved without much influence of practices in other hospitals, it is similar to the protocols in type A. In comparison with the other types of protocols, this protocol only requires a quick look at the table by the nursing staff. The endocrinologist takes a decision for sensitivity change based on a daily review of the performance (or earlier if required). Thus, the nursing staff is able to understand and implement the protocol with minimal training, whereas the endocrinologist takes decisions on sensitivity changes based on knowledge of the patient's history and other considerations described above. The relationship between BG and insulin infusion rate is quadratic [Figure 1], with disproportionately higher rates at higher BG values to bring down the glucose levels within the desired range i.e. 110 to 180 mg/dl rapidly. At lower BG values, the insulin infusion rates are disproportionately lower to allow BG to increase to reach the desired levels. The change in insulin plotted against change in BG (ΔI/ΔG) is different at different levels of glucose [Figure 2]. Insulin sensitivity (ΔI/Δ G) is different for different columns and that at BG level of 150 mg/dl for various columns is shown in the figure [Figure 3].
The University of Wisconsin (UW) protocol also has a set of scales, which are adjusted based on the patient's sensitivity. Figure 4 shows a comparison of the scales used at our center vs. those in the UW protocol. Our protocol has finer control of sensitivities in the low to moderate sensitivity zone. However, the UW protocol uses a very aggressive algorithm for patients with high sensitivity, whereas we have found column 7 to be adequate for control in most cases. We have rarely used an infusion rate more than 12 units per hour.
Figure 4.
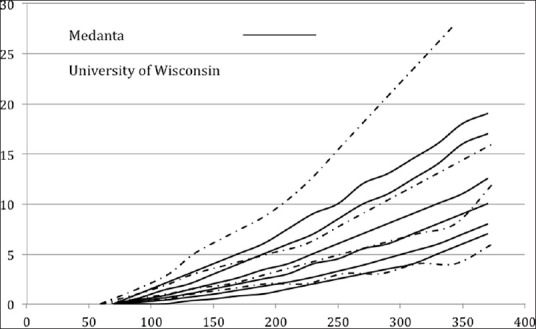
Comparison of the scales used at Medanta versus those in the University of Wisconsin protocol
Further, the choice of the starting scale is fixed in the UW protocol whereas in our hospital it is based on the assessment of the endocrinologist with the criteria described earlier.
DISCUSSION
Medanta, the Medicity is a multi-speciality tertiary care institute with a large cardiac surgery service. To cater to the need of large number of diabetic patients undergoing cardiac surgery, several members of endocrinology team are involved. Hence, to ensure uniform quality of care, the protocols came into shape gradually over the last 4 years ever since the center is running.
Target BG
Despite evidence that hyperglycemia can be associated with poor outcomes, hyperglycemia management is far from optimal in most centers around the world.[17] One of the limiting factors in inpatient hyperglycemia management is hypoglycemia. Lower the targets of BG, higher is the risk of hypoglycemia, which is a distressing event for the patient. There is a real risk of mortality with hypoglycemia and, therefore, insulin is one of the high alert medications and further insulin-related errors should be minimized at all costs. Apart from this, there is a suggestion in studies that hypoglycemia may also indirectly increase mortality and in fact worsen outcomes in critically ill patients. This was one of the reasons that the initial positive results of “tight glucose control” (i.e., BG between 80 to 110 mg/dl) seen in surgical intensive care unit (SICU)[18] were not replicated in subsequent studies. The more recent NICE-SUGAR study[19] and a subsequent metaanalysis[20] confirmed the skepticism felt by practitioners regarding tight glycemic control, by showing that BG values more than 140 mg/dl were associated with less mortality as compared to less than 110 mg/dl. Both American Diabetes Association (ADA) and American Association of Clinical Endocrinologists (AACE) recommend a target BG of 140 to 180 mg/dl in critically ill patients.[21] However, this statement is further qualified that, lower BG can be targeted in select group of patients. We have been able to maintain mean BG within our desired target range most of the times i.e., 110 to 180 mg/dl.
Hyperglycemia management in hospital is challenging also because several patient related and system related factors influence glycemic management in inpatients. In the initial post-operative period, mean BG is more than 180 mg/dl and the reason is that insulin infusion protocols are initiated after the patient is shifted to ICU. The peri-operative period patients transit between wards and also between caregivers with a higher risk of hypoglycemia. Ultimately, the translation of this knowledge into practice is dependent on system/organizational factors[22] like institutional policies; interdisciplinary coordination among primary team, diabetes specialist, nurses, dieticians; knowledge, behavior and beliefs of doctors and nursing staff towards glycemic management; coordination between meal timings and insulin; and protocol based hyperglycemia management. The introduction of the glucose charts was one such systemic factors, which improved glycemic control at our institution through various ways as described above and also it helped in virtually eliminating the sliding scale insulin method. Interface between blood gas analyzer and central database is another factor improving quality of care through provision of glucometrics.
Footnotes
Source of Support: Nil
Conflict of Interest: None declared
REFERENCES
- 1.Anjana RM, Pradeepa R, Deepa M, Datta M, Sudha V, Unnikrishnan R, et al. The Indian Council of Medical Research-India Diabetes (ICMR-INDIAB) study: Methodological details. J Diabetes Sci Technol. 2011;5:906–14. doi: 10.1177/193229681100500413. [DOI] [PMC free article] [PubMed] [Google Scholar]
- 2.Lazar HL. Glycemic control during coronary artery bypass graft surgery. ISRN Cardiol 2012. 2012:292–490. doi: 10.5402/2012/292490. [DOI] [PMC free article] [PubMed] [Google Scholar]
- 3.Azarfarin R, Alizadeh Asl A. Prevalence and intensity of hyperglycemia in non-diabetic patients undergoing coronary artery bypass graft surgery with and without cardiopulmonary bypass. Saudi Med J. 2008;29:1294–8. [PubMed] [Google Scholar]
- 4.Antunes PE, de Oliveira JF, Antunes MJ. Coronary surgery in patients with diabetes mellitus: A risk-adjusted study on early outcome. Eur J Cardiothorac Surg. 2008;34:370–5. doi: 10.1016/j.ejcts.2008.05.008. [DOI] [PubMed] [Google Scholar]
- 5.Bryan CS, Yarbrough WM. Preventing deep wound infection after coronary artery bypass grafting: A review. Tex Heart Inst J. 2013;40:125–39. [PMC free article] [PubMed] [Google Scholar]
- 6.Mediratta N, Chalmers J, Pullan M, McShane J, Shaw M, Poullis M. In-hospital mortality and long-term survival after coronary artery bypass surgery in young patients. Eur J Cardiothorac Surg. 2013;43:1014–21. doi: 10.1093/ejcts/ezs459. [DOI] [PubMed] [Google Scholar]
- 7.Movahed MR, Ramaraj R, Khoynezhad A, Hashemzadeh M, Hashemzadeh M. Declining in-hospital mortality in patients undergoing coronary bypass surgery in the United States irrespective of presence of type 2 diabetes or congestive heart failure. Clin Cardiol. 2012;35:297–300. doi: 10.1002/clc.21970. [DOI] [PMC free article] [PubMed] [Google Scholar]
- 8.Székely A, Levin J, Miao Y, Tudor IC, Vuylsteke A, Ofner P, et al. Investigators of the Multicenter Study of Perioperative Ischemia Research Group and the Ischemia Research and Education Foundation. Impact of hyperglycemia on perioperative mortality after coronary artery bypass graft surgery. J Thorac Cardiovasc Surg. 2011;142:430–7. doi: 10.1016/j.jtcvs.2011.03.009. e1. [DOI] [PubMed] [Google Scholar]
- 9.Shahian DM, O›Brien SM, Sheng S, Grover FL, Mayer JE, Jacobs JP, et al. Predictors of long-term survival after coronary artery bypass grafting surgery: Results from the society of thoracic surgeons adult cardiac surgery database (the ASCERT study) Circulation. 2012;125:1491–500. doi: 10.1161/CIRCULATIONAHA.111.066902. [DOI] [PMC free article] [PubMed] [Google Scholar]
- 10.Wu C, Camacho FT, Wechsler AS, Lahey S, Culliford AT, Jordan D, et al. Risk score for predicting long-term mortality after coronary artery bypass graft surgery. Circulation. 2012;125:2423–30. doi: 10.1161/CIRCULATIONAHA.111.055939. [DOI] [PMC free article] [PubMed] [Google Scholar]
- 11.Goldberg PA, Bozzo JE, Thomas PG, Mesmer MM, Sakharova OV, Radford MJ. “Glucometrics”--assessing the quality of inpatient glucose management. Diabetes Technol Ther. 2006;8:560–9. doi: 10.1089/dia.2006.8.560. [DOI] [PubMed] [Google Scholar]
- 12.Schnipper JL, Magee M, Larsen K, Inzucchi SE, Maynard G. Society of hospital medicine glycemic control task force summary. Practical recommendations for assessing the impact of glycemic control efforts. J Hosp Med. 2008;3(5 Suppl):66–75. doi: 10.1002/jhm.356. [DOI] [PubMed] [Google Scholar]
- 13.Ivert T, Holzmann MJ, Sartipy U. Survival in patients with acute kidney injury requiring dialysis after coronary artery bypass grafting. Eur J Cardiothorac Surg. 2014;45:312–7. doi: 10.1093/ejcts/ezt247. [DOI] [PubMed] [Google Scholar]
- 14.Hornero F, Martín E, Rodríguez R, Castellà M, Porras C, Romero B, et al. Working Group on Arrhythmia Surgery and Cardiac Pacing of the Spanish Society for Cardiovascular and Thoracic Surgery (SECTCV). A multicentre Spanish study for multivariate prediction of perioperative in-hospital cerebrovascular accident after coronary bypass surgery: The PACK2 score. Interact Cardiovasc Thorac Surg. 2013;17:353–8. doi: 10.1093/icvts/ivt102. [DOI] [PMC free article] [PubMed] [Google Scholar]
- 15.Steil GM, Deiss D, Shih J, Buckingham B, Weinzimer S, Agus MS. Intensive Care Unit Insulin Delivery Algorithms: Why So Many? How to Choose? Diabetes Sci Technol. 2009;3:125–40. doi: 10.1177/193229680900300114. [DOI] [PMC free article] [PubMed] [Google Scholar]
- 16.Goldberg PA, Siegel MD, Sherwin RS, Halickman JI, Lee M, Bailey VA, et al. Implementation of a Safe and Effective Insulin Infusion Protocol in a Medical Intensive Care Unit. Diabetes Care. 2004;27:461–7. doi: 10.2337/diacare.27.2.461. [DOI] [PubMed] [Google Scholar]
- 17.Committee on Quality Health Care in America, Institute of Medicine. Crossing the quality chasm: A new health system for the 21st century. Nat Acad Sci. 2001;(Ch. 6, 7) [Google Scholar]
- 18.van den Berghe G, Wouters P, Weekers F, Verwaest C, Bruyninckx F, Schetz M, et al. Intensive insulin therapy in the critically ill patients. N Engl J Med. 2001;345:1359–67. doi: 10.1056/NEJMoa011300. [DOI] [PubMed] [Google Scholar]
- 19.NICE-SUGAR Study Investigators. Finfer S, Chittock DR, Su SY, Blair D, Foster D, Dhingra V, et al. Intensive versus conventional glucose control in critically ill patients. N Engl J Med. 2006;360:1283–97. doi: 10.1056/NEJMoa0810625. [DOI] [PubMed] [Google Scholar]
- 20.Wiener RS, Wiener DC, Larson RJ. Benefits and risks of tight glucose control in critically ill adults: A meta-analysis. JAMA. 2008;300:933–44. doi: 10.1001/jama.300.8.933. [DOI] [PubMed] [Google Scholar]
- 21.Moghissi ES, Korytkowski MT, DiNardo M, Einhorn D, Hellman R, Hirsch IB, et al. American Association of Clinical Endocrinologists, American Diabetes Association. American Association of Clinical Endocrinologists and American Diabetes Association consensus statement on inpatient glycemic control. Diabetes Care. 2009;32:1119–31. doi: 10.2337/dc09-9029. [DOI] [PMC free article] [PubMed] [Google Scholar]
- 22.Workbook for Improvement: Improving Glycemic Control Preventing Hypoglycemia, and Optimizing Care of the Inpatient with Hyperglycemia and Diabetes. Society of Hospital Medicine. [Last accessed on 2008 Mar 10]. Available from: http://www.hospitalmedicine.org/
Associated Data
This section collects any data citations, data availability statements, or supplementary materials included in this article.
Supplementary Materials
Glucose Monitoring Chart for Patients on Subcutaneous Insulin
PERI–OP AND PERI2PROCEDURE ORDERS


