Abstract
Background:
Validity of Friedewald formula (FF) in patients with serum triglycerides (TGs) <400 mg/dl is unclear.
Materials and Methods:
We compared low-density lipoprotein (LDL)-cholesterol calculated by FF to directly measured LDL in a laboratory database of 14,620 lipid profile samples from south India.
Results:
LDL by FF correlated with directly measured LDL with correlation coefficient of 0.89 with the best correlation seen in TG levels 100-150. Higher level of TG (>200) underestimates the LDL calculated by FF particularly at LDL values <70 mg/dl. On the other hand, LDL is overestimated by FF in more than 70% of cases at LDL levels >130 mg/dl.
Conclusion:
We suggest repeating the LDL by direct assay techniques particularly in patients with TG >200 and when LDL <70 or >130. This helps in correctly stratifying the coronary artery diseases’ (CADs’) risk and goals of treatment.
Keywords: Friedewald formula, LDL cholesterol, triglyceride
INTRODUCTION
Low-density lipoprotein (LDL)-cholesterol, as estimated by the Friedewald formula (FF) in routine patient care, is a central focus of clinical practice guidelines throughout the world. The concentration of LDL is one of the strongest determinants of cardiovascular risk.[1] LDL can be calculated by FF (total cholesterol (TC) minus high-density lipoprotein (HDL)-cholesterol minus triglycerides (TGs)/5 in mg/dl) or measured directly in the laboratory. The FF is not valid for patients with TGs >400 and in patients for type 3 dyslipoproteinemia.[2] A number of studies have studied the impact of TG on the FF. These studies suggest LDL may be underestimated by the FF at low LDL levels and higher TG levels.[3,4,5] Limited study results from India have reached discordant conclusions on this topic. A study by Sahu et al.,[6] noted that the mean LDL calculated by FF was significantly higher than the direct LDL measurement at TG between 1 and 300 mg/dl. However, the study by Gupta et al.,[7] reported underestimation of LDL by FF at all levels of TG (ranging from 45 to 635 mg/dl). LDL was measured using direct homogenous assay (Daiichi Pure Chemicals Co. Ltd, Tokyo, Japan) in both the above studies. Anandaraja et al.,[8] noted that FF overestimated LDL in subjects with TG <350 mg/dl (LDL was measured using heparin precipitation method in their study).
Aims
We compared LDL calculated by FF and LDL measured directly, across various strata of TG, HDL, and LDL in a large laboratory database from south India.
Settings and design
Retrospective review of laboratory database.
MATERIALS AND METHODS
Outpatient fasting complete lipid profile (including directly measured LDL) for patients >18 years of age performed between January 2006 and February 2007 was included in the study. A total of 14,620 separate fasting lipid profiles were analyzed. Calculated LDL was derived using FF and directly measured using homogenous assay using liquid selective detergent (REF 1E31-20 Multigent®). The TG values were divided into five strata (<100-I, 101-150-II, 151-200-III, 201-400-IV, and >401-V), HDL values were divided into three strata (<40-a, 40-60-b, >60-c), and LDL was stratified into five levels (<70-i; 70-99-ii; 100-130-iii; 131-160-iv; and >160-v). Distribution of LDL and concordance between LDL strata was compared between directly measured LDL and that estimated by FF.
Statistical analysis used
Continuous variables were expressed as mean and standard deviation. Correlation between the LDL by FF and direct measurement was calculated using Pearson's correlation and means were compared using paired Student's t-test.
RESULTS
Patients were 51 ± 16 years of age and evenly distributed by sex (56% men). Patients with TG >400 (n = 228) were excluded from subsequent analysis. The median (interquartile range) TC was 176 (149-205), TG was 123 (90-169), and HDL was 42 (36-49). The median (interquartile range (IQR)) LDL calculated by FF was 105.5 (81.4-131.2) and that by direct method was 95 (74-116) mg/dl. Correlation coefficient (r) between measured LDL and FF calculated LDL was 0.89 (P < 0.001) and highest correlation was seen in TG strata II (r = 0.90).
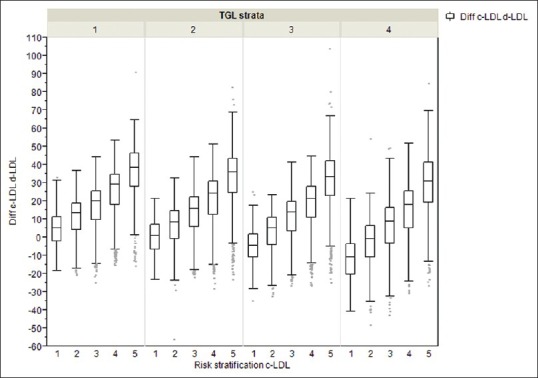
The median (interquartile range) difference between LDL by FF and directly measured LDL was 14.8 (3.6-23.2) in TG strata I (n = 4600), 12.2 (0.15-22.2) in TG strata II (n = 7562), 6.2 (-7.6 to 18.4) in TG strata III (n = 1807), and 0.4 (-12.4 to 14.4) (n = 423) on TG strata IV. Higher levels of TG resulted in significant underestimation of LDL values by FF (P < 0.001) [Figure 1]. This underestimation was more prevalent at the LDL <70 mg/dl.
Figure 1.

Differences between FF calculated LDL and directly measured LDL in the y-axis against the across various strata of TGΩ and LDL¶ in the x-axis expressed as box-plots (whiskers indicating 5th-95th centile). Ω = TG strata: <100 - I, 101-150 - II, 151-200 - III, 201-400 - IV, >401 -V; ¶ = LDL strata <70 - i, 70-99 - ii, 100-130 - iii, 131-160 - iv, >160 - v
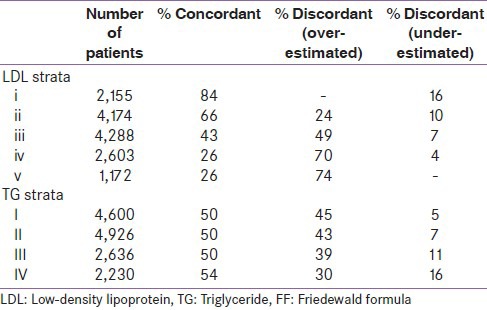
HDL levels did not have an independent effect on the LDL calculated by FF (P = 0.203). Concordance of the LDL strata between calculated and directly measured LDL across various LDL and TG strata is shown in Table 1. There was a more than 70% overestimation of risk strata by FF in LDL strata iv and v, while there was an underestimation of risk strata by FF in 16% of samples in LDL strata i and TG strata IV.
Table 1.
Concordance (and discordance) of the LDL strata between FF and directly measured LDL across various LDL and TG strata

Limitations
We did not have access to clinical characteristics of patients in our sample or clinical outcomes; treatment groupings and potential implications were inferred based on lipid profile only. It is unknown whether patients in our sample were receiving statin therapy.
DISCUSSION
Our large laboratory database analysis has revealed important results, which explains some of the discrepancies noted in the previous studies. We found that calculated LDL by FF can underestimate LDL (in comparison to directly measured LDL) at lower levels of LDL and higher levels of TG. However, FF overestimates LDL at higher strata of LDL. Our results mirror similar conclusions reached by Martin et al., and Mora et al.[9,10] Martin et al., looked into 1,310,440 total patients and 191,333 patients with Friedewald LDL <70 mg/dl and noted that a greater difference in the Friedewald-estimated versus directly measured LDL occurred at lower LDL and higher TG levels. They noted that if the Friedewald-estimated LDL was <70 mg/dl, the median directly measured LDL was 9.0 mg/dl higher (5th-95th percentiles, 1.8-15.4 mg/dl) when TG levels were 150-199 mg/dl and 18.4 mg/dl higher (5th-95th percentiles, 6.6-36.0 mg/dl) when TG levels were 200-399 mg/dl.[9] Mora et al., in their prospective study of 27,331 initially healthy women, noted that mean direct LDL was lower by approximately 5-10 mg/dl compared with Friedewald LDL.[10] While all the samples in our study were collected in the fasting state, Mora et al., showed that 21% of patients were classified into a lower-risk category by direct LDL measured in the non-fasting state.
The result of the current study becomes clinically relevant in two ways. Patients who have their LDL underestimated may lead to delay in initiation of adequate lipid-lowering therapy in high-risk patients as the practitioner is led to believe that the calculated LDL is indeed low, when it is not. On the other hand, when LDL is overestimated at higher levels, placing the patient in a higher risk strata, it results in unnecessary pharmacological therapy. Rechecking the LDL by standardized, direct assay techniques, particularly in patients with TG >200 and LDL <70 or >130 can correctly stratify the risk.
CONCLUSIONS
FF correlated with directly measured LDL with correlation coefficient of 0.89 with the best correlation seen in TG levels 100-150. Higher levels of TG (>200) underestimates the LDL by FF particularly at LDL <70. On the other hand, LDL is overestimated by FF in more than 70% of cases at LDL levels >130 mg/dl. We suggest repeating the LDL by direct assay techniques particularly in patients with TG >200 and when LDL <70 or >130. This helps in correctly stratifying the CAD risk and goals of treatment.
ACKNOWLEDGMENT
We sincerely acknowledge Dr Anita Suryanarayanan, Dr Monika Prabhakar, and Ms Kavitha of the Lister Metropolis Lab for their help in procuring data and helping us in the discussions.
Footnotes
Source of Support: Nil
Conflict of Interest: None declared
REFERENCES
- 1.Keevil JG, Cullen MW, Gangnon R, McBride PE, Stein JH. Implications of cardiac risk and low-density lipoprotein cholesterol distributions in the United States for the diagnosis and treatment of dyslipidemia: Data from National Health and Nutrition Examination Survey 1999 to 2002. Circulation. 2007;115:1363–70. doi: 10.1161/CIRCULATIONAHA.106.645473. [DOI] [PubMed] [Google Scholar]
- 2.Roberts WC. The Friedewald-Levy-Fredrickson formula for calculating low-density lipoprotein cholesterol, the basis for lipid-lowering therapy. Am J Cardiol. 1988;62:345–6. doi: 10.1016/0002-9149(88)90248-2. [DOI] [PubMed] [Google Scholar]
- 3.Sibal L, Neely RD, Jones A, Home PD. Friedewald equation underestimates low-density lipoprotein cholesterol at low concentrations in young people with and without Type 1 diabetes. Diabet Med. 2010;27:37–45. doi: 10.1111/j.1464-5491.2009.02888.x. [DOI] [PubMed] [Google Scholar]
- 4.Scharnagl H, Nauck M, Wieland H, Marz W. The Friedewald formula underestimates LDL cholesterol at low concentrations. Clin Chem Lab Med. 2001;39:426–31. doi: 10.1515/CCLM.2001.068. [DOI] [PubMed] [Google Scholar]
- 5.Jun KR, Park HI, Chun S, Park H, Min WK. Effects of total cholesterol and triglyceride on the percentage difference between the low-density lipoprotein cholesterol concentration measured directly and calculated using the Friedewald formula. Clin Chem Lab Med. 2008;46:371–5. doi: 10.1515/CCLM.2008.064. [DOI] [PubMed] [Google Scholar]
- 6.Sahu S, Chawla R, Uppal B. Comparison of two methods of estimation of low density lipoprotein cholesterol, the direct versus friedewald estimation. Indian J Clin Biochem. 2005;20:54–61. doi: 10.1007/BF02867401. [DOI] [PMC free article] [PubMed] [Google Scholar]
- 7.Gupta S, Verma M, Singh K. Does LDL-C Estimation using anandaraja's formula give a better agreement with direct LDL-C estimation than the friedewald's formula? Indian J Clin Biochem. 2012;27:127–33. doi: 10.1007/s12291-011-0186-3. [DOI] [PMC free article] [PubMed] [Google Scholar]
- 8.Anandaraja S, Narang R, Godeswar R, Laksmy R, Talwar KK. Low-density lipoprotein cholesterol estimation by a new formula in Indian population. Int J Cardiol. 2005;102:117–20. doi: 10.1016/j.ijcard.2004.05.009. [DOI] [PubMed] [Google Scholar]
- 9.Martin SS, Blaha MJ, Elshazly MB, Brinton EA, Toth PP, McEvoy JW, et al. Friedewald-estimated versus directly measured low-density lipoprotein cholesterol and treatment implications. J Am Coll Cardiol. 2013;62:732–9. doi: 10.1016/j.jacc.2013.01.079. [DOI] [PubMed] [Google Scholar]
- 10.Mora S, Rifai N, Buring JE, Ridker PM. Comparison of LDL cholesterol concentrations by Friedewald calculation and direct measurement in relation to cardiovascular events in 27,331 women. Clin Chem. 2009;55:888–94. doi: 10.1373/clinchem.2008.117929. [DOI] [PMC free article] [PubMed] [Google Scholar]


