Abstract
The BRAF kinase is mutated, typically V600E, to induce an active oncogenic state in a large fraction of melanoma, thyroid, hairy cell leukemia, and to a lesser extent, a wide spectrum of other cancers1,2. BRAFV600E phosphorylates and activates the kinases MEK1 and MEK2, which in turn phosphorylate and activate the kinases ERK1 and ERK2, stimulating the MAPK pathway to promote cancer3. Targeting MEK1/2 is proving to be an important therapeutic strategy, as a MEK1/2 inhibitor provides a survival advantage in metastatic melanoma4, which is increased when co-administered with a BRAFV600E inhibitor5. In this regard, we previously found that copper (Cu) influx enhances MEK1 phosphorylation of ERK1/2 through a Cu-MEK1 interaction6. We now show that genetic loss of the high affinity Cu transporter Ctr1 or mutations in MEK1 that disrupt Cu binding reduced BRAFV600E-driven signaling and tumorigenesis. Conversely, a MEK1-MEK5 chimera that phosphorylates ERK1/2 independent of Cu or an active ERK2 restored tumor growth to cells lacking Ctr1. Importantly, Cu chelators used in the treatment of Wilson disease7 reduced tumor growth of both BRAFV600E-transformed cells and cells resistant to BRAF inhibition. Taken together, these results suggest that Cu-chelation therapy could be repurposed to treat BRAFV600E mutation-positive cancers.
Reducing Ctr1 expression suppresses MAPK phenotypes in Drosophila and signaling in mammalian cells. In a cupric setting MEK1 also binds Cu and Cu chelation reduces MEK1/2 kinase activity6. Cu and to a lesser extent silver, which is isoelectric to cuprous Cu, increased MEK1 phosphorylation of ERK2, whereas other metals had no effect (Extended Data Fig. 1a). Given these results and the dependency of BRAF mutation-positive cancers on MEK1/28, we investigated whether reducing Cu influx affects BRAFV600E-driven tumorigenesis. BRAFV600E was expressed in immortalized Ctr1+/+ and Ctr1-/- mouse embryonic fibroblasts (MEFs)9 and intracellular Cu deficiency of the latter confirmed by increased CCS levels10 (Fig. 1a,b). The BRAFV600E-transformed Ctr1-/- MEFs exhibited reduced phosphorylated ERK1/2 (P-ERK1/2), cell growth, and tumor kinetics, effects rescued by expressing CTR1, but not the transport-defective mutant11 CTR1M154A (Fig. 1a-d and Extended Data Figs. 2a-c, 10a,b). Thus, BRAFV600E requires the Cu-transport function of CTR1 for robust signaling and tumorigenesis.
Figure 1. Binding of Cu to MEK1 promotes MAPK signaling and tumorigenesis by oncogenic BRAF.
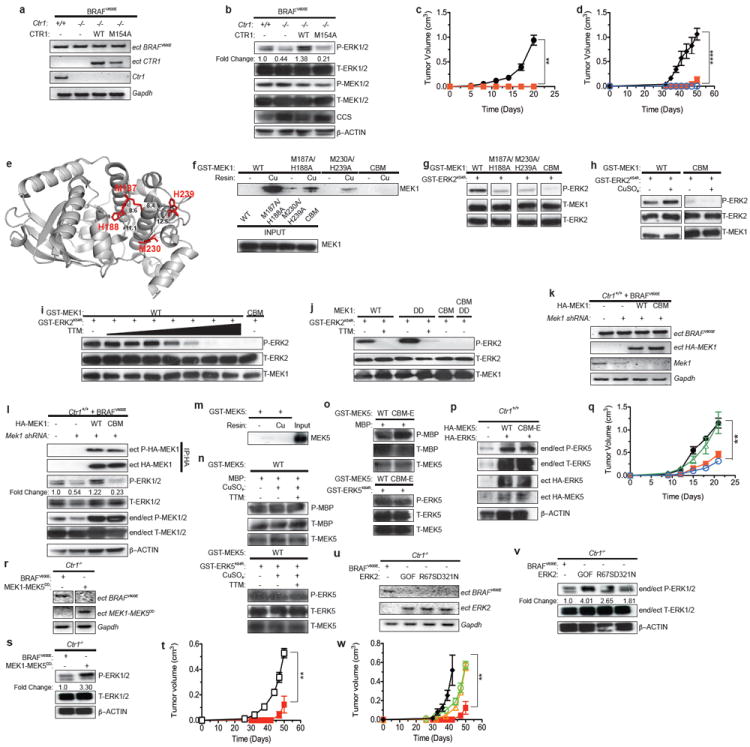
a,k,r,u RT-PCR and b,l,p,s,v immunoblot detection of the indicated endogenous, ectopic (ect), or both (end/ect) mRNA and phosphorylated (P) and/or total (T) proteins from cells. IP: immunoprecipitated. c,d,q,t,w Mean tumor volume (cm3) ± s.e.m. versus time (days) in mice injected with c, BRAFV600E-transformed Ctr1+/+ (black circle) or Ctr1-/- (red square) MEFs (n=4) d, BRAFV600E-transformed Ctr1-/- MEFs expressing no transgene (red square), CTR1 (black diamond), or CTR1M154A (blue open circle) (n=3) q, BRAFV600E-transformed Ctr1+/+ MEFs expressing scramble shRNA (black circle), Mek1 shRNA alone (red square) or with RNAi-resistant MEK1 (green open triangle) or MEK1CBM (blue open circle) (n=3) t, Ctr1-/- MEFs expressing BRAFV600E (red square, n=3) or MEK1-MEK5DD (black open square, n=4) or w, Ctr1-/- MEFs expressing BRAFV600E (red square, n=3), ERK2GOF (black diamond, n=3), ERK2R67S (yellow open triangle, n=4), or ERK2D321N (green open triangle, n=4). ** P<0.01. ***P<0.001.****P<0.0001. e, MEK1 structure (from PDB ID: 3EQD) denoting amino acids M187, H188, M230, and H239 and the intervening space (Å)13. f-j,m-o, Immunoblot detection of the indicated f,m recombinant proteins bound to a resin charged with or without Cu or g,h,i,j,n,o phosphorylated (P) or total (T) recombinant proteins with or without 50 μM TTM, a seven-fold increase in TTM from 0 to 50 μM, or either 2.5 molar equivalents or 2.5 μM CuSO4. Gel images are representative of at least two replicates.
To assess whether reducing Cu binding in MEK1 affects BRAFV600E-driven tumorigenesis, targeted mutagenesis revealed that M187A, H188A, M230A, and H239A as well as one other mutation reduced the ability of MEK1 to bind a Cu-charged resin and phosphorylate ERK1/2 (Extended Data Fig. 3a-c). Metal catalyzed oxidation reaction (MCO) followed by mass spectrometry identified oxidation at H188, M230A, H239, as well as two other sites (Fig. 1e and Extended Data Fig. 4), suggesting that these residues reside within 10 Å of a Cu atom12. We thus focused on H188, M230, H239, as well as M187, as although the oxidation status of M187 could not be determined, it lies adjacent to H188 and is similarly required for Cu-binding and kinase activity (Fig. 1e and Extended Data Figs. 3c, 4e). These four amino acids are conserved in MEK2 (Extended Data Fig. 5), which like MEK1, also bound a Cu-charged resin and was inhibited by tetrathiomolybdate (TTM), a Cu chelator (Extended Data Fig. 1b,c). In the three-dimensional MEK1 structure13, these four amino acids also cluster such that each is no more than 12.5 Å from the next (Fig. 1e). Combined mutations at these sites progressively reduced MEK1 kinase activity and affinity for Cu, with mutations at all four sites (copper-binding mutant) having the largest defect in kinase activity, even in the presence of a constitutively-active (DD)14 mutation or excess Cu (Fig. 1f-j). Nevertheless, MEK1CBM was still phosphorylated in BRAFV600E-transformed cells and underwent cooperative unfolding and possessed similar thermostability relative to MEK1, as assessed by both circular dichroism and differential scanning fluorimetry (Fig. 1k,l and Extended Data Figs. 6a-d, 10c). To rule out that the CBM mutation reduced kinase activity independent of Cu binding, we took advantage of the fact that MEK5 is highly homologous to MEK1/2, yet lacks two sites important for Cu binding (Extended Data Fig. 5) and neither bound the Cu-charged resin nor exhibited changes in kinase activity in the presence of Cu or TTM (Fig. 1m,n). Specifically, introducing a CBMEquivalent mutation into MEK5 was found to have no overt effect on the ability of MEK5 to phosphorylate substrates MBP or ERK5 in vitro or in cells (Fig. 1o,p). Given these results, we tested and found that the reduction in P-ERK1/2 and tumor growth of BRAFV600E-transformed, immortalized Ctr1+/+ MEFs upon knockdown of endogenous Mek1 mRNA by shRNA (Fig. 1k) was rescued by expressing RNAi-resistant MEK1, but not MEK1CBM (Fig. 1l,q and Extended Data Fig. 10c). Thus, under normal Cu homeostasis, inhibiting Cu binding in MEK1 retards BRAFV600E-driven signaling and tumorigenesis.
We next tested whether bypassing the requirement of MEK1/2 for Cu restores BRAFV600E-driven signaling and tumorigenesis to Ctr1-/- MEFs. MEK1 was engineered to be independent of Cu by fusing the ERK1/2-binding region of MEK115 to the kinase domain of MEK5, rendered active (DD mutation)16 as MEK5 is a substrate of the MAPKKK, MEKK2 and MEKK317. Expressing MEK1-MEK5DD resulted in high levels of P-ERK1/2 in immortalized Ctr1-/- MEFs (Fig 1r,s), in contrast to similarly activated MEK1DD, which remained sensitive to TTM (Fig. 1j). Furthermore, MEK1-MEK5DD restored tumor growth to these Ctr1-/- MEFs (Fig. 1t and Extended Data Fig. 10d). Similarly, expressing ERK2R67S, which increases ERK2 autophosphorylation in a MEK1/2-independent fashion18, ERK2D321N, which renders the kinase insensitive to phosphatases19, or ERK2GOF, which combines these two mutations, also led to robust ERK1/2 phosphorylation and restored tumor growth to the Ctr1-/- MEFs (Fig. 1u-w and Extended Data Fig. 10d). Thus, while reducing Cu levels will certainly have pleiotropic effects20 that could affect MAPK signaling21, activating the MAPK pathway in a fashion independent of Cu nevertheless restores MAPK signaling and tumorigenesis in cells deficient in Cu influx.
To investigate the relationship between Cu and endogenous oncogenic BRAF in tumorigenesis, CTR1 was stably knocked down by shRNA in BRAF mutation-positive and mutation-negative melanoma cell lines. Knockdown of CTR1 reduced P-ERK1/2 levels in all tested cell lines, although only the BRAF mutation-positive cell lines exhibited reduced tumor growth (Fig. 2a-c and Extended Data Fig. 10b), consistent with a dependency of BRAFV600E-tumorigenicity on MEK1/28. Knockdown of CTR1 also inhibited the tumor growth of one of two tested NRAS mutation-positive melanoma cell lines (Extended Data Fig. 7a,b). Finally, loss of Ctr1 had no effect on the ability of a different oncogene, CMYCT58A, to promote tumor growth (Fig. 2d,e). These results suggest a specific requirement for Cu in cancers particularly dependent upon the MAPK pathway.
Figure 2. Knockdown of CTR1 decreases MAPK signaling and tumorigenesis specifically by oncogenic BRAF.
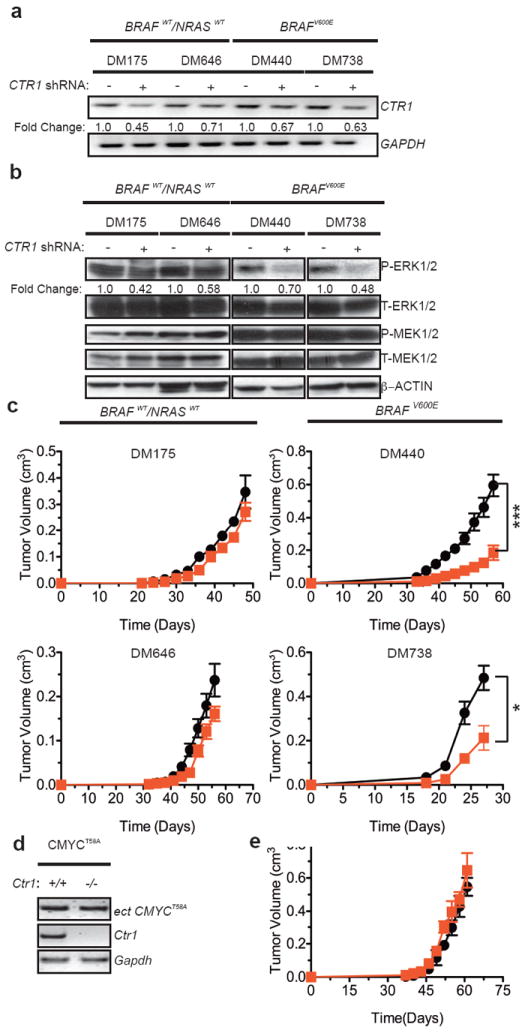
a, RT-PCR detection of the indicated mRNA b, immunoblot detection of the indicated phosphorylated (P) or total (T) proteins from cells and c, mean tumor volume (cm3) ± s.e.m. versus time (days) of mice injected (DM738 n=3, others n=4)) with the indicated cell lines expressing scramble (black circle) or CTR1 (red square) shRNA. *P<0.05. ***P<0.001. d, RT-PCR detection of the indicated endogenous or ectopic (ect) mRNA from cells and e, mean tumor volume (cm3) ± s.e.m. versus time (days) of mice (n=3) injected with CMYCT58A-transformed Ctr1+/+ (black circle) or Ctr1-/- (red square) MEFs. Gel images are representative of two replicates.
We next evaluated the requirement for Cu influx in vivo during spontaneous cancer development. Mice harboring floxed conditional null or wild-type Ctr1 alleles22 were crossed into a BrafCA/+;Trp53flox/flox (BP)23 background, which upon intranasal administration of adenovirus expressing Cre recombinase (AdCre) converts BrafCA to an oncogenic BrafV600E allele and Trp53flox to a null allele, leading to the development of lung adenocarcinomas23. Cohorts of Ctr1+/+ and Ctr1flox/flox BP mice were administered AdCre to induce cancer development, and in the latter case, to convert Ctr1flox/flox to null alleles. Tumors arising in both cohorts exhibited the appropriate recombination of the BrafCA, Trp53flox, and Ctr1flox alleles and targeted loss of Ctr1 did not result in a weight loss (Extended Data Fig. 8a,b). Ctr1flox/flox BP mice exhibited a decrease in the number of visible surface lesions, area of abnormal lung tissue, and P-ERK1/2 staining in tumors as well as a 15% survival advantage over Ctr1+/+ BP mice (Fig. 3a-g and Extended Data Fig. 10a,b). Thus, the loss of Ctr1 retards BRAFV600E-driven tumorigenesis, leading to a survival advantage.
Figure 3. Genetic ablation of Ctr1 decreases MAPK signaling and tumorigenesis and extends the lifespan in a mouse model of BrafV600E-driven lung cancer.
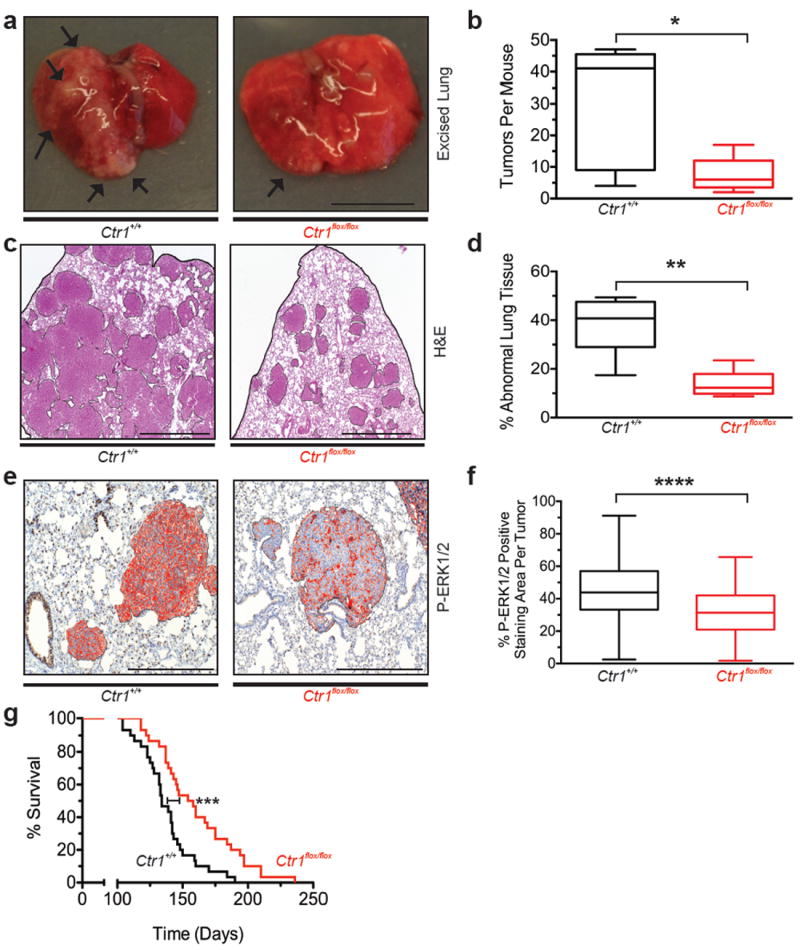
a, Representative resected (arrows: visible lesions, scale bar: 1cm) c, H&E stained (scale bar: 1mm) or e, immunohistochemical detection of P-ERK1/2 (red: positive pixels, scale bar: 500μm) of lungs of Ctr1+/+ or Ctr1flox/flox BP mice (a,c fixed or e, moribundity endpoint). b, Box and whiskers plot of tumors/mouse (n=5 lungs) d, mean % of area of abnormal lung tissue (n=5 lungs) and f, mean % P-ERK1/2 positive-staining area/lung tumor from Ctr1+/+ (n=199 tumors) versus Ctr1flox/flox (n=142 tumors) BP mice (b,d fixed or f, moribundity endpoint). g, Kaplan-Meier survival analysis of Ctr1+/+ (black line, n=30) versus Ctr1flox/flox (red line, n=30) BP mice. * P<0.05. ** P<0.01. ***P<0.001. ****P<0.0001.
Cu chelators D-penicillamine, trientine, and TTM are efficacious, long-term treatments for lowering systemic Cu levels in individuals with the Cu-overload disorder Wilson disease7. Capitalizing on these drugs, we tested and found that TTM reduced soft agar growth BRAFV600E-transformed, immortalized MEFs, but not the MEFs expressing ERK2GOF, MEK1-MEK5DD, or CMYCT58A. Soft agar growth of BRAF mutation-positive melanoma cell lines was also inhibited by TTM to varying degrees in a dose-dependent manner, while BRAF/NRAS mutation-negative lines were resistant to TTM (Fig. 4a and Extended Data Fig. 10e). Oral TTM treatments for only two weeks also reduced the size of tumors in mice injected with either BRAFV600E-transformed, immortalized MEFs or the BRAF mutation-positive melanoma cell line DM440, with no negative effect on mouse weight (Fig. 4b,c and Extended Data Figs. 9, 10e). This could be ascribed to a reduction in MEK1/2 kinase activity, as TTM halved the number of P-ERK1/2-positive cells in BRAFV600E-driven tumors and failed to inhibit tumor growth of ERK2GOF-transformed cells (Fig. 4d,e). To investigate more aggressive Cu-reducing therapeutic modalities, mice injected with BRAFV600E-transformed, immortalized MEFs were provided a Cu-deficient (CuD) diet supplemented with Cu and orally treated with vehicle alone for two weeks, or provided with a CuD diet and treated for two weeks with vehicle alone, oral TTM, or oral TTM followed by oral trientine (Fig. 4f). Tumors in mice fed a CuD diet trended towards being smaller, although this did not reach significance (P=0.055). Combining this diet with TTM blocked the development of visible tumors during the two weeks of treatment, although tumors quickly emerged after treatment ceased. However, mice treated with oral trientine after TTM exhibited a more durable response (Fig. 4g and Extended Data Fig. 10e). Thus, Cu-reducing strategies used to manage Wilson disease7 could be repurposed for the treatment of BRAFV600E-driven cancers.
Figure 4. Pharmacological chelation of Cu reduces tumor growth of BRAFV600E-driven and vemurafenib-resistant tumor cells.
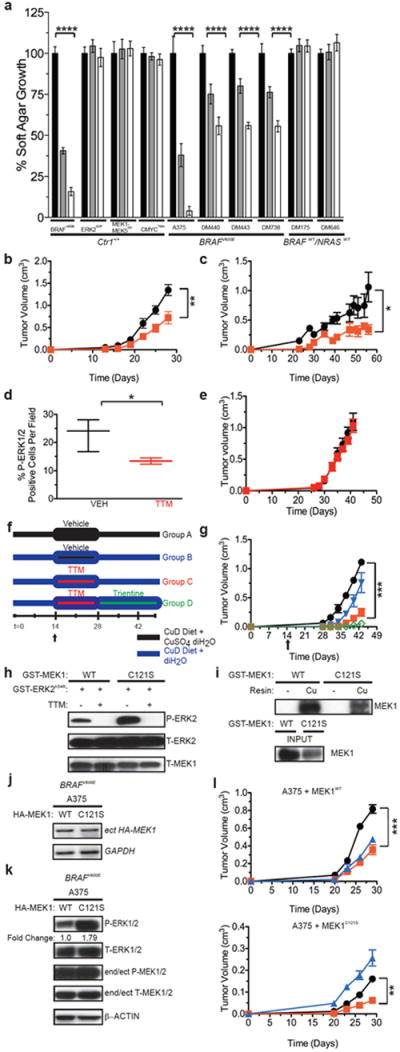
a, Normalized % average soft agar growth ± s.e.m of Ctr1+/+ MEFs (plated in triplicate) expressing the indicated transgenes or the indicated cell lines treated with vehicle (black bar), 100 nM (grey bar), or 400nM (white bar) TTM. **** P<0.0001. Representative of three experiments. b,c,g,l Mean tumor volume (cm3) ± s.e.m. versus time (days) of tumors in mice (n=3) injected with b, BRAFV600E-transformed Ctr1+/+ MEFs c, DM440 cells or e, ERK2GOF-transformed Ctr1-/- MEFs and treated with either vehicle (black circle) or TTM (red square). *P<0.05.**P<0.01. d, Box and whiskers plot of % P-ERK1/2 positive-stained cells/field from tumors derived from mice (n=3) injected with BRAFV600E-transformed Ctr1+/+ MEFs and treated with vehicle (black line) or TTM (red line). *P<0.05. f, Dosing and diet regimen and g, mean tumor volume (cm) ± s.e.m. versus time (days) in mice (n=3) injected with BRAFV600E-transformed Ctr1+/+ MEFs and provided a copper-deficient diet (CuD) with either deionized H2O (diH2O) and treated 2 weeks with vehicle (Group A, black circle) or diH2O supplemented with CuSO4 and treated 2 weeks with vehicle (Group B, blue triangle), TTM (Group C, red square), or TTM then trientine (Group D, green open diamond). ***P<0.001. h, Immunoblot detection of the indicated mRNA and phosphorylated (P) or total (T) recombinant proteins with or without 50 μM TTM. i, Immunoblot detection of the indicated recombinant proteins bound to a resin charged with or without Cu. j, RT-PCR and k, immunoblot detection of indicated phosphorylated (P) or total (T) endogenous, ectopic (ect), or both (end/ect) proteins in A375 cells expressing HA-MEK1 or HA-MEK1C121S. l, Mean tumor volume (cm3) ± s.e.m. versus time (days) of mice injected with A375 cells expressing MEK1 (left) or MEK1C121S mutant (right) and treated with vehicle (black circle, n=4), TTM (red square, n=3), or vemurafenib (blue diamond, n=4). **P<0.01. ***P<0.001. Gel images are representative of at least two replicates.
BRAFV600E inhibitors such as vemurafenib have a limited duration of response due to acquired resistance often associated with reactivation of MEK1/224. One reported mechanism of resistance is acquisition of an activating C121S mutation in MEK125. Interestingly, although MEK1C121S had elevated kinase activity in vitro, it still bound to the Cu-charged resin and its kinase activity was still inhibited by TTM (Fig. 4h,i). Moreover, although expressing MEK1C121S in the BRAF mutation-positive melanoma cell line A375 increased P-ERK1/2 levels and imparted resistance to vemurafenib compared to the same cells expressing MEK1, the MEK1C121S-expressing A375 cells nevertheless still remained sensitive to TTM in vivo (Fig. 4j-l and Extended Data Fig. 10f). Thus, Cu chelation reduces tumorigenicity driven by a mutation that confers resistance to a BRAFV600E inhibitor.
While the detailed mechanism underlying the requirement of Cu for robust MEK1/2 kinase activity remains to be elucidated, we show that decreasing Cu influx, Cu bioavailability, and binding of Cu to MEK1 reduced MEK1(2) kinase activity and oncogenic BRAF-driven tumorigenesis. Cu chelators, which are safe and economical drugs dosed daily for upwards of decades to manage Cu levels in Wilson disease patients7, also reduced oncogenic BRAF- and MEK1-driven tumorigenesis. As such, inhibiting MEK1/2 kinase activity with Cu chelators, perhaps in combination with other MAPK inhibitors, may merit clinical consideration for the treatment of not only BRAF mutation-positive cancers, but cancers developing resistance to BRAFV600E and potentially even MEK inhibitors.
METHODS
Cell lines
Ctr1+/+ and Ctr1-/- immortalized (with SV40) MEFs were previously described9. A375 was purchased from ATCC. DM175, DM440, DM443, DM598, DM646, DM738, and DM792 were provided by D. S. Tyler (Duke University)29. Mouse lung cancer cell lines were created and cultured as previously described30. Ctr1+/+ and Ctr1-/- immortalized MEFs, A375, DM175, DM646, DM440, DM598, DM738, and DM792 were stably infected with retroviruses derived from pBabe, pWZL, or pSUPER-based vectors (see plasmids below) as previously described31. Ctr1+/+ immortalized MEFs were stably transfected with pCMV-based vectors (see plasmids below) using established protocols.
Plasmids
pBABEpuro-MYC-HIS-BRAFV600E, pSUPER-retro-puro-tetO-RALB-scramble (encoding RALB scramble shRNA), pBABEpuro-CMYCT58A, and pCMV-HA-MEK1WT were previously described6,32-34. pBABEbleo-FLAG-BRAFV600E was created by PCR subcloning BRAFV600E from the pBABEpuro-MYC-HIS-BRAFV600E plasmid with primers designed to include an N-terminal FLAG-tag. pWZLblasti-CTR1WT and -CTR1M154A were created by PCR subcloning CTR1WT or CTR1M154A from the pCDNA3.1-CTR1WT or -CTR1M154A plasmids11. pGEX6P1-GST-HA-MEK1WT and pWZLblasti-HA-MEK1WT were created by PCR subcloning MEK1WT from the pENTR1-MEK1WT plasmid35 with primers designed to include an N-terminal HA-tag. pGEX6P1-GST-HA-MEK1CBM and pWZLblasti-HA-MEK1CBM (CMB: M187A/H188A/M230A/H239A), pGEX6P1-GST-HA-MEK1C121S, pWZLblasti-HA-MEK1C121S, pGEX6P1-GST-HA-MEK1M187A/H188A, and pGEX6P1-GST-HA-MEK1M230A/H239A were created by introducing mutations corresponding to the indicated amino acid changes by site-directed mutagenesis into MEK1WT from the pENTR1-MEK1WT plasmid35 followed by PCR subcloning with primers designed to include an N-terminal HA-tag. pGEX6P1-GST-HA-MEK5WT and pWZLblasti-HA-MEK5WT were created by PCR subcloning MEK5WT from the pWZLneo-Myr-Flag-MEK5 plasmid32. pGEX6P1-GST-HA-MEK5CBM-E and pWZLblasti-HA-MEK5CBM-E (CBM-E: L280A/H281A/M323A/Q332A) were created by introducing mutations corresponding to the indicated amino acid changes by site-directed mutagenesis into MEK5WT from the pWZLneo-Myr-Flag-MEK5 plasmid32 followed by PCR subcloning with primers designed to include an N-terminal HA-tag. pGEX6P1-GST-HA-ERK5K84R was created by introducing a mutation corresponding to the indicated amino acid change by site-directed mutagenesis into ERK5WT from the pWZLneo-Myr-Flag-ERK5 plasmid32 followed by PCR subcloning with primers designed to include an N-terminal HA-tag. pWZLblasti-HA-ERK5WT was created by PCR subcloning ERK5WT from the pWZLneo-Myr-Flag-ERK5 plasmid32 with primers designed to include an N-terminal HA-tag. pBabepuro-HA-MEK1-MEK5DD and pWZLblast-HA-MEK1-MEK5DD (DD: S311D/T315D) were created by introducing mutations corresponding to the indicated amino acid changes by site-directed mutagenesis into MEK5WT from the pWZLneo-Myr-Flag-MEK5 plasmid32 followed by two-step PCR to fuse MEK1 (nucleotides 1-201) to MEK5 (nucleotides 498 to 1344) in-frame with primers to include an N-terminal HA-tag. pGEX6P1-GST-HA-ERK2K54R, pWZLblasti-HA-ERK2R67S, pWZLblasti-HA-ERK2D321N, pBabepuro-HA-ERK2GOF, and pWZLblasti-HA-ERK2GOF (GOF: R67S/D321N) were created by introducing mutations corresponding to the indicated amino acid changes by site-directed mutagenesis into ERK2WT from the pDONR223-ERK2WT plasmid36 followed by PCR subcloning with primers designed to include an N-terminal HA-tag. pSUPER-retro-puro-tetO-CTR1-shRNA was created to express the human CTR1 shRNA target sequence 5’-AAAGCCCAGCTTTCTCTTTGG. pSUPER-retro-puro-tetO-Mek1-shRNA was created to express the mouse Mek1 shRNA target sequence 5’-GCCTCTCAGCTCATATGGAAT37. pCMV-HA-MEK1 encoding mutants M94A, H100A, H119A, M187A, H188A, C207A, M230A, H239A, M256A, M308A, C341A, and H358A were created by site-directed mutagenesis of MEK1WT from the pCMV-HA-MEK1WT plasmid.
Reverse transcriptase-PCR
RNA was purified from MEFs or tumor cell lines and reverse transcribed (RT) as previously described30, and then PCR amplified with the primers 5’-ATCCTCATCAGCTCCCAATG-3’ and 5’-CACATCACCATGCCACTTTC-3’ to detect human BRAF; 5’-CTGTTTTCCGGTTTGGTGAT-3’ and 5’-TGCCCAACAGTTTTGTGTGT-3’ to detect human CTR1; 5’-ATGAACCATATGGGGATGAACCATA-3’ and 5’-TCAATGGCAGTGCTCTGTGA TGTC-3’ to detect mouse Ctr1; 5’-GCACAGTCAAGGCCGAGAAT-3’ and 5’-GCCTTCTCCATGGTG GTGAA-3’ to detect mouse Gapdh; 5’-CCTTGAGGCCTTTCTTACCC-3’ and 5’-CCCACGATGTACGGAGAGTT-3’ to detect human MEK1; 5’-GTGAACTCACGTGGGGAGAT-3’ and 5’-CAGGAGGAGGAATGGGGTAT-3’ to detect mouse Mek1; 5’-CCTTGCAGAAGAAGCTGG AG-3’ and 5’-TCGGGACATGATATGCTTTG-3’ to detect human MEK1-MEK5DD; 5’-TGATCACACA GGGTTCCTGA-3’ and 5’-TGGAAAGATGGGCCTGTTAG-3’ to detect human ERK2; 5’-GAGAGAC CCTCACTGCTG-3’ and 5’-GATGGTACATGACAAGGTGC-3’ to detect human GAPDH; 5’-ACGA GCACAAGCTCACC-3’ and 5’-TTTCCACACCTGGTTGC-3’ to detect human CMYC. The fold change in the ratio of CTR1 mRNA to total GAPDH mRNA was measured in ImageJ software by boxing each band per representative image using the rectangular selection tool, and calculating the total area of the band in pixels. The total area of the CTR1 mRNA band in pixels was normalized to the total area of the total GAPDH mRNA band in pixels. The fold change is shown in figures.
Immunoblot analysis
Equal amount of lysates were isolated from the indicated cell lines after 24 hours of serum starvation and then resolved by SDS-PAGE and immunoblotted as previously described6 with one of the primary antibodies: mouse anti-MEK1, rabbit anti-ERK2, rabbit anti-MEK2, mouse anti-MEK1/2, rabbit anti-ERK1/2, rabbit anti-ERK5, rabbit anti-phospho(Ser217/221)-MEK1/2, rabbit anti-phospho(Thr202/Tyr204)-ERK1/2, rabbit anti-phospho(Thr218/Tyr220)-ERK5 (Cell Signaling Technology), mouse anti-HA (Covance), rabbit anti-CCS (Santa Cruz Biotechnology), mouse anti-β-actin (Sigma), mouse anti-MEK5 (BD Transductions Laboratories), rat anti-myelin basic protein (Millipore), or mouse anti-phospho(Thr98)-MBP (Millipore), followed by detection with one of the horseradish peroxidase conjugated secondary antibodies: goat anti-rabbit IgG, goat anti-mouse IgG (Invitrogen), goat anti-mouse light chain-specific IgG, or mouse anti-rabbit light chain specific IgG (Jackson Immuno Research Laboratories) using ECL (GE Healthcare) or SuperSignal West Femto Chemiluminescent substrate (Pierce) detection reagents. The fold change in the ratio of phosphorylated protein to total protein was measured in ImageJ software by boxing each band per representative image using the rectangular selection tool, and calculating the total area of the band in pixels. The total area of the phosphorylated protein band in pixels was normalized to the total area of the total protein band in pixels. The average fold change is shown in figures.
Immunoprecipitation
500 μg of cell lysate was incubated with 5 μl of mouse anti-HA antibody (Covance) overnight at 4 °C. The immunoprecipitates were collected with GammaBind G Sepharose beads (GE Healthcare) for 2 hours at 4 °C. SDS-PAGE analysis and immunoblot were performed as described above.
Protein purification
Recombinant GST-ERK2, GST-MEK1, GST-ERK5, and GST-MEK5 proteins were expressed from pGEX-based vectors (see plasmids above) and purified as previously described6. Recombinant MEK1WT, MEK1DD, MEK1CBM, and MEK1CBM/DD proteins were a gift from A. Stewart, E. Johnson and C. Cronin (Pfizer). Recombinant GST-MEK2 and GST-MEK5 were purchased from Abnova. Recombinant MBP was purchased from Millipore.
In vitro kinase assays
MEK1, MEK2, and MEK5 in vitro kinase assays were performed as previously described6. Briefly, 0.6 μg of recombinant GST-ERK2K54R, GST-ERK5K84R, or MBP and 1.4 μg of recombinant MEK1, GST-MEK1, 2, or 5 or mutants thereof were incubated in 180 μl of kinase buffer in the presence or absence of 2.5 molar equivalent of CuSO4, AgNO3, FeNH2SO4, NiSO4, or ZnSO4, (Fig. 1h, Extended Data Fig. 1a), a seven-fold titration of TTM (Sigma) from 0 to 50 μM (Fig. 1f), a fixed 50 μM concentration of TTM (Fig. 1j,n, 4g, Extended Data Fig. 1c), and/or a fixed concentration of 2.5 μM CuSO4 (Fig. 1n, Extended Data Fig. 1c) at 22°C for 30 minutes.
In vitro and in vivo copper binding
1 μg of recombinant GST-MEK1, GST-MEK2, GST-MEK5 proteins or mutants thereof were incubated in 500 μl of RIPA containing 30 μl Cu-pentadentate resin (Affiland) or 30 μl of free pentadentate resin (Affiland) for 2 hours at 4°C. SDS-PAGE analysis and immunoblot were performed as described above. In vivo Cu binding was performed as described previously6.
Metal catalyzed oxidation, mass spectrometry and data analysis
GST-MEK1 was loaded with cupric Cu using a CuSO4-histidine complex as described previously6. Metal catalyzed oxidation (MCO) reactions were performed as described previously28. Briefly, MCO reactions were performed at 37 °C in 50 mM HEPES pH 8.0, 150 mM NaCl containing 40 μM GST-MEK1, 100 mM ascorbate and 1 mM H2O2. Untreated MEK1 was included as the control. The reactions were stopped by precipitating the proteins in methanol/chloroform followed by reduction with 2.5 mM DTT at 37 °C for 30 minutes and alkylation with 20 mM iodoacetamide in the dark at room temperature for 30 minutes38,39. In-solution digestion was performed overnight at 37 °C with trypsin (1:40 enzyme:protein ratio; modified, sequencing grade, Promega), which hydrolyzes peptide bonds at the carboxyl end of lysine and arginine, or chymotrypsin (1:60 enzyme:protein ratio, Sigma), which hydrolyzes peptide bonds at the carboxyl end of aromatic or large hydrophobic side chains of tyrosine, tryptophan, phenylalanine, methionine and leucine. The digested peptide samples were desalted with stage tips40 and lyophilized with a SpeedVac. Liquid chromatography-tandem mass spectrometry (LC-MS/MS) analyses were performed on a Thermo Scientific LTQ Orbitrap XL mass spectrometer (Thermo Scientific) with a Finnigan Nanospray II electrospray ionization source. Digested peptides were injected onto a 75 μm × 150 mm BEH C18 column (particle size 1.7 μm, Waters) and separated using a Waters nanoACQUITY Ultra Performance LC™ (UPLC™) System (Waters). The LTQ Orbitrap XL was operated in the data-dependent mode using the TOP10 strategy as previously described41. In brief, each scan cycle was initiated with a full MS scan of high mass accuracy [375–1,800 m/z; acquired in the Orbitrap XL at 6 × 10⁴ resolution setting and automatic gain control (AGC) target of 106], which was followed by MS/MS scans (AGC target 5,000; threshold 3,000) in the linear ion trap on the 10 most abundant precursor ions. Selected ions were dynamically excluded for 30 seconds. Singly charged ions were excluded from MS/MS analysis. MS/MS spectra were searched by using the SEQUEST algorithm against the human MEK1 sequence. Search parameters allowed for two missed tryptic cleavages, a mass tolerance of ± 80 ppm, a static modification of 57.02146 Daltons (carboxyamidomethylation) on cysteine, and dynamic modifications of 15.99491 Dalton (oxidation) on methionine or histidine. The MS/MS spectra of matched peptides were validated manually. Modeling of the distance between the thiol groups of methionines or imidazole groups of histidines was performed using the three-dimensional structure of MEK1 in complex with magnesium and ATP-γS determined at 2.1 Å (PDB ID: 3EQD)13.
Circular dichroism spectroscopy
Circular dichroism data were collected on a JASCO J-815 CD spectrometer with a JASCO Peltier device and water bath to control the temperature. Experiments were performed in a 1-mm cuvette at a protein concentration of 5 μM in 20 mM Tris (pH 8.0) and 100 mM NaCl. Far UV scans were collected from 200 nm to 250 nm. Thermal denaturation of MEK1 and MEK1CBM proteins monitored at a 222 nm to estimate the protein melting temperature. The temperature ramp rate was 1 °C/minute and data points were collected every 1 °C. All data are reported in units of mean residue ellipticity, which was calculated as follows: , where θraw is the ellipticity in degrees, MRW is , c is the protein concentration in g/ml, and l is the pathlength of the cuvette in cm, as previously described26.
Differential scanning fluorimetry
Differential scanning fluorimetry data were collected on a CFX384 Touch™ Real-Time PCR Dectection System (Bio-Rad) at a protein concentration of 1.3 μM in 25 mM Tris-HCl (pH 7.5), 20 mM MgCl2, and 2 mM DTT using SYPRO orange as previously described27. The Tm was calculated by determining the maximum of the first derivative curve of normalized data in Prism 5 (GraphPad) as previously described27.
Mouse xenografts, drug treatments, and diet alteration
5 × 10⁶ MEFs or 107 melanoma cells resuspended in phosphate buffer saline were injected subcutaneously into flanks of SCID/beige mice (Charles River Laboratory) as previously described42. Drug treatments were as follows: vehicle [1% methylcellulose (Sigma), 1% dimethyl sulfoxide (DMSO, Sigma)], 2.0 mg tetrathiomolybdate (TTM, Sigma) in vehicle, or 20 mg/kg vemurafenib (Chemietek) in vehicle every other day (q.o.d) via oral gavage. Mice were fed a normal diet (PMI 5053 Picolab Mouse Diet 20, LabDiet) or where indicated, a Cu-deficient diet (CuD diet, TD.80388, Harlan Teklad). Mice fed a CuD diet mice were administered deionized H2O (diH2O) supplemented with 20 mg/L CuSO4, diH2O alone, or diH2O supplemented with 3 g/L trientine dihydrocholoride (Sigma). All studies were approved by the Duke University Institutional Animal Care and Use Committee. Statistical analysis of tumor volumes at end point was performed using a one-tailed, unpaired T-test, with a 95% confidence interval for two group datasets or one-way analysis of variance (ANOVA) with a 95%, 99%, or 99.9% confidence interval and Tukey’s multiple comparison post test for ≥ 3 datasets in Prism 5 (GraphPad). Statistical analysis of percentage of mice with tumors ≥ 1.0 cm3 versus time (days) was analyzed using a survival curve log-rank (mantel-cox) test in Prism5 (GraphPad).
Mouse lung cancer model
Ctr1flox/flox mice22 were interbred with BrafCA/+; Trp53flox/flox (BP) mice23, a generous gift of D.G. Kirsch (Duke University), for three generations to generate BrafCA/+; Trp53flox/flox; Ctr1+/+ and BrafCA/+; Trp53flox/flox; Ctr1flox/flox mice. PCR was performed to detect wild-type, conditional, and recombined alleles of Braf, Ctr1, and Trp53, as previously described22,23. Cohorts of these animals were administered 6 × 10⁶ pfu adenoviral Cre (University of Iowa) intranasally between 69 and 85 days of age. Mice were then monitored and euthanized three months later or at moribundity endpoints. All studies were approved by the Duke University Institutional Animal Care and Use Committee. Statistical analysis of percent survival versus time (days) was conducted using a survival curve log-rank (mantel-cox) test in Prism 5 (GraphPad).
Analysis of lung tumors
To quantitate the number of visible surface tumors per mouse, lungs were resected from five Ctr1+/+ and five Ctr1flox/flox BP mice 3 months after Ad-Cre treatment and the number of tumors visible on the surface of lungs were counted. Statistical analysis of the average number of tumors per mouse was performed using a one-tailed, unpaired T-test, with a 95% confidence interval for two group datasets. To quantitate the percent of abnormal lung tissue, lungs were resected from five Ctr1+/+ and five Ctr1flox/flox BP mice 3 months after Ad-Cre treatment, fixed in 10% formalin, and paraffin embedded. Sections were deparaffinized, rehydrated, and subjected to epitope retrieval before staining with Hematoxylin (Surgipath) and Eosin (Fisher Scientific). Photographs were taken at low power on an Olympus Vanox S microscope to encompass the entire lung, images were blinded, and then the abnormal areas of adenoma and adenocarcinoma from each micrograph were circumscribed using Adobe Photoshop and the abnormal area in pixels was expressed as a percentage of the total lung area from all micrographs. Statistical analysis of the average percent of abnormal tissue per mouse was performed using a one-tailed, unpaired T-test, with a 95% confidence interval for two group datasets.
Immunohistochemistry
Three xenograft tumors from mice injected with BRAFV600E-transformed and SV40-immortalized Ctr1+/+ MEFs or lungs resected at moribundity endpoint from Ctr1+/+ and Ctr1flox/flox BP mice treated with Ad-Cre were fixed in 10% formalin and paraffin embedded. Sections were deparaffinized, rehydrated, and subjected to epitope retrieval and stained with an anti-P-ERK1/2 (Thr202/Tyr204) antibody (Cell Signaling), followed by peroxidase-based detection with Vectastain Elite ABC Kits (Vector Labs) and counterstaining with Hematoxylin. Photographs were taken of high-power fields of highest positivity (P-ERK IHC) on an Olympus Vanox S microscope. Images were blinded and tumors were circumscribed in P-ERK1/2-stained tissue images using the freehand selection tool in Image J, and the total area of the tumor in pixels was recorded. Tumor images were copied and pasted to new, blank images and color thresholding was applied to determine positive-staining areas using the same parameters for each tumor image. Areas staining positive by these parameters were selected and the positive-staining area in pixels was recorded. Percent positive-staining area was calculated by dividing the positive-staining area of the tumor in pixels by the total area of the tumor in pixels. Statistical significance was determined using unpaired, one-tailed t-tests between treated and untreated, or between Ctr1+/+ and Ctr1flox/flox cohorts using Prism 5 (GraphPad).
Cell growth and soft agar assays
For growth curve experiments, cells were plated at a density of 5,000 cells/well in six replicate wells in four 24-well plates. At days 0, 1, 2, and 3 one plate was fixed for five minutes in formalin, washed with PBS and stained for 30 minutes with 0.1% crystal violet (Sigma) and allowed to dry for at least 24 hours. Stain was extracted in 200 μl of 10% acetic acid in each well, transferred to 96-well plate, and absorbance at 600 nm was measured using a GloMax Multi Detection System plate reader (Promega). Relative growth was determined by normalization to the signal at day 0 and plotted in Prism 5 (GraphPad). Anchorage-independent growth was assayed in 6-well plates with 1 ml of 0.6% bactoagar media solution (final concentration 1x DMEM, 10% FBS, 1x Penicillin/Streptomycin) as a bottom support layer. 5 × 10⁴ cells per well were resuspended in DMEM (10% FBS, 1x Penicillin/Streptomycin) and mixed 1:1 with 0.6% bactoagar media solution with an appropriate concentration of DMSO or TTM to give a final bactoagar concentration of 0.3%, 100 nM TTM, 400 nM of TTM, or an equivalent amount of DMSO and plated in triplicate. Each well was fed on days 3, 7, 14, and 21 with 300 μl of DMEM with the appropriate concentration of DMSO or TTM. Colonies were counted between days 21 and 28. Statistical analysis of soft agar growth was performed using a two-way ANOVA with a 99.9% confidence interval and Tukey’s multiple comparison post test in Prism 5 (GraphPad).
EXTENDED DATA
Extended Data Figure 1. CuSO4 stimulates MEK1/2 kinase activity in vitro.

Detection of the amount of in vitro phosphorylated (P) recombinant GST-tagged kinase-inactive ERK2K54R protein by a, recombinant GST-tagged MEK1 in the presence, when indicated, of 2.5 molar equivalents of CuSO4 (Cu), AgNO3 (Ag), FeNH2SO4 (Fe), NiSO4 (Ni) or ZnSO4 (Zn) or c, recombinant GST-tagged MEK2 in the presence, when indicated, of 2.5 μM CuSO4 and/or 50 μM TTM. Total (T) levels of ERK2, MEK1 and MEK2 serve as loading controls. b, Immunoblot detection of the amount of recombinant GST-tagged MEK2 protein bound to a resin charged with (Cu) or without (-) Cu. Input serves as a loading control. Gel images are representative of two replicates.
Extended Data Figure 2. Genetic ablation of Ctr1 decreases BRAFV600E-mediated cell growth and tumorigenesis.

a, Cell growth, as measured by crystal violet staining, of BRAFV600E-transformed, immortalized Ctr1+/+ (black circle) or Ctr1-/- (red square) MEFs (plated in sextuplicate) over a period of three days. Representative of three experiments. b, Representative resected tumors (scale bar = 1 cm) at 20 days post injection and c, Kaplan-Meier analysis of percentage of mice with tumor volume ≥ 1.0 cm3 versus time (days) of mice (n=8) injected with BRAFV600E-transformed, immortalized Ctr1+/+ (black line) or Ctr1-/- (red line) MEFs. ****P<0.0001.
Extended Data Figure 3. Identification of Cu-binding mutants of MEK1 that reduce ERK1/2 phosphorylation.
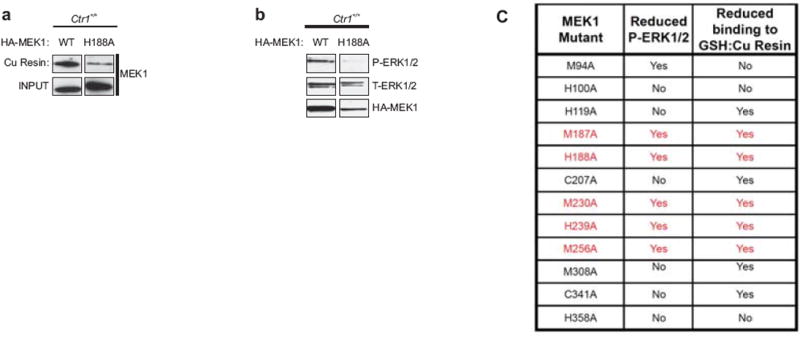
a, Immunoblot detection of the amount of HA-tagged wild-type (WT) MEK1 and an example of one MEK1 mutant tested (H188A) that bound to a Cu-charged resin. Input serves as a loading control. b, Immunoblot detection of the amount of phosphorylated (P) and/or total (T) ERK1/2 or HA-MEK1 protein in immortalized Ctr1+/+ MEFs stably expressing HA-tagged wild-type (WT) MEK1 or an example of one MEK1 mutant tested (H188A). c, Summary of whether the indicated MEK1 point mutants did (YES) or did not (NO) exhibit a reduction in binding to the Cu-charged resin or show a reduction in the levels of phosphorylated (P) ERK1/2 when stably expressed in immortalized Ctr1+/+ MEFs. Gel images are representative of two replicates.
Extended Data Figure 4. Amino acids in MEK1 identified to be oxidized by the MCO reaction followed by MS/MS.
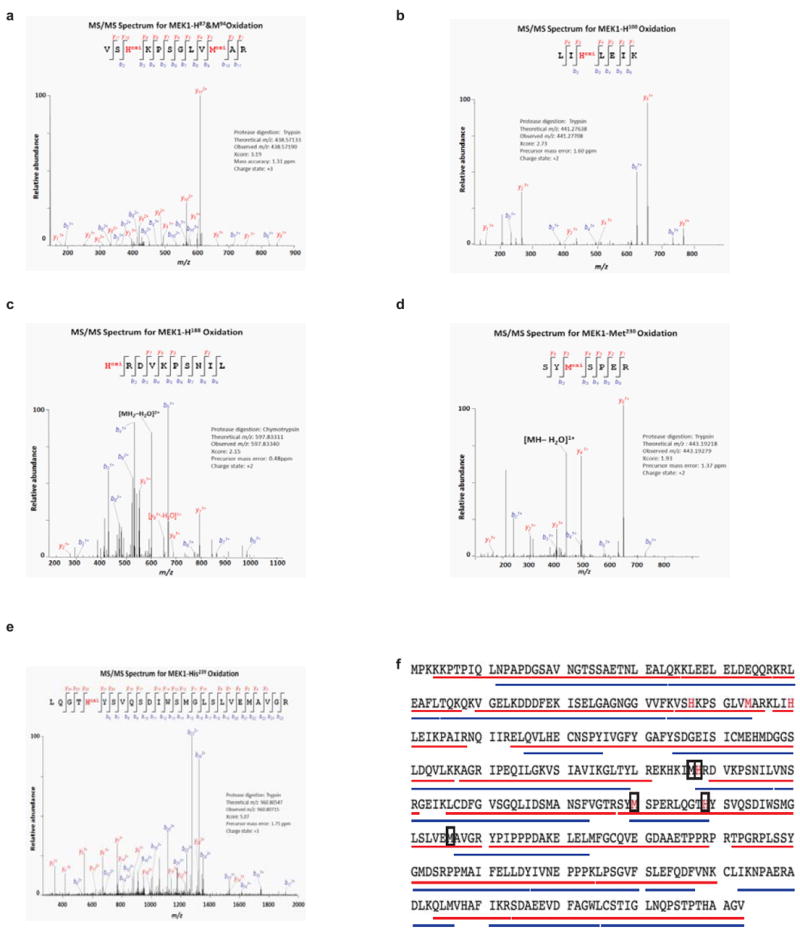
Representative annotated MS/MS fragmentation spectra for five indicated MEK1-derived peptides containing oxidized residues a, MEK1H87 and MEK1M94 b, MEK1H100 c,MEK1H188 d, MEK1M230 and e, MEK1H239 highlighted in red. The peak heights are the relative abundances of the corresponding fragmentation ions, with the annotation of the identified matched amino terminus-containing ions (b ions) in blue and the carboxyl terminus-containing ions (y ions) in red. For clarity, only the major identified peaks are labeled. f, Amino acid sequence of human MEK1 with the peptides identified by MS/MS underlined (red: trypsin digest and blue: chymotrypsin digest). Amino acids oxidized only in the presence of H2O2 in one to three independent MCO reactions are denoted in red. Amino acids, that when mutated to alanine reduced both binding of MEK1 to a Cu-charged resin and phosphorylation of cellular ERK2, are boxed (from Extended Data Fig. 3c).
Extended Data Figure 5. Alignment of the amino acid sequence of MEK1, MEK2, MEK5, and MEK1-MEK5.
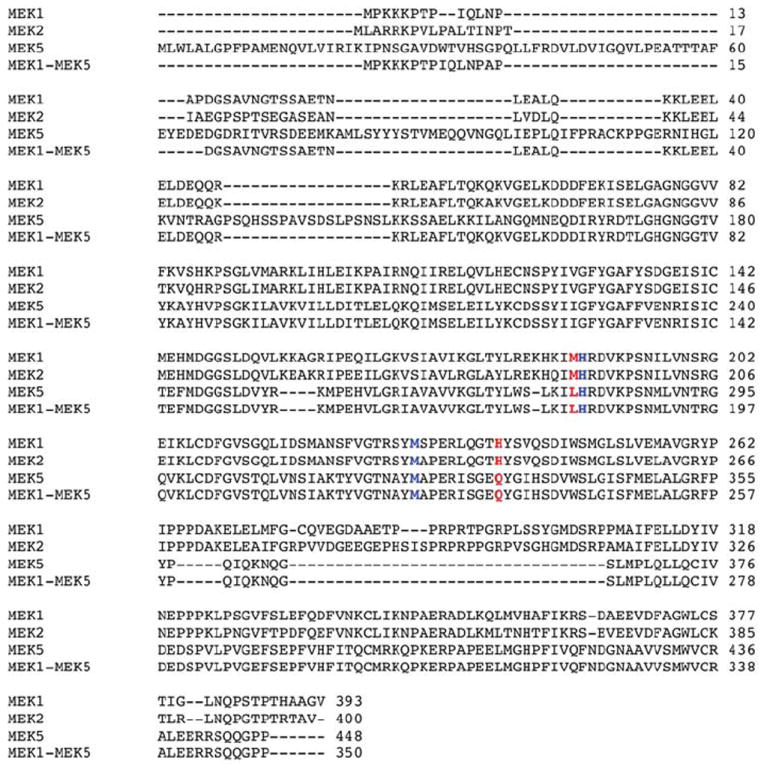
The amino acid sequence of human MEK1, MEK2, MEK5, and the MEK1-MEK5 chimeric protein (without the DD mutation) aligned using Clustal W. Black letters: amino acids. Colored letters: the four amino acids mutated in MEK1CBM to reduce Cu-binding (blue: conserved between MEK1, MEK2 and MEK5, red: conserved only between MEK1 and MEK2). Dashes (-): gaps in the alignment.
Extended Data Figure 6. Protein purification and biochemical analysis of wild-type and CBM versions of MEK1.
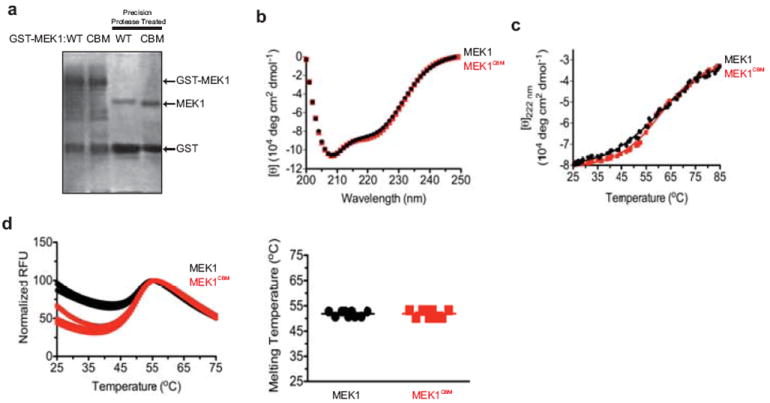
a, Coomassie Brilliant Blue detection of the amount of wild-type (WT) or CBM mutant (CBM) purified recombinant GST-tagged MEK1 protein in the absence or presence of precision protease for cleavage of GST. b, Circular dichroism spectra at increasing wavelengths (nm) c, thermal denaturation monitored at 222 nm at increasing temperature (°C) and d, differential scanning fluorimetry at increasing temperature (°C, left) and the average estimated melting temperature (right) of purified recombinant MEK1WT (black cirlce, line,) and MEK1CBM (red square, line). Data are representative of two replicates.
Extended Data Figure 7. Tumorigenic growth of NRAS mutation-positive human melanoma cancer cell lines upon knockdown of CTR1.

a, RT-PCR detection of the amount of endogenous CTR1 and GAPDH mRNA and b, mean tumor volume (cm3) ± s.e.m. versus time (days) in mice (n=3) injected with the NRAS mutation-positive (NRASQ61L) human melanoma cell lines DM598 and DM792 stably infected with a retrovirus expressing either a scramble (SCRAM) shRNA (black circle) or CTR1 shRNA (red square). ****P<0.0001.
Extended Data Figure 8. Detection of Cre-mediated recombination and weight measurements of AdCre-treated Ctr1+/+ versus Ctr1flox/flox BP mice.

a, PCR detection of BRafCA/+,Trp53flox/flox, and Ctr1flox/flox recombinated alleles from matched tail samples (T) and lung tumor cell lines (C) generated from indicated genotypes. Alleles are indicated by: WT (black), flox (red), null (blue), BrafCA (orange) or BrafV600E (green) arrowheads. b, Box and whiskers plot of weight (grams) of Ctr1+/+ versus Ctr1flox/flox BP mice (n=30) one month after intranasal AdCre treatment. ****P<0.0001.
Extended Data Figure 9. TTM does not reduce the weight of mice with tumors.
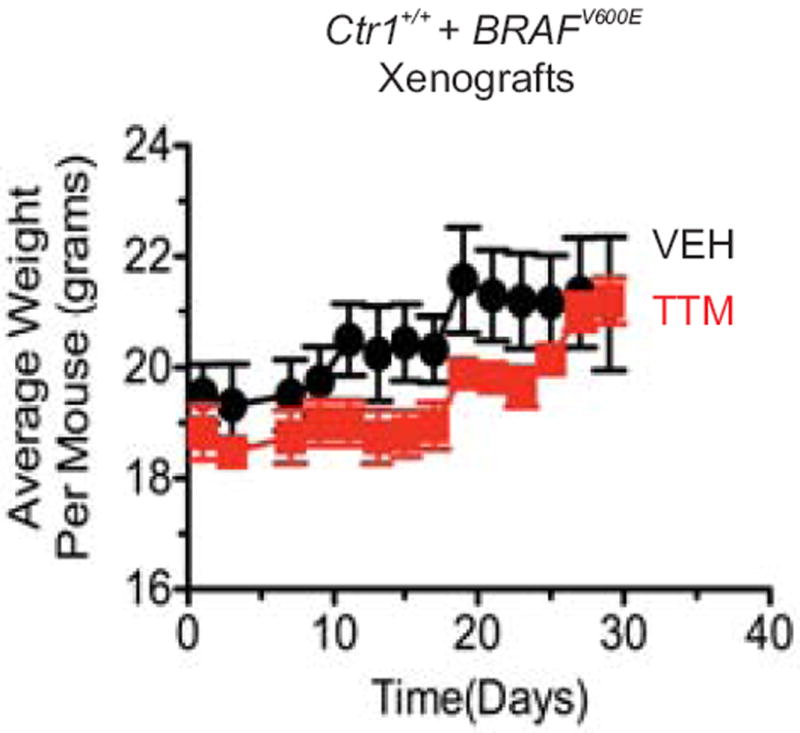
Mean weight ± s.e.m. over time (days) of mice (n=4) injected with BRAFV600E-transformed, immortalized MEFs and treated with vehicle (black circle) or TTM (red square).
Extended Data Figure 10. Graphical representation of Cu regulation of BRAFV600E-mediated signaling and tumorigenesis.
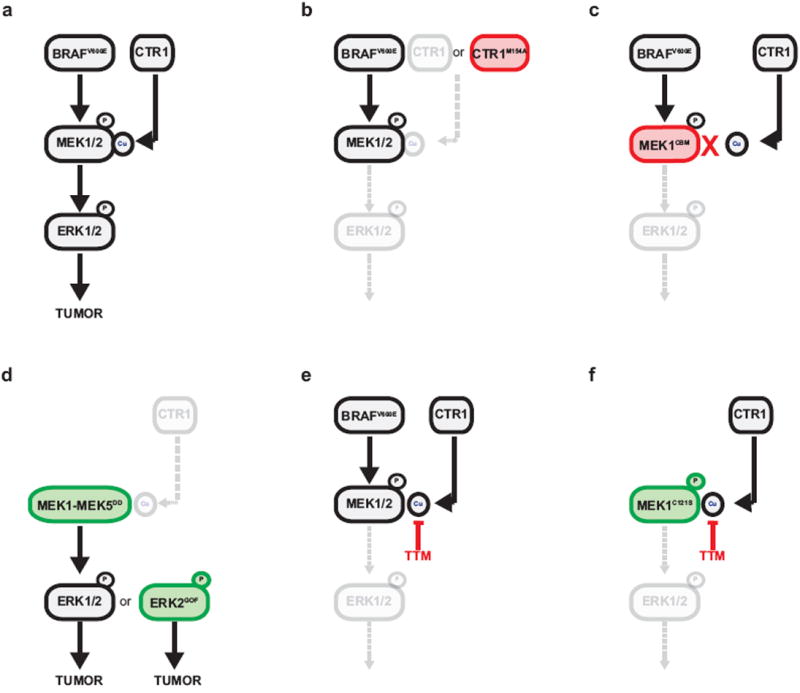
Inactivation of the signaling pathway is denoted in grey and dashed lines, gain of function mutations are denoted in green and loss of function mutations are denoted in red.
Acknowledgments
We thank M. McMahon (University of California at San Francisco), C. Cronin, E. Johnson, A. Stewart (Pfizer), D.S. Tyler, and D.G. Kirsch (Duke University) for reagents, C. Cronin, L.E. Crose, A.M. Jaeger, M.A. Luftig, E. Johnson, D.F. Kashatus, B.L. Lampson, J.P. Madigan, N.I. Nicely, Y. Nose, C.W. Pemble, N.L.K. Pershing, A. Stewart, and J.D. Weyandt (Duke University) for technical support, discussions, and/or review of the manuscript. This work was supported by NIH grants CA178145 (D.C.B.), HL075443 (Proteomic Core K.X.), DK074192 (D.J.T), CA094184, and CA172104 (C.M.C), the Structural Genomics Consortium (Welcome Trust 092809/Z/10/Z), FP7 grant 278568 “PRIMES” (S.K and A.C.), the Stewart Trust (C.M.C), the Edward Spiegel Fund of the Lymphoma Foundation (C.M.C.), and donations made in memory of Linda Woolfenden (C.M.C.).
Footnotes
Author contributions Experiments were carried out by D.C.B., M.S.C., M.L.T., G.A.H., X.Y., and K.X., all authors contributed to the study design. The manuscript was written by D.C.B. and C.M.C. with contributions by all authors.
Competing financial interest A provisional patent application (D.C.B., M.L.T., D.J.T., and C.M.C.) has been filed regarding the use of Cu chelators for the treatment of BRAF and RAS mutation-positive cancers.
The authors declare no competing financial interests.
References
- 1.Davies H, et al. Mutations of the BRAF gene in human cancer. Nature. 2002;417:949–954. doi: 10.1038/nature00766. [DOI] [PubMed] [Google Scholar]
- 2.Forbes SA, et al. COSMIC: mining complete cancer genomes in the Catalogue of Somatic Mutations in Cancer. Nucleic Acids Res. 2011;39:D945–950. doi: 10.1093/nar/gkq929. [DOI] [PMC free article] [PubMed] [Google Scholar]
- 3.Wan PT, et al. Mechanism of activation of the RAF-ERK signaling pathway by oncogenic mutations of B-RAF. Cell. 2004;116:855–867. doi: 10.1016/s0092-8674(04)00215-6. [DOI] [PubMed] [Google Scholar]
- 4.Flaherty KT, et al. Improved survival with MEK inhibition in BRAF-mutated melanoma. N Engl J Med. 2012;367:107–114. doi: 10.1056/NEJMoa1203421. [DOI] [PubMed] [Google Scholar]
- 5.Flaherty KT, et al. Combined BRAF and MEK inhibition in melanoma with BRAF V600 mutations. N Engl J Med. 2012;367:1694–1703. doi: 10.1056/NEJMoa1210093. [DOI] [PMC free article] [PubMed] [Google Scholar]
- 6.Turski ML, et al. A novel role for copper in Ras/mitogen-activated protein kinase signaling. Mol Cell Biol. 2012;32:1284–1295. doi: 10.1128/MCB.05722-11. [DOI] [PMC free article] [PubMed] [Google Scholar]
- 7.Ala A, Walker AP, Ashkan K, Dooley JS, Schilsky ML. Wilson’s disease. Lancet. 2007;369:397–408. doi: 10.1016/S0140-6736(07)60196-2. [DOI] [PubMed] [Google Scholar]
- 8.Solit DB, et al. BRAF mutation predicts sensitivity to MEK inhibition. Nature. 2006;439:358–362. doi: 10.1038/nature04304. [DOI] [PMC free article] [PubMed] [Google Scholar]
- 9.Lee J, Petris MJ, Thiele DJ. Characterization of mouse embryonic cells deficient in the ctr1 high affinity copper transporter. Identification of a Ctr1-independent copper transport system. J Biol Chem. 2002;277:40253–40259. doi: 10.1074/jbc.M208002200. [DOI] [PubMed] [Google Scholar]
- 10.Bertinato J, L’Abbe MR. Copper modulates the degradation of copper chaperone for Cu, Zn superoxide dismutase by the 26 S proteosome. J Biol Chem. 2003;278:35071–35078. doi: 10.1074/jbc.M302242200. [DOI] [PubMed] [Google Scholar]
- 11.Puig S, Lee J, Lau M, Thiele DJ. Biochemical and genetic analyses of yeast and human high affinity copper transporters suggest a conserved mechanism for copper uptake. J Biol Chem. 2002;277:26021–26030. doi: 10.1074/jbc.M202547200. [DOI] [PubMed] [Google Scholar]
- 12.Bridgewater JD, Lim J, Vachet RW. Using metal-catalyzed oxidation reactions and mass spectrometry to identify amino acid residues within 10 A of the metal in Cu-binding proteins. J Am Soc Mass Spectrom. 2006;17:1552–1559. doi: 10.1016/j.jasms.2006.06.003. [DOI] [PubMed] [Google Scholar]
- 13.Fischmann TO, et al. Crystal structures of MEK1 binary and ternary complexes with nucleotides and inhibitors. Biochemistry. 2009;48:2661–2674. doi: 10.1021/bi801898e. [DOI] [PubMed] [Google Scholar]
- 14.Huang W, Kessler DS, Erikson RL. Biochemical and biological analysis of Mek1 phosphorylation site mutants. Mol Biol Cell. 1995;6:237–245. doi: 10.1091/mbc.6.3.237. [DOI] [PMC free article] [PubMed] [Google Scholar]
- 15.Nakamura K, Uhlik MT, Johnson NL, Hahn KM, Johnson GL. PB1 domain-dependent signaling complex is required for extracellular signal-regulated kinase 5 activation. Mol Cell Biol. 2006;26:2065–2079. doi: 10.1128/MCB.26.6.2065-2079.2006. [DOI] [PMC free article] [PubMed] [Google Scholar]
- 16.English JM, et al. Contribution of the ERK5/MEK5 pathway to Ras/Raf signaling and growth control. J Biol Chem. 1999;274:31588–31592. doi: 10.1074/jbc.274.44.31588. [DOI] [PubMed] [Google Scholar]
- 17.Roberts PJ, Der CJ. Targeting the Raf-MEK-ERK mitogen-activated protein kinase cascade for the treatment of cancer. Oncogene. 2007;26:3291–3310. doi: 10.1038/sj.onc.1210422. [DOI] [PubMed] [Google Scholar]
- 18.Levin-Salomon V, Kogan K, Ahn NG, Livnah O, Engelberg D. Isolation of intrinsically active (MEK-independent) variants of the ERK family of mitogen-activated protein (MAP) kinases. J Biol Chem. 2008;283:34500–34510. doi: 10.1074/jbc.M806443200. [DOI] [PMC free article] [PubMed] [Google Scholar]
- 19.Chu Y, Solski PA, Khosravi-Far R, Der CJ, Kelly K. The mitogen-activated protein kinase phosphatases PAC1, MKP-1, and MKP-2 have unique substrate specificities and reduced activity in vivo toward the ERK2 sevenmaker mutation. J Biol Chem. 1996;271:6497–6501. doi: 10.1074/jbc.271.11.6497. [DOI] [PubMed] [Google Scholar]
- 20.Turski ML, Thiele DJ. New roles for copper metabolism in cell proliferation, signaling, and disease. J Biol Chem. 2009;284:717–721. doi: 10.1074/jbc.R800055200. [DOI] [PMC free article] [PubMed] [Google Scholar]
- 21.Tsai CY, Finley JC, Ali SS, Patel HH, Howell SB. Copper influx transporter 1 is required for FGF, PDGF and EGF-induced MAPK signaling. Biochem Pharmacol. 2012;84:1007–1013. doi: 10.1016/j.bcp.2012.07.014. [DOI] [PMC free article] [PubMed] [Google Scholar]
- 22.Nose Y, Kim BE, Thiele DJ. Ctr1 drives intestinal copper absorption and is essential for growth, iron metabolism, and neonatal cardiac function. Cell Metab. 2006;4:235–244. doi: 10.1016/j.cmet.2006.08.009. [DOI] [PubMed] [Google Scholar]
- 23.Dankort D, et al. A new mouse model to explore the initiation, progression, and therapy of BRAFV600E-induced lung tumors. Genes Dev. 2007;21:379–384. doi: 10.1101/gad.1516407. [DOI] [PMC free article] [PubMed] [Google Scholar]
- 24.Solit DB, Rosen N. Resistance to BRAF inhibition in melanomas. N Engl J Med. 2011;364:772–774. doi: 10.1056/NEJMcibr1013704. [DOI] [PubMed] [Google Scholar]
- 25.Wagle N, et al. Dissecting therapeutic resistance to RAF inhibition in melanoma by tumor genomic profiling. J Clin Oncol. 2011;29:3085–3096. doi: 10.1200/JCO.2010.33.2312. [DOI] [PMC free article] [PubMed] [Google Scholar]
- 26.Kelly SM, Jess TJ, Price NC. How to study proteins by circular dichroism. Biochim Biophys Acta. 2005;1751:119–139. doi: 10.1016/j.bbapap.2005.06.005. [DOI] [PubMed] [Google Scholar]
- 27.Niesen FH, Berglund H, Vedadi M. The use of differential scanning fluorimetry to detect ligand interactions that promote protein stability. Nat Protoc. 2007;2:2212–2221. doi: 10.1038/nprot.2007.321. [DOI] [PubMed] [Google Scholar]
- 28.Bridgewater JD, Vachet RW. Metal-catalyzed oxidation reactions and mass spectrometry: the roles of ascorbate and different oxidizing agents in determining Cu-protein-binding sites. Anal Biochem. 2005;341:122–130. doi: 10.1016/j.ab.2005.02.034. [DOI] [PubMed] [Google Scholar]
- 29.Augustine CK, et al. Sorafenib, a multikinase inhibitor, enhances the response of melanoma to regional chemotherapy. Mol Cancer Ther. 2010;9:2090–2101. doi: 10.1158/1535-7163.MCT-10-0073. [DOI] [PubMed] [Google Scholar]
- 30.Lampson BL, et al. Targeting eNOS in pancreatic cancer. Cancer Res. 2012;72:4472–4482. doi: 10.1158/0008-5472.CAN-12-0057. [DOI] [PMC free article] [PubMed] [Google Scholar]
- 31.O’Hayer KM, Counter CM. A genetically defined normal human somatic cell system to study ras oncogenesis in vivo and in vitro. Methods Enzymol. 2006;407:637–647. doi: 10.1016/S0076-6879(05)07050-3. [DOI] [PubMed] [Google Scholar]
- 32.Boehm JS, et al. Integrative genomic approaches identify IKBKE as a breast cancer oncogene. Cell. 2007;129:1065–1079. doi: 10.1016/j.cell.2007.03.052. [DOI] [PubMed] [Google Scholar]
- 33.O’Hayer KM, Brady DC, Counter CM. ELR+ CXC chemokines and oncogenic Ras-mediated tumorigenesis. Carcinogenesis. 2009;30:1841–1847. doi: 10.1093/carcin/bgp198. [DOI] [PMC free article] [PubMed] [Google Scholar]
- 34.Zipfel PA, et al. Ral activation promotes melanomagenesis. Oncogene. 2010;29:4859–4864. doi: 10.1038/onc.2010.224. [DOI] [PMC free article] [PubMed] [Google Scholar]
- 35.Scholl FA, Dumesic PA, Khavari PA. Mek1 alters epidermal growth and differentiation. Cancer Res. 2004;64:6035–6040. doi: 10.1158/0008-5472.CAN-04-0017. [DOI] [PubMed] [Google Scholar]
- 36.Johannessen CM, et al. COT drives resistance to RAF inhibition through MAP kinase pathway reactivation. Nature. 2010;468:968–972. doi: 10.1038/nature09627. [DOI] [PMC free article] [PubMed] [Google Scholar]
- 37.Bric A, et al. Functional identification of tumor-suppressor genes through an in vivo RNA interference screen in a mouse lymphoma model. Cancer Cell. 2009;16:324–335. doi: 10.1016/j.ccr.2009.08.015. [DOI] [PMC free article] [PubMed] [Google Scholar]
- 38.Kahsai AW, et al. Multiple ligand-specific conformations of the beta2-adrenergic receptor. Nat Chem Biol. 2011;7:692–700. doi: 10.1038/nchembio.634. [DOI] [PMC free article] [PubMed] [Google Scholar]
- 39.Nobles KN, et al. Distinct phosphorylation sites on the beta(2)-adrenergic receptor establish a barcode that encodes differential functions of beta-arrestin. Sci Signal. 2011;4:ra51. doi: 10.1126/scisignal.2001707. [DOI] [PMC free article] [PubMed] [Google Scholar]
- 40.Rappsilber J, Ishihama Y, Mann M. Stop and go extraction tips for matrix-assisted laser desorption/ionization, nanoelectrospray, and LC/MS sample pretreatment in proteomics. Anal Chem. 2003;75:663–670. doi: 10.1021/ac026117i. [DOI] [PubMed] [Google Scholar]
- 41.Haas W, et al. Optimization and use of peptide mass measurement accuracy in shotgun proteomics. Mol Cell Proteomics. 2006;5:1326–1337. doi: 10.1074/mcp.M500339-MCP200. [DOI] [PubMed] [Google Scholar]
- 42.Hamad NM, et al. Distinct requirements for Ras oncogenesis in human versus mouse cells. Genes Dev. 2002;16:2045–2057. doi: 10.1101/gad.993902. [DOI] [PMC free article] [PubMed] [Google Scholar]


