

Abstract
A sensitive and specific assay method for the simultaneous quantitation of 17α-hydroxyprogesterone caproate (17-OHPC), 17α-hydroxyprogesterone (17-OHP), and progesterone (P) in human plasma using high performance liquid chromatography and tandem mass spectrometry (LC-MS/MS) was developed and validated. Plasma samples were processed by a solid phase extraction (SPE) procedure using Oasis HLB extraction cartridge prior to chromatography. Medroxyprogestrone acetate (MPA) was used as the internal standard. The compounds were separated using Waters C18 Symmetry analytical column (3.5 μm, 2.1 × 50 mm) using a gradient elusion with a mobile phase consisting of 5% methanol in water [A] and methanol [B], with 0.01% ammonium hydroxide being added to both [A] and [B], at a flow rate 0.3 ml/min. The retention times for 17-OHPC, 17-OHP, P and MPA were 4.5, 1.5, 2.5 and 2.2 min respectively, with a total run time of 7 min. The analytes were detected Micromass Quattro Micro triple quadrupole mass spectrometer in positive electron spray ionization (ESI) mode using multiple reaction monitoring (MRM). The extracted ions monitored following MRM transitions were m/z 429.10→313.10 for 17-OHPC, m/z 331.17→97.00 for 17-OHP, m/z 315.15→109.00 for P and m/z 387.15→327.25 for MPA (IS). The assay was linear over the range 1 – 200 ng/ml for 17-OHPC and 17-OHP, and 2 – 400 ng/ml for P, when 0.4 ml of plasma was used in the extraction. The overall intra- and inter-day assay variation was <15%. No significant variation in the concentration of 17-OHPC, 17-OHP or P was observed with different sample processing and / or storage conditions. This method is simple, allows easy accurate and reproducible measurement of 17-OHPC, 17-OHP and P simultaneously in human plasma, and is used to evaluate the pharmacokinetics of 17-OHPC in pregnant subjects.
Keywords: 17-OHPC, 17-OHP, P, MPA, liquid chromatography-mass spectrometry, Pregnancy
1. Introduction
Preterm delivery is a major determinant of infant mortality in developed countries [1]. Preterm delivery is more common in the United States than in many other developed countries and is the major factor responsible for the relatively high infant mortality in the United States [2].
17α-hydroxyprogesterone caproate (17-OHPC) has recently been suggested to be beneficial in preventing preterm labor in women with a prior preterm birth [3–5]. 17-OHPC is a synthetic hormone, which is administered intramuscularly once a week at a dose of 250 mg from weeks 16–20 and continued until 37 weeks in women with a history of prior preterm birth. The dose used currently is based on empiric observations [6]. There are no pharmacokinetic data of 17-OHPC in pregnant subjects. The only pharmacokinetic study, which measured 17-OHPC drug concentrations in a group of non-pregnant women, used a non-specific immunoassay methodology [7]. Since the pharmacokinetics of 17-OHPC has not been evaluated in pregnant subjects, it was necessary to develop a sensitive and specific assay method to 17-OHPC in plasma samples.
In clinical practice, the most common methods for quantification of steroid utilize immunoassays such as radioimmunoassay (RIA), since it is simple to perform, has acceptable turnaround time and is relatively inexpensive. However, the main disadvantage of immunoassay techniques is the cross reactivity of the antibodies used with other steroids, which result in falsely elevated levels [8]. For example progesterone (P) assay is affected by up to 10% cross reactivity from different steroids including 5α-pregnane-3,20-dione, 11-deoxycorticosterone or 17α-hydroxyprogesterone (17-OHP) [9]. To overcome these issues, there has been increased interest in using LC-MS/MS for the quantization of steroids. This analytical method is preferred because of its accuracy, sensitivity, faster turn around time and ability to evaluate multiple components in the same run. Several chromatographic methods have been developed for analysis of 17-OHP in serum using either GC-MS [10] or LC-MS/MS [11–14]. However, in the former case 17-OHP needs to be derivatized prior to analysis. Some methods are not sensitive enough to measure the 17-OHP concentrations in pregnant subjects [15–17]. A recent publication used a gas chromatographic method to measure 17-OHPC in equine plasma, however this method requires derivatization of 17-OHPC and is very time consuming [18]. We published recently a method for estimation of 17-OHPC in human plasma using LCMS/MS [19]. It is desirable to simultaneously measure the plasma levels of 17-OHPC along with endogenous 17-OHP and P levels in pregnant women, in order to investigate the interaction between endogenous hormones and 17-OHPC. The objective of this study was to develop a sensitive, specific and reproducible method for simultaneous estimation of 17-OHPC, 17-OHP and P concentration in plasma obtained from pregnant subjects treated with 17-OHPC.
2. Experimental
2.1. Chemicals and solvents
17α-Hydroxyprogesterone caproate (17-OHPC) (USP reference standard) was purchased from United States Pharmacopoeia. 17α-Hydroxyprogesterone (17-OHP), progesterone (P) and medroxyprogestrone acetate (MPA) were purchased from Sigma Chemicals (St. Louis, MO). Oasis ® HLB 1cc (30 mg, 30 μm particle size) extraction cartridges were purchased from Waters (Milford, MA). Optima HPLC grade methanol and HPLC grade water were obtained from Fisher Scientific (Fair Lawn, NJ, USA). Analytical grade ammonium hydroxide was obtained from Sigma Chemicals (St. Louis, MO). Human plasma was procured from central blood bank.
2.2. Standards
Primary stock solutions for standards and quality control samples were prepared in methanol (1 mg/ml). Working standards and quality control samples were diluted from primary stock solution with methanol. The working internal standard solution (1000 ng/ml) was prepared from the primary stock in methanol. Routine daily calibration curves and controls were prepared by spiking human plasma with working solution. The range of concentration of the spiked plasma standard was from 1 – 200 ng/ml for 17-OHPC and 17-OHP, 2 – 400 ng/ml for P. The concentration of quality control samples were 5, 25 and 50 ng/ml. Working standard solutions, spiked plasma standard and quality control samples were stored at −20°C. Internal standard solutions were store d at 2°C.
2.3. Sample preparation
Routine daily calibration curves, controls and the clinical samples were thawed at room temperature. Exactly 400 μl of plasma was diluted with 1 ml of water, and after addition of 25 μl of IS (1000 ng/ml), the entire solution was passed through Oasis® HLB 1 cc (30 mg) extraction cartridges, previously conditioned with methanol and water, under vacuum. After washing with 1 ml of 50% methanol, 17-OHPC, 17-OHP, and P were eluted with 1ml of methanol and the eluent was evaporated to dryness under air. The residue was reconstituted in 100 μl of starting mobile phase and 20 μl was injected into the HPLC system connected to the mass spectrometer.
2.4. Chromatographic and mass spectrometer conditions
The HPLC system used for the analysis of 17-OHPC and other steroids was a Waters 2795 model (Waters Corporation, MA, USA). Separation was performed on 3.5 μm, 2.1 × 50 mm Waters C18 Symmetry analytical column at 40°C with 2.1 × 10 mm Waters C18 Symmetry guard column. The mobile phase used was: [A] - 5% methanol in water containing 0.01% ammonium hydroxide and [B] – methanol containing 0.01% ammonium hydroxide. The total run time was 7 min at a flow rate of 0.3 ml/min with a gradient program starting from 65% solution [B] held for 2.5 min, 97% [B] held for 4.0 min, followed by returning to the initial condition of 65% [B], to achieve the base line.
Analysis was performed on a Micromass Quattro Micro triple quadrupole mass spectrometer (Waters, Milford, MA, USA) with positive electro spray ionization mode using multiple reaction monitoring (MRM). For all analytes and internal standard, MRM setting used was as follows: capillary voltage 3.5 kV; source temperature 100°C; desolvation temperature 450°C; cone gas flow (l/hr) 50; desolvation gas flow (l/hr) 550; argon pressure 20±10 psig; nitrogen pressure 100±20 psig; The extracted ions following MRM transitions monitored were m/z 429.10→313.10 for 17-OHPC, m/z 331.17→97.00 for 17-OHP, m/z 315.15→109.00 for P and m/z 387.15→327.25 for MPA (IS). The cone and collision energy for 17-OHPC, 17-OHP, P and MPA are presented in Table 1. The LC-MS system was controlled by the Masslynx® version 4.1, and data were collected with the same software.
Table 1.
The cone and collision energy set in LCMS for 17-OHPC, 17-OHP, P and MPA (IS)
| Parent m/z | Daughter m/z | Dwell (Sec) | Cone Energy (V) | Collision Energy (V) | |
|---|---|---|---|---|---|
| 17-OHPC | 429.10 | 313.10 | 0.1 | 24 | 13 |
| 17-OHP | 331.17 | 97.00 | 0.1 | 33 | 22 |
| P | 315.15 | 109.00 | 0.1 | 30 | 22 |
| MPA | 387.15 | 327.25 | 0.1 | 25 | 13 |
2.5. Assay validation
2.5.1. Specificity
The specificity of the method was examined by analyzing different blank human plasma samples extracted in the same way as described in sample preparation procedure. Six different source of blank male and non pregnant women human plasma (anti-coagulated whole blood with EDTA obtained from Central Blood Bank, Pittsburgh, PA) and ten different plasma samples from pregnant subjects (Magee Women Hospital, Pittsburgh, PA) not on 17-OHPC treatment have been tested to document the lack of interference with 17-OHPC or its internal standard, which was ensured at LLOQ.
2.5.2. Standard Curve and Linearity
Human plasma spiked with working solutions of standard 17-OHPC and 17-OHP in methanol were used in establishing the standard curve. The final concentration range used were 1 – 200 ng/ml for 17-OHPC and 17-OHP, 2 – 400 ng/ml for P. Calibration curves were constructed by plotting the peak area ratio of analyte to the internal standard (Y) against the analyte concentration (x). A linear regression analysis with weighing (1/x) was used to determine slopes, intercepts, and correlation coefficients. Concentration of analyte in the unknown samples was calculated from their peak area ratios and the calibration curve. The acceptance criterion for each back-calculated concentration of QC standards (5, 25, 50 ng/ml) was set at ≤15% deviation from the nominal value, except at the lower limits of quantification (LLOQ), where it was ≤20%.
2.5.3. Lower Limit of Quantification
LLOQ was determined as the lowest concentration of the test compound that gave a response at least 5 times greater compared to blank response and had deviation from nominal concentration of less than 20%.
2.5.4. Accuracy and precision
Accuracy was measured as the percentage difference from theoretical value according to the equation:
Where ConM = measured concentration, ConT = theoretical concentration.
The precision and accuracy of the developed method was determined by analysis of QC samples at three concentrations (5, 25 and 50 ng/ml). Injecting three samples at each concentration on the same day assessed intra-day variation of the assay. Inter-day variation was assessed by injecting six samples of each concentration on six days. The precision of the method was expressed in terms of %CV.
2.5.5. Recovery
The recovery of the analytes after extraction was determined by comparing the response of analytes in plasma samples spiked with known amounts of 17-OHPC, 17-OHP, P and MPA (IS) prior to extraction, with the extracted plasma samples to which the analytes were added at the same nominal concentration just before injection. Recoveries of 17-OHPC, 17-OHP and P were estimated at 5, 25 or 50 ng/ml. A single concentration of internal standard (25 μl of 1 μg/ml) was used to determine its recovery.
2.5.6. Ion suppression
Ion suppression was investigated by comparing the peak areas of analyte standards spiked in blank plasma following extraction with non-extracted standard analyte solutions (in methanol) at the same nominal concentration. The difference from 100% recovery was attributed to matrix effect also termed as ion suppression. Three concentrations for 17-OHPC, 17-OHP, and P (5, 25 and 50 ng/ml, n=4) and a fixed concentration of internal standard (25 μl of 1 μg/ml) were analyzed.
2.5.7. Stability
The stability of 17-OHPC, 17-OHP and P in plasma was evaluated at three concentrations (5, 25 and 50 ng/ml, n=3) under different conditions. The plasma samples were spiked with the above mentioned concentrations of the analyte and stored for: 4 months at −20°C, 7 days at 4°C, 24h at room temperature and analyzed immediately post extraction. Additionally, a freshly spiked plasma sample was extracted, stored at RT and analyzed 24h post extraction. The reference concentration was calculated from freshly spiked plasma samples injected immediately post extraction. Stability was expressed in terms of % relative recovery compared to reference concentration. The acceptance criterion for % relative recovery was set at 100 ± 20%.
2.5.8. Application to clinical sample analysis
Plasma samples were collected from pregnant subjects treated with 17-OHPC, as part of a clinical study where 17 OHPC was used to prevent preterm delivery. An intramuscular dose of 250 mg was administered to the subjects and steady state trough samples were collected and analyzed for 17-OHPC, 17-OHP and P using the developed method.
3. Results
3.1. Mass spectral analysis
When 17-OHPC, 17-OHP, P and MPA were infused into the mass spectrometer with a positive ion ESI interface, the protonated molecules [MH]+ of 17-OHPC, 17-OHP, P and MPA were seen in abundance. The mass-to-charge transition from parent ions and product ions were observed to have m/z 429.10→313.10 for 17-OHPC, m/z 331.17→97.00 for 17-OHP, m/z 315.15→109.00 for P and m/z 387.15→327.25 for MPA (IS). The instrument parameters including capillary voltage of 3.5 kV; source temperature of 100°C; desolvation temperature of 450°C; cone gas flow of 50 l/hr; desolvation gas flow of 550 l/hr; argon pressure of 20±10 psig; nitrogen pressure of 100±20 psig, were selected to optimize specificity and selectivity of both parent and product ions. The full scan mass spectra (m/z) for 17-OHPC, 17-OHP, P and MPA are shown in Figure 1.
Figure 1.
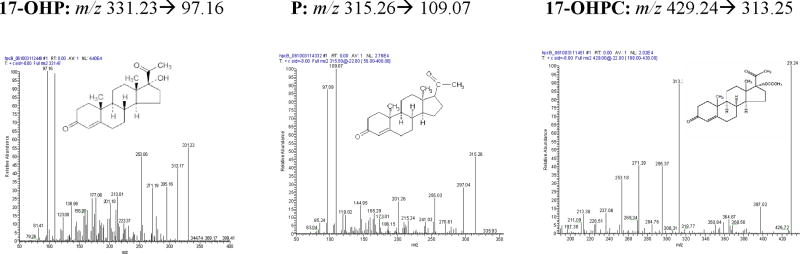
Representative positive ion ESI MS/MS spectrum for 17α-hydroxyprogesterone caproate, 17α-hydroxyprogesterone and progesterone. The mass transitions for 17-OHP m/z 331.23 > 97.16, P m/z 315.26 > 109.07, 17-OHPC m/z 429.24 > 313.25 are shown.
3.2. Separation and relative retention time
The retention times for 17-OHPC, 17-OHP, P and MPA were 4.5, 1.5, 2.5 and 2.2 min respectively, with a total run time of 7 min. Chromatogram depicting the analysis of blank plasma sample (without internal standard) obtained from human, male and pregnant female subjects is shown in Figure 2A. Figure 2B, display chromatograms observed from analysis of plasma samples spiked with 5 ng/ml of 17-OHPC, 17-OHP and P; and clinical samples Figure 2C displays chromatogram from a collected following intramuscular administration of 250 mg 17-OHPC, respectively.
Figure 2.


Representative SRM chromatograms of 17α-hydroxyprogesterone caproate, 17α-hydroxyprogesterone and progesterone in human plasma. (A) Blank male human plasma lacking the endogenous steroids [a, b], Blank pregnant human plasma without 17α-hydroxyprogesterone caproate showing 17α-hydroxyprogesterone [c] and progesterone [d], (B) blank male plasma containing 5 ng/ml of 17α-hydroxyprogesterone [a], medroxyprogestrone acetate [b], progesterone [c] and 17α-hydroxyprogesterone caproate [d], and (C) Clinical plasma sample following 250 mg intramuscular administration of 17α-hydroxyprogesterone caproate showing 17α-hydroxyprogesterone [a], medroxyprogestrone acetate [b], progesterone [c] and 17α-hydroxyprogesterone caproate [d]. The retention times for 17-OHP, MPA (IS), P, 17-OHPC were 1.3, 2.0, 2.3 and 4.5 min, respectively.
3.3. Linearity
The ratio of mean peak area of 17-OHPC, 17-OHP and P to MPA was linearly related to the concentration of 17-OHPC, 17-OHP and P (R2 = 0.9978, R2 = 0.9983, R2 = 0.9997 respectively for 17-OHPC, 17-OHP and P) in concentration range of 1 – 200 ng/ml for 17-OHPC and 17-OHP, and 2 – 400 ng/ml for P. The precision expressed as coefficients of variation at LLOQ (1 ng/ml for 17-OHPC and 17-OHP, 2 ng/ml for P) were 14.0%, 17.6%, 12.6%, respectively, and met the acceptance criterion of ≤20%.
3.4. Precision and accuracy
Intra-day and inter-day coefficients of variation for 17-OHPC, 17-OHP and P were within the acceptable limits to meet the guidelines for bioanalytical method validation. The inter-assay precision and inter-assay precision (expressed as %CV) at different analyte concentrations (5, 25 and 50 ng/ml) met the acceptance criterion of ≤20%. Complete estimates for Mean ± SD, %CV and Bias for all the QC samples were presented in Table 2. The results demonstrated that the measured concentrations were within 15% of the nominal concentration.
Table 2.
Intra-day and inter-day precision and accuracy in human plasma.
| Added Concentrat ion (ng/ml) | Intra-Assay (%) N=3 | Inter-Assay (%) N=6 | |||||
|---|---|---|---|---|---|---|---|
| Mean ± SD | CV (%) | Bias (%) | Mean ± SD | CV (%) | Bias (%) | ||
| 17-OHPC | 5 | 4.9 ± 0.2 | 4.8 | 2.7 | 4.9 ± 0.4 | 7.6 | −1.1 |
| 25 | 26.7 ± 1.2 | 4.3 | 6.7 | 26.5 ± 1.2 | 4.5 | 5.8 | |
| 50 | 54.9 ± 0.9 | 1.6 | 9.9 | 54.0 ± 1.6 | 3.0 | 7.9 | |
| 17-OHP | 5 | 4.8 ± 0.4 | 7.2 | −4.0 | 5.1 ± 0.5 | 9.5 | 1.1 |
| 25 | 23.6 ± 1.2 | 5.2 | −5.6 | 24.0 ± 1.9 | 7.9 | −4.0 | |
| 50 | 48.3 ± 2.5 | 5.1 | −3.5 | 50.4 ± 3.4 | 6.8 | 0.7 | |
| P | 5 | 5.0 ± 0.4 | 8.7 | −0.5 | 4.8 ± 0.6 | 12.3 | −5.0 |
| 25 | 25.1 ± 2.1 | 8.4 | 0.2 | 24.6 ± 1.7 | 6.9 | −1.7 | |
| 50 | 50.9 ± 2.9 | 5.8 | 1.8 | 50.2 ± 2.8 | 5.6 | 0.4 | |
3.5. Recovery data
The percent recovery of analytes was measured by comparing the concentration of extracted samples with non-extracted samples. The extraction recoveries at concentrations 5, 25, and 50 ng/ml were presented in Table 3. The calculated relative response values for evaluating the matrix effect at concentrations 5, 25, and 50 ng/ml were 101.6%, 92.9%, 98.6% for 17-OHPC, 89.9%, 70.4%, 78.6% for 17-OHP, and 106.6%, 94.4%, 98.9% for P, respectively (Table 3).
Table 3.
Extraction and ion suppression recovery data in human plasma
| Concentration (ng/ml) | Extraction Recovery | Ion Supression Relative Recovery | |||
|---|---|---|---|---|---|
| (n=4) | Mean ± SD | CV (%) | Mean ± SD | CV (%) | |
| 17-OHPC | 5 | 90.5 ± 1.5 | 1.7 | 101.6 ± 4.3 | 4.2 |
| 25 | 89.2 ± 6.6 | 7.5 | 92.9 ± 5.0 | 5.4 | |
| 50 | 90.74± 0.9 | 1.0 | 98.6 ± 10.8 | 10.9 | |
| 17-OHP | 5 | 63.3 ± 2.1 | 3.3 | 89.9 ± 4.4 | 4.9 |
| 25 | 61.4 ± 5.2 | 8.4 | 70.4 ± 7.4 | 10.5 | |
| 50 | 61.7 ± 5.3 | 8.6 | 78.6 ± 0.9 | 1.2 | |
| P | 5 | 89.6 ± 4.9 | 5.5 | 106.6 ± 3.9 | 3.7 |
| 25 | 91.5 ± 3.2 | 3.5 | 94.4 ± 2.9 | 3.0 | |
| 50 | 90.9 ± 4.2 | 4.7 | 98.9 ± 2.6 | 2.6 | |
| IS | 25μl of 1μg/ml | 95.7 ± 11.4 | 11.9 | 98.4 ± 6.0 | 5.9 |
3.6. Storage stability data
No significant difference in the estimated concentrations of 17 OHPC, 17-OHP and P in plasma samples maintained and analyzed under different stability conditions was observed when compared with freshly spiked plasma samples (Table 4).
Table 4.
Stability data in human plasma stored at −20°C, 4°C for 7 days, RT for 24 h, and extracted plasma samples stored at 4°C for 24 h
| Reference Conc.(ng/ml) | Stored at −20°C (n=3) |
Analysis after 7 days at 4°C following thawing (n=3) |
Analysis after 24 h at RT following thawing (n=3) |
Analysis after 24 h at 4°C post sample preparation (n=3) |
|||||||||
|---|---|---|---|---|---|---|---|---|---|---|---|---|---|
| Mean Observed Value |
Relative Recovery (%) |
CV (%) |
Mean Observed Value |
Relative Recovery (%) |
CV (%) | Mean Observed Value |
Relative Recovery (%) |
CV (%) |
Mean Observed Value |
Relative Recovery (%) |
CV (%) | ||
| 17-OHPC | 5.3 | 5.4 | 101.9 | 3.2 | 5.6 | 106.3 | 13.8 | 5.8 | 110.1 | 7.7 | 5.2 | 97.6 | 4.3 |
| 24.9 | 27.6 | 110.9 | 2.9 | 28.5 | 114.6 | 4.5 | 27.2 | 109.3 | 2.8 | 24.4 | 98.2 | 4.4 | |
| 48.1 | 52.5 | 109.0 | 6.5 | 52.2 | 108.4 | 5.6 | 48.3 | 100.4 | 2.2 | 49.5 | 102.9 | 1.3 | |
| 17-OHP | 4.5 | 4.0 | 88.2 | 13.9 | 4.3 | 95.6 | 10.7 | 3.8 | 85.9 | 10.8 | 5.1 | 114.2 | 10.4 |
| 22.0 | 20.3 | 92.1 | 2.3 | 21.4 | 97.3 | 8.1 | 19.5 | 88.6 | 2.9 | 24.0 | 109.1 | 2.8 | |
| 44.4 | 40.0 | 90.2 | 10.2 | 40.0 | 90.3 | 11.7 | 46.0 | 103.8 | 4.5 | 44.5 | 100.3 | 3.5 | |
| P | 5.6 | 5.5 | 97.6 | 5.5 | 6.4 | 113.0 | 14.1 | 5.8 | 103.6 | 5.5 | 6.0 | 105.6 | 4.9 |
| 26.8 | 28.1 | 104.6 | 1.8 | 28.3 | 105.5 | 2.7 | 28.2 | 105.0 | 3.6 | 26.8 | 99.8 | 4.4 | |
| 55.3 | 54.2 | 98.0 | 2.9 | 54.2 | 98.0 | 5.1 | 54.1 | 97.8 | 4.7 | 57.3 | 103.5 | 2.0 | |
3.7. Application to clinical sample analysis
The method developed was applied to a set of samples collected in a clinical study for 17-OHPC in pregnant subjects. Trough plasma concentrations for 17-OHPC, and endogenous levels of 17-OHP and P of 18 pregnant subjects were estimated in these samples (Fig. 3). The trough plasma concentration range for 17-OHPC, endogenous 17-OHP and P were 4.0–19.8, 1.4–11.0 and 47.5–290.7 ng/ml, respectively.
Figure 3.

Plasma trough levels (ng/ml) for 17α-hydroxyprogesterone caproate, 17α-hydroxyprogesterone and progesterone from 18 pregnant women following intramuscular administration of 250 mg 17α-hydroxyprogesterone caproate. The patient received at least 5 weekly injections prior to sampling. (◆) 17α-hydroxyprogesterone caproate, (●) 17α-hydroxyprogesterone and (■) progesterone.
4. Discussion
The aim of this study was to develop an LC-MS/MS method for the simultaneous quantification of 17-OHPC, 17-OHP and P in plasma. The internal standard MPA has structural similarity with 17-OHP and was well separated from the various analytes. The internal standard, 17-OHPC, 17-OHP and P were separated from other compounds in the plasma using an analytical column and a gradient profile. The gradient profile, while shortening the total run time when compared to our earlier method [18], also allowed for sharp peak separation of all the steroids of interest in a single run.
Preliminary analysis was performed with both positive and negative ion modes. Since, the sensitivity obtained with positive mode was much better, it was selected for all future studies. Electro spray ionization (ESI) gave a higher signal than the atmospheric pressure chemical ionization and was selected for analysis of these compounds.
Basal levels of 17-OHP and P were detected in pregnant women not on 17-OHPC. On the other hand 17-OHP and P were not detected in the plasma samples obtained from male volunteers. Using a solid phase extraction, water soluble materials from the plasma was first removed. Most of the steroids and 17-OHPC were then eluted from the solid phase extraction column using methanol. The extraction recovery was in the range of 89–92% for 17-OHPC and P, and 61–63% for 17-OHP. Although the recovery for 17-OHP was relatively low, the basal levels in pregnant women were high enough to be quantitated. This extraction procedure allowed for minimal ion suppression (matrix effect) of 17-OHPC and P during mass spectrometric analysis. However, significant ion suppression (10–30%) was observed for 17-OHP. The assay sensitivity can be further increased by using a larger volume (1 ml) of plasma sample for extraction and a larger injection volume.
The method was highly reproducible. The intra-day and inter-day coefficient of variation was within the 15% acceptable limits. The method was also accurate with a bias of less than 10% at all levels tested.
In pharmacokinetic studies plasma samples are normally stored at −20°C or −80°C until analysis and plasma samples are exposed to various temperatures during the assay procedure. It is important to understand the stability of the analyte at various storage and handling conditions. Stability of 17-OHPC, 17-OHP and P was determined by comparing analyte levels in fresh plasma samples (spiked with 17-OHPC, 17-OHP and P) with plasma samples stored at −20°C for 4 months, at 4°C for 7 days, at RT for 24 hr. These stability samples were analyzed immediately post-extraction. In addition, a fresh plasma sample (spiked with 17-OHPC, 17-OHP and P), stored at RT, analyzed 24 hr post sample preparation was also compared. These steps simulate various conditions that the samples may be subjected to prior to analysis. The content of 17-OHPC, 17-OHP or P was independent of the sample processing and storage conditions indicating the stability of all compounds under the conditions tested. The assay is being currently used to analyze the concentration of 17-OHPC, 17-OHP and P in plasma samples obtained from a pharmacokinetic study involving intramuscular administration of 17-OHPC (250 mg) to pregnant women. The trough plasma concentrations in a dosing interval were readily measurable using this method, thus, demonstrating a good sensitivity. The concentration of 17-OHPC, 17-OHP and P in 18 pregnant women on 17-OHPC treatment was measured simultaneously using this validated assay.
5. Conclusion
A sensitive and selective LC-MS/MS assay procedure using solid phase extraction for the specific and simultaneous quantitative analysis of 17-OHPC, 17-OHP and P in human plasma was developed and validated. The assay uses MPA as an internal standard; the extraction procedure uses simple solid phase extraction that allows sufficient sample throughput to be applied to clinical pharmacokinetic studies of 17-OHPC. The assay has been validated, and the results of validation show the method to be reproducible and accurate. The analysis requires only 400 μl of plasma, which has an advantage in pharmacokinetic studies. This LC-MS/MS method has a lower LLOQ for all the compounds studied, which is suitable for the simultaneous assessment of simultaneous 17-OHPC, 17-OHP and P levels in plasma samples.
Acknowledgments
This work is supported in part by NICHD grant HD-047905-2.
Footnotes
Publisher's Disclaimer: This is a PDF file of an unedited manuscript that has been accepted for publication. As a service to our customers we are providing this early version of the manuscript. The manuscript will undergo copyediting, typesetting, and review of the resulting proof before it is published in its final citable form. Please note that during the production process errors may be discovered which could affect the content, and all legal disclaimers that apply to the journal pertain.
References
- 1.Paneth NS. Future Child. 1995;5:19–34. [PubMed] [Google Scholar]
- 2.Mattison DR, Damus K, Fiore E, Petrini J, Alter C. Paediatr Perinat Epidemiol. 2001;2:7–16. doi: 10.1046/j.1365-3016.2001.00004.x. [DOI] [PubMed] [Google Scholar]
- 3.Meis PJ. Obstet Gynecol. 2005;105:1128–1135. doi: 10.1097/01.AOG.0000160432.95395.8f. [DOI] [PubMed] [Google Scholar]
- 4.Petrini JR, Callaghan WM, Klebanoff M, Green NS, Lackritz EM, Howse JL, Schwarz RH, Damus K. Obstet Gynecol. 2005;105:267–272. doi: 10.1097/01.AOG.0000150560.24297.4f. [DOI] [PubMed] [Google Scholar]
- 5.Sanchez-Ramos L, Kaunitz AM, Delke I. Obstet Gynecol. 2005;105:273–279. doi: 10.1097/01.AOG.0000150559.59531.b2. [DOI] [PubMed] [Google Scholar]
- 6.Meis PJ, Klebanoff M, Thom E, Dombrowski MP, Sibai B, Moawad AH, Spong CY, Hauth JC, Miodovnik M, Varner MW, Leveno KJ, Caritis SN, Iams JD, Wapner RJ, Conway D, O’Sullivan MJ, Carpenter M, Mercer B, Ramin SM, Thorp JM, Peaceman AM, Gabbe S. N Engl J Med. 2003;348:2379–2385. doi: 10.1056/NEJMoa035140. [DOI] [PubMed] [Google Scholar]
- 7.Onsrud M, Paus E, Haug E, Kiorstad K. Acta Obstet Gynecol Scand. 1985;65:519–523. doi: 10.3109/00016348509156732. [DOI] [PubMed] [Google Scholar]
- 8.Wong T, Shackleton CH, Covey TR, Ellis G. Clin Chem. 1992;38:1830–1837. [PubMed] [Google Scholar]
- 9.Wilson DH, Groskopf W, Hsu S, Caplan D, Langner T, Baumann M, DeManno D, Williams G, Payette D, Dagel C, Lynch D, Manderino G. Clin Chem. 1998;44:86–91. [PubMed] [Google Scholar]
- 10.Wudy SA, Hartmann M, Homoki J. J Endocrinol. 2000;165:679–683. doi: 10.1677/joe.0.1650679. [DOI] [PubMed] [Google Scholar]
- 11.Lai CC, Tsai CH, Tsai FJ, Lee CC, Lin WD. Rapid Commun Mass Spectrom. 2001;15:2145–2151. doi: 10.1002/rcm.493. [DOI] [PubMed] [Google Scholar]
- 12.Turpeinen U, Itkonen O, Ahola L, Ahola L, Stenman UH. J Clin Lab Invest. 2005;65:3–12. doi: 10.1080/00365510410008421. [DOI] [PubMed] [Google Scholar]
- 13.Johnson DW. Rapid Commun Mass Sprectrom. 2005;19:193–200. doi: 10.1002/rcm.1771. [DOI] [PubMed] [Google Scholar]
- 14.Etter ML, Eichhorst J, Lehotay DC. J Chromatogr B. 2006;840:69–74. doi: 10.1016/j.jchromb.2006.04.038. [DOI] [PubMed] [Google Scholar]
- 15.Migulla H, Bauer S, Gerbsch S, Kewitz H. Pharmazie. 1993;48:145–146. [PubMed] [Google Scholar]
- 16.Levtchenko NK, Osokin DM, Torgov IV, Arzamastzev AP, Sokolova TM, Tuguntaev GI. J Chromatogr B. 1988;456:427–430. doi: 10.1016/0021-9673(86)80043-7. [DOI] [PubMed] [Google Scholar]
- 17.Das Gupta V. J Pharm Sci. 1982;71:294–297. doi: 10.1002/jps.2600710307. [DOI] [PubMed] [Google Scholar]
- 18.McKinney AR, Suann CJ, Stenhouse AM. Rapid Commun Mass Spectrom. 2006;20:1855–1858. doi: 10.1002/rcm.2526. [DOI] [PubMed] [Google Scholar]
- 19.Zhang S, Mada SR, Mattison D, Caritis S, Venkataramanan R. J Chromatogr B. 2007;856:141–147. doi: 10.1016/j.jchromb.2007.05.028. [DOI] [PMC free article] [PubMed] [Google Scholar]