

NMR spectroscopy is unique as it provides a means to study bio-molecules with atomic resolution in a near natural environment. Traditionally, NMR spectroscopic analysis of structures, interactions, and dynamics has been reserved for molecular complexes that are smaller than 20 kDa. However, in recent years, the introduction of TROSY techniques,[1] protein deuteration,[2] and selective methyl-group labeling[3] has significantly extended this molecular weight limit.[4] Indeed, systems far over 100 kDa have been analyzed in great detail, revealing unique functional aspects of large molecular machines.[5]
Many NMR spectroscopic studies on large systems have been performed on highly symmetric complexes, as these assemblies are relatively easy to prepare and result in simple NMR spectra in which the resonance signals from all the subunits are identical.[5a] For large asymmetric assemblies that can be produced in E. coli by co-expression of all the components,[6] spectral crowding will lead to NMR spectra that can no longer be analyzed in detail. In a limited number of cases this crowding could be circumvented by in vitro reconstitution of the complex from separately expressed NMR active and NMR inactive subunits.[5b,c,h] This strategy is, however, not generally applicable. As a result, most eukaryotic systems that are much more complex than their bacterial or archaeal counterparts will remain inaccessible to high-resolution NMR studies.
Herein, we introduce a sequential co-expression method for the preparation of large asymmetric complexes that combines the advantages of in vivo reconstitution and the benefits of partial NMR isotope labeling to reduce NMR spectral complexity. We transform E. coli cells with two plasmids carrying different promoters so that protein expression can be induced independently. In this manner, it is possible to induce protein synthesis for one set of proteins in an NMR active medium (stage 1), whereas a second set of proteins can be produced in an NMR invisible medium (stage 2; Figure 1 A). As all expressed proteins are present in a single E. coli cell, the final complex can assemble in a cellular environment preventing the aggregation of subunits that are otherwise instable in isolation. We refer to our method to “label, express, and generate oligomers” for NMR as “LEGO-NMR”.
Figure 1.

Principle of LEGO-NMR spectroscopy: A) shown is method A1 (Table S2, Figure S1). In stage 1 the E. coli cells are grown in NMR active medium and protein synthesis is induced from plasmid 1, resulting in the production of NMR active LSm5, LSm6, and LSm7. In stage 2, the cells are transferred to an NMR inactive medium, where protein synthesis from plasmid 2 is induced, resulting in the production of NMR invisible LSm2, LSm3, LSm4, and LSm8. By addition of a purification tag to a single subunit of the complex, the intact complex can be straightforwardly isolated and purified to homogeneity. NMR active subunits are colored, whereas NMR invisible subunits are in gray. B) 1H-15N TROSY NMR spectrum (gray) of the uniformly NMR active LSm2–8. Especially the central region suffers from severe resonance overlap, complicating spectral analysis significantly. C) Top left: LEGO 1H-15N NMR spectrum (black) of the LSm2–8 complex, in which LSm5, LSm6, and LSm7 are NMR active and LSm2, LSm3, LSm4, and LSm8 are NMR invisible. Other panels: LEGO 1H-15N NMR spectra of the LSm2–8 complex in which individual LSm subunits are NMR active in an otherwise NMR inactive background. The resonance signals in the spectra display a subset of the resonance signals observed in the fully labeled complex (see enlargements).
The LEGO method requires tightly controlled individual DNA promoters such that the promoter that induces protein expression in stage 1 is completely switched off in stage 2, whereas the promoter for stage 2 is not active in stage 1. In LEGO methods A1 and A2 (Supporting Information, Figure S1), protein production is induced from an araBAD promoter using arabinose in stage 1 and from a T7 promoter using IPTG in the stage 2.[7] In this case, the glucose that is present in stage 2 efficiently turns off the araBAD promoter.[8] In LEGO method B, we introduce a three-promoter system, where protein production is induced from a T7 promoter in stage 1, and from an araBAD promoter in stage 2. In this case, the T7 promoter is actively switched off by the expression of T7 lysozyme in between stage 1 and stage 2 from a third plasmid that contains a rhamnose inducible promoter.[9] This inhibition is required as T7 expression would otherwise continue for over 4 h after the removal of IPTG from the growth medium.[7a]
To establish the LEGO-NMR methodology, we use two different LSm complexes that play a role in mRNA degradation and pre-mRNA splicing. The LSm1–7 complex[10] (containing the LSm1 to LSm7 proteins) and LSm2–8 complex[11] (containing the LSm2 to LSm8 proteins) contain seven different protein chains that are arranged in a unique order.[11b, 12] As most LSm proteins are insoluble in isolation, neither the LSm1–7 nor the LSm2–8 complex can be efficiently reconstituted in vitro from separately expressed proteins.[13] On the other hand, co-expression of the different LSm proteins yields homogeneous NMR samples (Figure 1 B), showing that in-cell reconstitution functions efficiently. However, owing to the large number of unique resonances (649 expected backbone amide signals) the resulting NMR spectra suffer significantly from spectral overlap (Figure 1 B), preventing an accurate analysis. LSm complexes are thus a good example of eukaryotic protein complexes that are currently not accessible for detailed high-resolution NMR spectroscopic techniques.
To reduce the spectral overlap for the LSm2–8 complex by a factor of approximately two, we labeled the LSm5, LSm6, and LSm7 proteins with 15N in stage 1, whereas the LSm2, LSm3, LSm4, and LSm8 proteins were produced in an NMR inactive medium in stage 2. The resulting spectrum of the LSm2–8 complex that only displays LSm5, LSm6, and LSm7 is significantly simplified (Figure 1 C, top left). Importantly, a very good overlay of a subset of the resonances of the fully NMR active LSm2–8 complex is observed, as we intended to achieve. This situation clearly allows for the identification of the resonances in the LSm2–8 complex that result from the LSm5, LSm6, and LSm7 proteins.
To establish the power of the sequential co-expression methodology further, we produced seven different NMR samples of the LSm2–8 complex, in which only a single LSm protein was 15N-labeled in the stage 1, whereas the remaining six LSm proteins were expressed in an NMR inactive form in stage 2 (Figure 1 C). The seven spectra of the LSm2–8 complex allow for the unambiguous identification of the resonance signals that result from each individual LSm protein in the LSm2–8 complex. In this manner, a simplification of 89 % can be achieved (74 expected amide signals in the LEGO LSm6 spectrum). Our approach is thus able to deconvolute the complicated spectrum of the hetero-heptameric complex into seven significantly simplified sub-spectra. At the same time, the overlay of the seven NMR spectra of the complexes that contain a single labeled LSm protein yields the spectrum of the uniformly labeled LSm2–8 complex (Figure S2). Note that the proteins that are produced in a deuterated form in stage 1 are efficiently re-protonated at the beginning of stage 2 before the individual subunits are incorporated in the final complex. This eliminates the need of (refolding) methods to re-protonate backbone amides (Figure S3) in the LSm2–8 complex.
The LSm2–8 complex is part of the U6 snRNP, where it interacts with the 3′ end of the U6 snRNA.[11a, 14] To establish which subunits in the LSm2–8 complex contact the RNA substrate, we performed NMR titration experiments with LSm2–8 LEGO complexes that either contained NMR active LSm2, LSm3, LSm4, and LSm8 (Figure S4A) or that contained NMR active LSm5, LSm6, and LSm7 (Figure S4B) in an otherwise NMR inactive background. In both complexes, we observed significant chemical shift perturbations upon complex formation with the RNA. Importantly, the single subunit LEGO spectra (Figure 1 C) establish that all seven LSm proteins are involved in RNA binding (Figure S4A,B) as resonance signals for all the LSm proteins experience chemical shift changes upon interaction with the RNA. To resolve the remaining spectral overlap, we performed an RNA titration experiment with an LSm2–8 complex that was labeled at LSm5 only (Figure 2 A). We then combined information from the previously assigned LSm657 complex,[13a] the LSm5 LEGO spectrum (Figure 1 C) and an HNCA spectrum of a fully 2H, 13C, 15N-labeled LSm2–8 complex (Figure 2 B) to assign the LSm5 residues in the LSm2–8 complex that contact the RNA. In this case, we exploited the fact that we were able to select the LSm5 resonance signals in the HNCA spectrum of the fully labeled LSm2–8 complex, thus reducing the number of expected resonance signals from 649 to 77, which significantly simplified the assignment process. This approach revealed that the residues that experience large chemical shift perturbations upon interaction with the U6 snRNA are located in loop 5 of the LSm5 protein (Figure 2 C). This loop connects β-strands 4 and 5 in the LSm fold and lines the central pore of the LSm ring. As the RNA we used for the interaction experiments contains only nine bases and as all the LSm proteins are involved in the RNA interaction (Figure S4) our data suggests that the RNA binding site in LSm2–8 is at the central pore. Additional information to support this observation can be obtained from the assignment of the other LSm proteins in the LSm2–8 complex in an analogous manner. Interestingly, the eukaryotic Sm complex,[15] the archaeal LSm complex,[16] and Hfq[17] have all been shown to use this region to interact with substrate RNA indicating that this binding site is conserved in the eukaryotic LSm complexes.
Figure 2.

Assignment of LSm5 in the LSm2–8 complex. A) LSm5 in the LSm2–8 complex before (black) and after (pink) the addition of the 3′ end of the U6 snRNA B) LSm5 resonance strips from an HNCA experiment that was recorded on a fully labeled LSm2–8 complex. The resonance strips could be selected based on the LSm5 LEGO-NMR spectrum (A, and Figure 1 C). C) LSm5 residues that experience the largest chemical shift changes upon addition of the U6 snRNA are marked as pink spheres on a model of the LSm2–8 complex.
Methyl TROSY spectroscopy has been shown to be highly suitable for the study of supramolecular complexes that are inaccessible to backbone-directed TROSY spectroscopy. To establish ε-1H-13C methyl labeling of methionine residues in concert with LEGO-NMR, we used the hetero-heptameric LSm1–7 complex whose 1H-15N TROSY spectra are of lower quality compared to those of the LSm2–8 complex (Figure S5). Methionine methyl TROSY spectra of the LSm1–7 complex, where all proteins are fully methionine labeled, display a large number of well resolved methyl resonances in addition to a region that suffers from significant spectral overlap (Figure 3 A, top left). To resolve the spectral overlap and to assign the well-resolved resonances to specific LSm proteins, we prepared seven different LEGO NMR samples of the LSm1–7 ring. In each of these samples a single LSm protein was methionine labeled, whereas the other six LSm proteins were NMR invisible. Methyl TROSY spectra of these hetero-heptameric complexes allowed for the unambiguous assignment of the methionine methyl groups to individual LSm proteins (Figure 3 A). Site-specific assignment of these methyl groups can be made using a mutational approach.[5a, 18] In addition, the “singly labeled” LSm1–7 rings significantly resolved the spectral overlap of the spectrum. Methionine methyl TROSY spectroscopy is thus fully compatible with the LEGO-NMR methodology and can provide high-resolution spectra for complexes that are not amenable to 1H,15N-based TROSY spectroscopy. Note that it has been shown recently that methionine methyl groups are excellent probes to study molecular interactions.[19]
Figure 3.
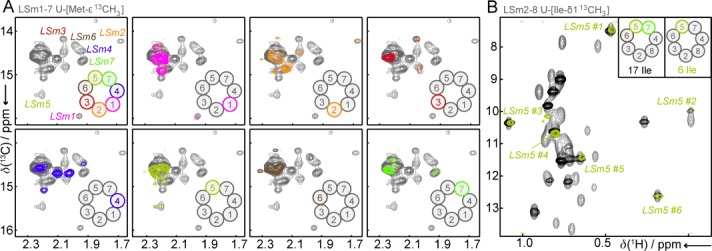
Methyl-group labeling. A) Methionine methyl-group spectra of the LSm1–7 complex. Top left: the methyl TROSY spectrum of an LSm1–7 complex in which all the LSm proteins are NMR active. This spectrum can be deconvoluted into seven simplified spectra that contain only a singly NMR-active LSm protein (other panels). B) Methyl TROSY spectra of Ile-δ1 labeled LSm2–8 complexes. The spectrum of the fully isoleucine labeled spectrum (gray) is simplified by labeling only the LSm5, LSm6, and LSm7 proteins (black) or only the LSm5 protein (olive).
In addition to methionine methyl groups, methyl TROSY spectroscopy is often performed in concert with labeled methyl groups of isoleucine, leucine, valine,[20] or alanine[21] residues. As opposed to methionine labeling, these amino acids are incorporated into the protein through E. coli metabolization of specifically labeled precursor molecules. For isoleucine residues this is only possible in the presence of glucose as that induces catabolite repression that inhibits metabolic pathways that would otherwise degrade α-ketobutyric acid.[22] Stage 1 in method A1, that we used for methionine and nitrogen labeling (Figure S1, Table S2), uses glycerol as a carbon source and can thus not be used for isoleucine labeling. To label selected subunits with isoleucine methyl groups we thus use method A2 (where the NMR labeling is moved from stage 1 to stage 2) or method B (where an arabinose-inducible vector is used in stage 2; Figure S1).
The high quality of the spectrum of the fully isoleucine-δ1 labeled spectrum reflects the strength of methyl-group labeling for high molecular-weight complexes (Figure 3 B, gray). We then used method B to prepare a “half-labeled” LSm2–8 LEGO complex that contains NMR active isoleucine-δ1 methyl groups in LSm5, LSm6, and LSm7 (Figure 3 B, black). As observed for the H,N-based spectra (Figure 1 C), a subset of the resonances that result from the labeled proteins can be readily identified. It is worth noting that the LSm5, LSm6, and LSm7 proteins contain 17 isoleucine residues, 16 of which yield well-dispersed resonance signals in the spectrum. To extend the LEGO approach one step further, we used method A2 to prepare an LSm2–8 complex, in which only LSm5 is NMR active (Figure 3 B, olive). The resulting HMQC spectrum displays six distinct resonance signals that result from the six isoleucine residues that are present in the LSm5 protein.
In the examples shown above, we ensured that isotope labeling was restricted to a subset of the subunits in the complex, whereas the remaining subunits were NMR invisible. Interestingly, it is also possible to distribute different labeling schemes over the different subunits. We demonstrate this approach with an LSm2–8 complex that is uniformly 15N labeled, LSm2, LSm3, LSm4, and LSm8 methionine labeled, and LSm5, LSm6, and LSm7 isoleucine labeled (Figure 4). Owing to the spectral separation of methionine and isoleucine methyl groups this approach allows for the independent and simultaneous monitoring of NMR parameters from different parts of a large complex.
Figure 4.

Mixed 15N, ε-1H,13C-methyl methionine and δ1-1H,13C-methyl isoleucine labeling of LSm2–8. The 1H-15N TROSY spectrum (left) displays all subunits in the complex (see Figure 1 B). LSm2, LSm3, LSm4, and LSm8 are labeled with methionine residues (see Figure 3 A, that displays the methionine methyl groups for LSm1–7). LSm5, LSm6, and LSm7 are labeled with isoleucine residues (see Figure 3 B).
NMR spectroscopic studies of large and asymmetric protein complexes suffer from significant challenges related to sample preparation and from spectral crowding owing to a high number of unique resonances. We have introduced a sequential co-expression strategy that tackles both issues simultaneously. Using the LSm1–7 and LSm2–8 complexes, we show that highly homogeneous samples that contain only one NMR active subunit can be readily prepared. Importantly, our strategy is compatible with backbone and methyl group side-chain labeling. LEGO-NMR is thus suitable for the study of large asymmetric complexes including eukaryotic systems that are currently inaccessible to detailed NMR analysis. Interestingly, around 50 % of the assemblies in the protein data bank (PDB) that contain three or more unique chains have been prepared in E. coli, indicating that our method is applicable to a wide variety of complexes.
Supporting Information
As a service to our authors and readers, this journal provides supporting information supplied by the authors. Such materials are peer reviewed and may be re-organized for online delivery, but are not copy-edited or typeset. Technical support issues arising from supporting information (other than missing files) should be addressed to the authors.
miscellaneous_information
References
- 1a.Pervushin K, Riek R, Wider G, Wuthrich K. Proc. Natl. Acad. Sci. USA. 1997;94:12366–12371. doi: 10.1073/pnas.94.23.12366. [DOI] [PMC free article] [PubMed] [Google Scholar]
- 1b.Tugarinov V, Hwang PM, Ollerenshaw JE, Kay LE. J. Am. Chem. Soc. 2003;125:10420–10428. doi: 10.1021/ja030153x. [DOI] [PubMed] [Google Scholar]
- 2.Sattler M, Fesik SW. Structure. 1996;4:1245–1249. doi: 10.1016/s0969-2126(96)00133-5. [DOI] [PubMed] [Google Scholar]
- 3.Tugarinov V, Kanelis V, Kay LE. Nat. Protoc. 2006;1:749–754. doi: 10.1038/nprot.2006.101. [DOI] [PubMed] [Google Scholar]
- 4.Sprangers R, Velyvis A, Kay LE. Nat. Methods. 2007;4:697–703. doi: 10.1038/nmeth1080. [DOI] [PubMed] [Google Scholar]
- 5a.Sprangers R, Gribun A, Hwang PM, Houry WA, Kay LE. Proc. Natl. Acad. Sci. USA. 2005;102:16678–16683. doi: 10.1073/pnas.0507370102. [DOI] [PMC free article] [PubMed] [Google Scholar]
- 5b.Sprangers R, Kay LE. Nature. 2007;445:618–622. doi: 10.1038/nature05512. [DOI] [PubMed] [Google Scholar]
- 5c.Kato H, van Ingen H, Zhou BR, Feng H, Bustin M, Kay LE, Bai Y. Proc. Natl. Acad. Sci. USA. 2011;108:12283–12288. doi: 10.1073/pnas.1105848108. [DOI] [PMC free article] [PubMed] [Google Scholar]
- 5d.Religa TL, Sprangers R, Kay LE. Science. 2010;328:98–102. doi: 10.1126/science.1184991. [DOI] [PubMed] [Google Scholar]
- 5e.Velyvis A, Yang YR, Schachman HK, Kay LE. Proc. Natl. Acad. Sci. USA. 2007;104:8815–8820. doi: 10.1073/pnas.0703347104. [DOI] [PMC free article] [PubMed] [Google Scholar]
- 5f.Gelis I, Bonvin AM, Keramisanou D, Koukaki M, Gouridis G, Karamanou S, Economou A, Kalodimos CG. Cell. 2007;131:756–769. doi: 10.1016/j.cell.2007.09.039. [DOI] [PMC free article] [PubMed] [Google Scholar]
- 5g.Rosenzweig R, Moradi S, Zarrine-Afsar A, Glover JR, Kay LE. Science. 2013;339:1080–1083. doi: 10.1126/science.1233066. [DOI] [PubMed] [Google Scholar]
- 5h.Audin M, Dorn G, Fromm SA, Reiss K, Schütz S, Vorländer MK, Sprangers R. Angew. Chem. 2013;125:8470–8474. doi: 10.1002/anie.201302811. [DOI] [PMC free article] [PubMed] [Google Scholar]
- Angew. Chem. Int. Ed. 2013;52:8312–8316. doi: 10.1002/anie.201302811. [DOI] [PMC free article] [PubMed] [Google Scholar]
- 6.Selleck W, Howley R, Fang Q, Podolny V, Fried MG, Buratowski S, Tan S. Nat. Struct. Biol. 2001;8:695–700. doi: 10.1038/90408. [DOI] [PubMed] [Google Scholar]
- 7a.Burz DS, Dutta K, Cowburn D, Shekhtman A. Nat. Methods. 2006;3:91–93. doi: 10.1038/nmeth851. [DOI] [PMC free article] [PubMed] [Google Scholar]
- 7b.Zuger S, Iwai H. Nat. Biotechnol. 2005;23:736–740. doi: 10.1038/nbt1097. [DOI] [PubMed] [Google Scholar]
- 7c.Muona M, Aranko AS, Raulinaitis V, Iwai H. Nat. Protoc. 2010;5:574–587. doi: 10.1038/nprot.2009.240. [DOI] [PubMed] [Google Scholar]
- 7d.Kimura RH, Steenblock ER, Camarero JA. Anal. Biochem. 2007;369:60–70. doi: 10.1016/j.ab.2007.05.014. [DOI] [PubMed] [Google Scholar]
- 8a.Miyada CG, Stoltzfus L, Wilcox G. Proc. Natl. Acad. Sci. USA. 1984;81:4120–4124. doi: 10.1073/pnas.81.13.4120. [DOI] [PMC free article] [PubMed] [Google Scholar]
- 8b.Guzman LM, Belin D, Carson MJ, Beckwith J. J. Bacteriol. 1995;177:4121–4130. doi: 10.1128/jb.177.14.4121-4130.1995. [DOI] [PMC free article] [PubMed] [Google Scholar]
- 9.Wagner S, Klepsch MM, Schlegel S, Appel A, Draheim R, Tarry M, Hogbom M, van Wijk KJ, Slotboom DJ, Persson JO, de Gier JW. Proc. Natl. Acad. Sci. USA. 2008;105:14371–14376. doi: 10.1073/pnas.0804090105. [DOI] [PMC free article] [PubMed] [Google Scholar]
- 10.Tharun S, He W, Mayes AE, Lennertz P, Beggs JD, Parker R. Nature. 2000;404:515–518. doi: 10.1038/35006676. [DOI] [PubMed] [Google Scholar]
- 11a.Achsel T, Brahms H, Kastner B, Bachi A, Wilm M, Luhrmann R. Embo J. 1999;18:5789–5802. doi: 10.1093/emboj/18.20.5789. [DOI] [PMC free article] [PubMed] [Google Scholar]
- 11b.Salgado-Garrido J, Bragado-Nilsson E, Kandels-Lewis S, Seraphin B. Embo J. 1999;18:3451–3462. doi: 10.1093/emboj/18.12.3451. [DOI] [PMC free article] [PubMed] [Google Scholar]
- 12.Wilusz CJ, Wilusz J. Nat. Struct. Mol. Biol. 2005;12:1031–1036. doi: 10.1038/nsmb1037. [DOI] [PubMed] [Google Scholar]
- 13a.Mund M, Neu A, Ullmann J, Neu U, Sprangers R. J. Mol. Biol. 2011;414:165–176. doi: 10.1016/j.jmb.2011.09.051. [DOI] [PubMed] [Google Scholar]
- 13b.Zaric B, Chami M, Remigy H, Engel A, Ballmer-Hofer K, Winkler FK, Kambach C. J. Biol. Chem. 2005;280:16066–16075. doi: 10.1074/jbc.M414481200. [DOI] [PubMed] [Google Scholar]
- 14.Mayes AE, Verdone L, Legrain P, Beggs JD. Embo J. 1999;18:4321–4331. doi: 10.1093/emboj/18.15.4321. [DOI] [PMC free article] [PubMed] [Google Scholar]
- 15.Leung AK, Nagai K, Li J. Nature. 2011;473:536–539. doi: 10.1038/nature09956. [DOI] [PMC free article] [PubMed] [Google Scholar]
- 16.Toro I, Thore S, Mayer C, Basquin J, Seraphin B, Suck D. Embo J. 2001;20:2293–2303. doi: 10.1093/emboj/20.9.2293. [DOI] [PMC free article] [PubMed] [Google Scholar]
- 17.Schumacher MA, Pearson RF, Moller T, Valentin-Hansen P, Brennan RG. Embo J. 2002;21:3546–3556. doi: 10.1093/emboj/cdf322. [DOI] [PMC free article] [PubMed] [Google Scholar]
- 18.Amero C, Asuncion Dura M, Noirclerc-Savoye M, Perollier A, Gallet B, Plevin MJ, Vernet T, Franzetti B, Boisbouvier J. J. Biomol. NMR. 2011;50:229–236. doi: 10.1007/s10858-011-9513-5. [DOI] [PubMed] [Google Scholar]
- 19.Stoffregen MC, Schwer MM, Renschler FA, Wiesner S. Structure. 2012;20:573–581. doi: 10.1016/j.str.2012.02.012. [DOI] [PubMed] [Google Scholar]
- 20.Goto NK, Gardner KH, Mueller GA, Willis RC, Kay LE. J. Biomol. NMR. 1999;13:369–374. doi: 10.1023/a:1008393201236. [DOI] [PubMed] [Google Scholar]
- 21.Ayala I, Sounier R, Use N, Gans P, Boisbouvier J. J. Biomol. NMR. 2009;43:111–119. doi: 10.1007/s10858-008-9294-7. [DOI] [PubMed] [Google Scholar]
- 22.Hesslinger C, Fairhurst SA, Sawers G. Mol. Microbiol. 1998;27:477–492. doi: 10.1046/j.1365-2958.1998.00696.x. [DOI] [PubMed] [Google Scholar]
Associated Data
This section collects any data citations, data availability statements, or supplementary materials included in this article.
Supplementary Materials
miscellaneous_information