

Abstract
We demonstrate for 24 metal oxide (MOx) nanoparticles that it is possible to use conduction band energy levels to delineate their toxicological potential at cellular and whole animal levels. Among the materials, the overlap of conduction band energy (Ec) levels with the cellular redox potential (−4.12 to −4.84 eV) was strongly correlated to the ability of Co3O4, Cr2O3, Ni2O3, Mn2O3 and CoO nanoparticles to induce oxygen radicals, oxidative stress and inflammation. This outcome is premised on permissible electron transfers from the biological redox couples that maintain the cellular redox equilibrium to the conduction band of the semiconductor particles. Both single parameter cytotoxic as well as multi-parameter oxidative stress assays in cells showed excellent correlation to the generation of acute neutrophilic inflammation and cytokine responses in the lungs of CB57 Bl/6 mice. Co3O4, Ni2O3, Mn2O3 and CoO nanoparticles could also oxidize cytochrome c as a representative redox couple involved in redox homeostasis. While CuO and ZnO generated oxidative stress and acute pulmonary inflammation that is not predicted by Ec levels, the adverse biological effects of these materials could be explained by their solubility, as demonstrated by ICP-MS analysis. Taken together, these results demonstrate, for the first time, that it is possible to predict the toxicity of a large series of MOx nanoparticles in the lung premised on semiconductor properties and an integrated in vitro/in vivo hazard ranking model premised on oxidative stress. This establishes a robust platform for modeling of MOx structure-activity relationships based on band gap energy levels and particle dissolution. This predictive toxicological paradigm is also of considerable importance for regulatory decision-making about this important class of engineered nanomaterials.
Keywords: Metal oxide nanoparticles, band gap energy, surface dissolution, oxidative stress, in vitro and in vivo toxicity
We and others have previously demonstrated that the ability of metal and metal oxide (MOx) nanoparticles to generate oxygen radicals and oxidative stress constitutes one of the principal injury mechanisms through which engineered nanomaterials (ENMs) can induce adverse health effects.1–6 Moreover, we have demonstrated that the induction of oxidative stress by nanoparticles is a multi-tier event in which the generation of antioxidant defense (Tier 1) precedes the activation of pro-inflammatory (Tier 2) and cytotoxic (Tier 3) responses at higher levels of oxidative stress.7–9 The elucidation of the hierarchical oxidative stress paradigm allowed us to develop a multi-parameter, high throughput screening (HTS) assay that assesses cellular oxygen radical generation, calcium flux, mitochondrial depolarization and cytotoxicity in a time and dose-dependent fashion.2, 10, 11 This assay, performed by fully automated robotic equipment and epifluorescence microscopy, allows HTS of large batches of nanoparticles in a single experiment. High content data generation at multiple time points and a wide range of particle doses provides rich data sets for in silico hazard ranking (e.g., heat maps) as well as understanding the relationship of nanoparticle physicochemical properties to cellular oxidant injury potential.
MOx nanoparticles represent is an industrially important category of nanomaterials that is produced in high volume and frequently used for their semiconducting properties, including as catalysts for redox reactions in engineered systems and natural environments.12–14 From a biological perspective, these semiconducting properties could be responsible for generating adverse health outcomes, as suggested by the acute inflammatory effects of metal oxide welding fumes in the lungs of welders or the rodent lung during deliberate exposure.15, 16 Moreover, epidemiological data indicate that chronic metal oxide exposures can lead to pneumoconiosis (such as by aluminium oxide and iron oxide).17, 18 Not only can oxide semiconductors serve as conduits for electron transfers between aqueous reactants, but the occurrence of these transfers is dependent on similarities in the energetic states of the nanomaterials and ambient redox-active aqueous substances. While the relevant energy levels for the semiconductor are the top of the valence band (Ev) and the bottom of the conduction band (Ec), the relevant energy level for aqueous substances are their standard redox potential (E0).19 Thus, the feasibility that electron transfers will take place between the semiconductor and redox-active bystanders is the relative energetics of Ev or Ec versus E0. Extrapolation of this concept to oxide nanoparticles that are introduced into an aqueous biological environment, such as the cellular interior, should consider the role of material band gap in relation to the energy levels of the biomolecular redox couples that maintain the cellular redox potential in the range of −4.12 to −4.84 eV.20 Burello and Worth have recently suggested a theoretical framework in which the relationship between the cellular redox potential to MOx band gap could explain why some of these materials generate oxidative stress and toxicity.21, 22 According to this band gap hypothesis, the reasoning is that it should be possible to predict the oxidative stress potential of MOx nanoparticles by comparing the Ev and Ec levels to the cellular redox potential. Thus, when the biological and material energetic states are similar, the permissive electron transfers could lead to formation of oxidizing or reducing substances that decrease the levels of antioxidants and/or increase the production of reactive oxygen species (ROS) and/or oxidized biological materials. 21, 22 This concept dovetails with our hierarchical oxidative stress hypothesis, which is premised on the concept that the Tier 1 response attempts to maintain and restore the cellular redox equilibrium by increased expression of glutathione and other redox-active substances following the activation of the Nrf2- pathway.7, 23, 24 If, however, this defense is overwhelmed by an escalating amounts of ROS, the cellular response shifts to activation of pro-inflammatory signaling cascades and ultimately to mitochondrial-mediated cell death. 7, 23, 24 These injurious oxidative stress effects also manifest as pulmonary inflammation during inhalation exposure or particle instillation in the lung.1–6
In addition to the possible contribution of MOx surface energy states, it is important to consider the contribution of dissolution and metal ion shedding to nanoparticle toxicity.25 The driving force for dissolution depends on the metal solubility in a given biological environment as well as the concentration gradient between the particle surface and the bulk solution. While for highly soluble materials, like ZnO, the major toxicological impact is the release of metal ions,1,26 we also need to consider that for less soluble materials both the catalytic nanoparticle surface as well as ion release could contribute to the toxicity and ROS generation.25 Moreover, it is important to consider that MOx dissolution depends on redox potential and that it is possible to distinguish reduction/dissolution as well as oxidation/dissolution reactions.25
In consideration of the complementary ideas discussed above, we set out to determine whether the expression of the valence and conduction band energies of 24 MOx nanoparticles in relation to the cellular redox potential (−4.12 to −4.84 eV) could be used to compare their performance in our multi-parametric HTS assay for oxidative stress 2, 10, 11 as well as in acute pulmonary inflammation in C57 Bl/6 mice. We were also interested to see whether the use of in silico hazard ranking and other statistical tools 27, 28 can be used to establish a predictive toxicological paradigm in which in vitro toxicological ranking predicts the in vivo toxicological outcome. Out data demonstrate that it is indeed possible to predict the in vitro as well as in vivo toxicity of the selected oxide nanoparticles based on Ec as well as the materials’ dissolution characteristics, thereby establishing a predictive toxicological paradigm that can be used for modeling of MOx toxicity.
RESULTS
Acquisition and physicochemical characterization of MOx nanoparticles to determine band gap energy versus biological redox potential
Twenty four MOx nanoparticles, which covers representative oxides across the periodic table, were chosen for the study premised on Ec energy levels that are higher, in the range of or lower than the cellular redox potential (−4.12 to −4.84 eV). Ec was chosen because this represents the lowest unoccupied molecular orbital that participates in electron transfers from and to the MOx surface, while the valence band is usually occupied.19, 21, 22 Thus, if the cellular redox potential is higher than the conduction band edge of the MOx, the direct electron transfer from the aqueous electron donor to the Ec can proceed.19, 21, 22 Alternatively, electrons injected from an aqueous donor could be transferred to the nanoparticle and from there to a series of ambient electron acceptors until a steady state is reached. While a few of the materials were synthesized in-house by flame spray pyrolysis (CuO, Co3O4, Fe3O4, Sb2O3, TiO2, WO3 and ZnO), which allowed control over the primary particle size, the majority of the materials were acquired from commercial sources (Table 1), where it was not always possible to specify the the specific particle size. Primary particle sizes, as determined by TEM, were in the range 10–100 nm, except for Cr2O3 and Ni2O3 that were much larger, exhibiting sizes of 193±90.0 and 140.6±52.5 nm, respectively (Supplementary Information, Figure S1). The crystallinity of these materials was determined by XRD, which showed that most particles were of high quality, exhibiting single crystalline phases and without noticeable contaminants (Supplementary Information, Table S1). Ni2O3 and Fe3O4 are the only two exceptions, in which a small fractions of other crystalline phases were detected (i.e., NiO in Ni2O3 and Fe2O3 in Fe3O4).
Table 1.
Commercial source information for metal oxide nanoparticles.
| Metal oxide NPs | Source | Catalogue number |
|---|---|---|
| Al2O3 | Meliorium Technologies | Al2O3 NPs, 10 nm |
| CeO2 | Meliorium Technologies | CeO2 NPs, 8 nm |
| CoO | SkySpring Nanomaterials | 2310SC |
| Cr2O3 | US Research Nanomaterials, Inc. | US3060 |
| Fe2O3 | US Research Nanomaterials, Inc. | US3200 |
| Gd2O3 | Nanostructured & Amorphous Materials, Inc. | 2681RE |
| HfO2 | US Research Nanomaterials, Inc. | US3245 |
| In2O3 | US Research Nanomaterials, Inc. | US3250 |
| La2O3 | Nanostructured & Amorphous Materials, Inc. | 2920RE |
| Mn2O3 | Nanostructured & Amorphous Materials, Inc. | 3610FY |
| NiO | Sigma-Aldrich | 637130 |
| Ni2O3 | SkySpring Nanomaterials | 5420SC |
| SiO2 | Nanostructured & Amorphous Materials, Inc.US | 4850MR |
| SnO2 | Research Nanomaterials, Inc. | US3460 |
| Y2O3 | Meliorium Technologies | Y2O3 NPs, 8–10 nm |
| Yb2O3 | MKNano | MKN-Yb2O3-090 |
| ZrO2 | US Research Nanomaterials, Inc. | US3600 |
Assessment of the hydrodynamic sizes by DLS in water as well as BEGM and DMEM tissue culture media, demonstrated hydrodynamic sizes below 340 nm, which reflects the dispersal effect of BSA or 10% fetal calf serum (FCS), respectively (Table 2). Band gap energy was measured by UV-Vis spectroscopy, while conduction (Ec) and valence (Ev) band energies were calculated (Table 3) using equations 1 and 2 as shown in the Materials and Methods section. 19, 21, 22 All the energy levels, including cellular redox potential, were expressed according to the absolute vacuum scale (Fig. 1). According to this band gap profiling, six of the 24 nanomaterials (TiO2, Ni2O3, CoO, Cr2O3, Co3O4 and Mn2O3) showed potential overlap of Ec with the redox interval between −4.12 to −4.84 eV and were therefore predicted to participate in electron transfers between the particle surfaces and biological redox couples that maintains the cellular homeostasis.29, 30
Table 2.
Primary and hydrodynamic sizes of metal oxide nanoparticles.
| Metal oxide Nanoparticles | Size (nm)
|
|||
|---|---|---|---|---|
| Primary | Water | BEGM | DMEM | |
| Al2O3 | 14.7±5.2 | 282.9±3.7 | 260.4±16.9 | 230.5±6.6 |
| CuO | 12.8±3.4 | 263.3±4.5 | 305.3±5.6 | 313.8±4.9 |
| CeO2 | 18.3±6.8 | 197.6±7.0 | 261.6±7.3 | 248.4±2.2 |
| Co3O4 | 10.0±2.4 | 174.5±4.1 | 222.7±4.4 | 230.3±4.5 |
| CoO | 71.8±16.2 | 184.8±11.4 | 208.3±5.4 | 191.6±7.1 |
| Cr2O3 | 193.0±90.0 | 256.4±5.4 | 316.9±5.6 | 318.7±7.9 |
| Fe2O3 | 12.3±2.9 | 144.7±2.7 | 206.3±6.8 | 196.6±4.3 |
| Fe3O4 | 12.0±3.2 | 198.4±4.1 | 256.6±9.3 | 243.6±5.3 |
| Gd2O3 | 43.8±15.8 | 195.7±4.3 | 227.4±4.6 | 222.0±4.9 |
| HfO2 | 28.4±7.3 | 291.8±11.2 | 307.7±4.3 | 280.6±1.6 |
| In2O3 | 59.6±19.0 | 192.2±2.1 | 259.8±1.2 | 244.5±2.5 |
| La2O3 | 24.6±5.3 | 211.0±10.5 | 155.1±9.3 | 162.6±2.0 |
| Mn2O3 | 51.5±7.3 | 286.8±2.8 | 298.4±9.4 | 291.7±11.9 |
| NiO | 13.1±5.9 | 228.0±5.7 | 202.8±3.0 | 189.5±3.1 |
| Ni2O3 | 140.6±52.5 | 311.4±7.1 | 339.5±9.9 | 322.6±13.6 |
| Sb2O3 | 11.8±3.3 | 147.6±1.8 | 274.9±19.3 | 195.5±3.1 |
| SiO2 | 13.5±4.2 | 113.4±4.2 | 181.9±8.9 | 46.4±1.0 |
| SnO2 | 62.4±13.2 | 203.7±4.7 | 242.5±5.0 | 198.0±7.9 |
| TiO2 | 12.6±4.3 | 166.0±6.3 | 109.2±8.8 | 55.9±1.2 |
| WO3 | 16.6±4.3 | 176.6±1.8 | 196.1±2.5 | 198.5±2.2 |
| Y2O3 | 32.7±8.1 | 312.2±15.4 | 332.2±9.0 | 351.6±8.9 |
| Yb2O3 | 61.7±11.3 | 230.7±1.8 | 296.1±5.7 | 235.6±3.6 |
| ZnO | 22.6±5.1 | 204.5±15.1 | 114.7±10.5 | 69.4±0.4 |
| ZrO2 | 40.1±12.6 | 306.5±10.3 | 314.3±9.9 | 312.3±10.2 |
Table 3.
Parameters for calculation of band energy of metal oxide nanoparticles.
| Metal oxide nanoparticles | χoxide(eV) | Eg, measured (eV) | PZZP | Ec | Ev |
|---|---|---|---|---|---|
| Al2O3 | 5.67 | 8.30 | 7.4 | −1.51 | −9.81 |
| CuO | 5.87 | 1.34 | 7.9 | −5.17 | −6.51 |
| CeO2 | 5.65 | 3.65 | 7.8 | −3.80 | −7.45 |
| Co3O4 | 5.93 | 2.43 | 9.4 | −4.59 | −7.02 |
| CoO | 5.74 | 2.41 | 9.2 | −4.42 | −6.83 |
| Cr2O3 | 5.86 | 3.08 | 5.3 | −4.44 | −7.52 |
| α-Fe2O3 | 5.98 | 1.99 | 7.2 | −4.99 | −6.99 |
| Fe3O4 | 5.78 | 1.85 | 5.0 | −5.00 | −6.85 |
| Gd2O3 | 5.50 | 5.28 | 8.0 | −2.83 | −8.10 |
| HfO2 | 5.71 | 5.41 | 8.1 | −2.96 | −8.37 |
| In2O3 | 5.58 | 3.69 | 9.2 | −3.63 | −7.32 |
| La2O3 | 5.38 | 5.77 | 9.4 | −2.38 | −8.15 |
| Mn2O3 | 5.92 | 2.99 | 3.7 | −4.65 | −7.63 |
| NiO | 5.74 | 3.88 | 11.4 | −3.57 | −7.45 |
| Ni2O3 | 6.05 | 3.38 | 8.3 | −4.31 | −7.69 |
| Sb2O3 | 5.51 | 4.49 | 1.0 | −3.64 | −8.14 |
| SiO2 | 6.19 | 9.10 | 1.0 | −2.02 | −11.12 |
| SnO2 | 5.81 | 4.00 | 4.0 | −4.01 | −8.01 |
| TiO2(Anatase) | 5.77 | 3.33 | 6.4 | −4.16 | −7.49 |
| WO3 | 6.64 | 3.05 | 0.3 | −5.53 | −8.59 |
| Y2O3 | 5.41 | 5.85 | 9.6 | −2.35 | −8.20 |
| Yb2O3 | 5.43 | 5.10 | 8.2 | −2.83 | −7.93 |
| ZnO | 5.67 | 3.31 | 9.6 | −3.89 | −7.20 |
| ZrO2 | 5.62 | 5.04 | 5.8 | −3.19 | −8.23 |
Figure 1. The proposed relationship of bandgap energy to the cellular redox potential (−4.12 to −4.84 eV).

Conduction band (Ec) and valence band (Ev) were calculated according to the equation (1) and (2) described in Materials and Methods. Band gap energy (Eg) was measured by UV-Vis spectroscopy, absolute electronegativities (χoxide) were calculated using a set of equations reported by Portier et al. 59 Point of zero zeta potential (PZZP) was determined by measuring zeta potentials of each nanoparticle suspension over a wide pH range (typically 2–11). According to this band gap profiling, six of the 24 nanomaterials (TiO2, Ni2O3, CoO, Cr2O3, Co3O4 and Mn2O3) showed potential overlap of Ec with the cellular redox interval, and were therefore predicted to participate in electron transfers between the particle surfaces and the cellular redox couples. These band gap predictions are very close to those predicted by Burello, who calculated Ec and Ev by using the theoretical Eg,60 χoxide derived from Portier’s studies 59 as well as the PZZP reported in the literature.61 The toxicological predictions for TiO2, Ni2O3, CoO, Cr2O3, Co3O4, Mn2O3, CuO and Fe2O3, according to the latter set of calculations are shown in Figure S10.21
Single-parameter cellular toxicity testing using MTS, ATP and LDH assays
The cytotoxicity of the MOx nanoparticles was assessed by single-parameter assays in human bronchial epithelial (BEAS-2B) as well as murine myeloid (RAW 264.7) cell lines, using single parameter MTS, ATP and LDH assays. These assays were included because they are commonly used to screen for ENM cytotoxicity without reference to a specific mechanism. Following exposure to the selected nanoparticles over a wide dose range (400 ng/mL–200 μg/mL), performance of the MTS assay in BEAS-2B cells showed that seven oxide nanoparticles significantly decreased cell viability, with CuO, Mn2O3, CoO and ZnO NPs demonstrating a marked decline in cell viability while Co3O4, Cr2O3, Ni2O3 had lesser but still significant effects (Fig. 2A). The rest of the materials analyzed had no significant effect on cell viability (Fig. 2A). Almost identical results were seen in RAW cells (Fig. S2A). The ATP assay confirmed the results of the MTS assay, showing a dose-dependent decline in the cellular energy levels in response to Co3O4, Cr2O3, Ni2O3, CuO, Mn2O3, CoO and ZnO, with the rest of the materials not showing any significant effect (Fig. 2B, Fig. S2B). In contrast, the LDH assay showed a robust increase in membrane leakage in response to CuO, Mn2O3, CoO and ZnO in both cell types, while Co3O4, Cr2O3, Ni2O3 had lesser but still significant effects (Fig. 2C, Fig. S2C). The rest of the materials did not exert a significant effect on cellular viability. All considered, there was excellent correlation between the different cellular methods for nanoparticle toxicity assessment.
Figure 2. Single-parameter toxicological screening of MOx nanoparticles in BEAS-2B cells.

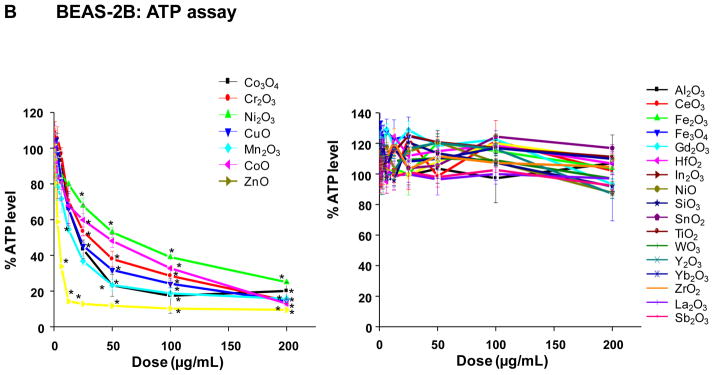
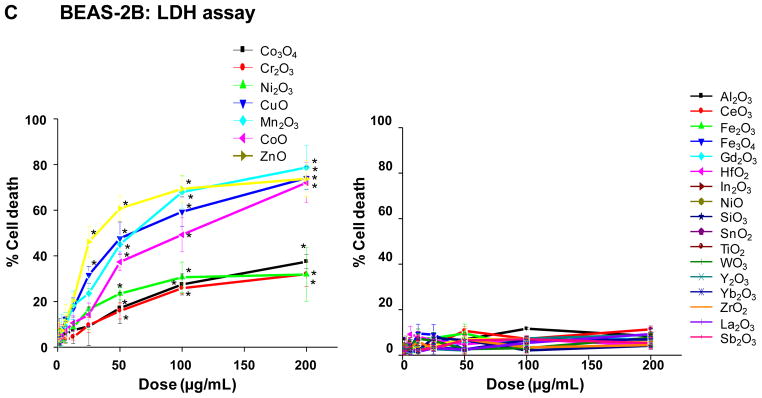
A) MTS assay; B) ATP assay; C) LDH assay. This experiment was performed by introducing a wide dose range (400 ng/mL – 200 μg/mL) of each material to 10,000 of cells grown in 96-well plates overnight and then performing the assays with commercial kits as described in Materials and Methods. The left hand panels show the profiles of particles with significant toxicity while the right hand panels show the profiles of non-toxic materials. Comparable data for RAW 264.7 cells appear in the Supplementary information section, Figure S2.
Calculation of the slopes of the dose response relationships in the MTS and ATP assays demonstrated that Co3O4, Cr2O3, Ni2O3, CuO, Mn2O3, CoO and ZnO resulted in slopes that are significantly steeper than the rest of the materials in both cell types (Fig. 3). These slopes were used for calculating the corresponding LogEC50 values, which confirmed that the materials with steeper dose response relationships exhibit statistically significantly lower EC50 values than the rest of the materials (Supplementary Information Table S2). Thus, the calculated Log EC50 values of Co3O4, Cr2O3, Ni2O3, CuO, Mn2O3, CoO and ZnO nanoparticles were <3.71 with relatively small standard deviations (≤0.67) while the rest of the materials showed large or infinite values. Although there was a trend towards lower Log EC50 values for NiO, Y2O3 and SnO2, these results were not statistically significant and were accompanied by large standard deviations.
Figure 3. Calculation of the dose response dose slopes for the MTS and ATP assays in BEAS-2B and RAW 264.7 cell lines.

The data for the MTS and ATP assays in Fig. 2 were first normalized and then used to calculate the slopes for all the nanoparticles using a sigmoid dose-response function. The slopes of Co3O4, Cr2O3, Ni2O3, CuO, Mn2O3, CoO and ZnO are significantly steeper than the rest of the nanoparticles. The slopes were also used to calculate the corresponding LogEC50 values as shown in Table S2.
Multi-parameter toxicity testing show an excellent prediction with band gap overlap
We also performed in vitro toxicological analysis utilizing our automated multi-parametric HTS assay, which have been developed to assess a functionally interrelated group of Tier 3 oxidative stress responses as previously described.2, 10, 11 Details of the assay are recapitulated in Fig. S3 and Table S3. This multi-parameter fluorescence assay quantitatively assesses changes in ROS production (DCF and MitoSox red fluorescence), intracellular calcium flux (Fluo-4 fluorescence), mitochondrial membrane potential (JC-1 fluorescence) and surface membrane permeability (PI uptake) in BEAS-2B and RAW 264.7 cells (Fig. S3). The particles were introduced over the dose range of 400 ng/mL to 200 μg/mL and above responses were contemporaneously assessed at hourly intervals for 1–6 and again at 24 h. The assay utilizes experimentally determined fluorescence threshold values to score the % cells with supra-threshold intensities as detailed in Materials and Methods. 2, 10, 11 The rich data sets (e.g., 36,960 data points for each cell type in Fig. 4) were statistically analyzed through the strictly standard mean deviation (SSMD) method 11, 27, 28 to generate a heat map in which a red display signifies significant toxicity while green represents no significant change (Fig. 4). This display ranked the 24 included materials into two major categories, namely a group of seven nanoparticles (Co3O4, Cr2O3, Ni2O3, CuO, Mn2O3, CoO and ZnO) with robust and comparable multi-parameter responses in both cell types while the rest of the materials showed lesser or no effects (Fig. 4A and 4B). While most of the robust response parameters included increased PI uptake, MitoSox Red and JC-1 fluorescence, CuO and ZnO nanoparticles induced stronger intracellular calcium flux that did not feature as prominent for other particle types. We also constructed a Pearson correlation matrix to assess the degree of correlation between the different response parameters in the HTS assay (Fig. S4). The results show that PI, Fluo-4, MitoSox Red, and JC-1 fluorescence shows strong correlation co-efficiencies within each cell type, as well as between cell types, demonstrating a high degree of consistency among these phenotypes.
Figure 4. Heat maps to compare the toxic oxidative stress potential of MOx nanoparticles in BEAS-2B and RAW264.7 cells using the multi-parameter HTS assay.


A) Heat map for BEAS-2B cells. B) Heat map for RAW cells. The heat maps were established using SSMD statistical analysis to evaluate the supra-threshold cellular responses by automated epifluorescence microscopy in the high throughput screening laboratory. The response parameters included measurement of intracellular calcium flux (Fluo-4), ROS generation (MitoSox Red and DCF) and mitochondrial membrane depolarization (JC-1). Cells were treated with a wide dose range of MOx nanoparticles, beginning at 400 ng/ml and then doubling the dose up to 200 μg/mL. Epifluorescence images were collected hourly for the first 6 h and then again that 24 h. The rationale of the assay and the addition of the cocktails according to the layout of the individual 384 plates are explained in Supplementary Information Fig. S3. The utility of these dyes, their excitation/emission wavelengths, and response profiling are explained in Supplementary Information Table S3.
In order to reconcile the data in the single and multi-parameter assays, we performed a principal components analysis (PCA) of the full data set (Fig. S4). This analysis confirmed strong correlation between PI, Fluo-4, MitoSox Red, JC-1, LDH, MTS and ATP and the first principal component of variation. Thus, there was a good agreement between the multi-parameter and single parameter responses, confirming that Co3O4, Cr2O3, Ni2O3, CoO, Mn2O3, CuO and ZnO nanoparticles are potentially more hazardous in general toxicity assays as well as during comparative analysis of their oxidative stress effects in the multi-parameter assays. Equally important, the toxicity of five of these materials (with the exception of CuO and ZnO) were predicted by the Ec overlap with the cellular redox potential (Fig. 1).
In vivo toxicity testing shows an excellent correlation between in vitro toxicological analysis and development of pulmonary inflammation in the mouse
Although there was an excellent correlation between single parameter and multi-parameter in vitro toxicity assays, the major goal of a predictive toxicological exercise is to demonstrate the correlation of the in vitro results with toxicological outcomes in vivo.7, 9 While a number of studies have demonstrated that the propensity of nanomaterials like oxide nanoparticles to induce ROS production and oxidative stress at cellular level and the intact lung 3–6 it has been difficult to demonstrate a robust relationship between the in vitro and in vivo toxicological assays for a variety of reasons, including selection of the toxicological parameters that are not directly comparable. However, we know that transcriptional activation of the nuclear factor (NF)-κB and activator protein-1 (AP-1) response elements downstream of the oxidative stress triggered NF-κB and the MAP kinase signaling cascades is involved in cytokine and chemokine production,24, 31 which could result in acute pulmonary inflammation. Moreover, assessment of pulmonary inflammation has been used as a platform for comparing the toxicity of MOx nanoparticles.1, 3, 4, 26, 32 We were interested therefore, to see how the assessment of acute pulmonary inflammation in the mouse model compares to the in vitro toxicity assays and the material band gap predictions. Because of logistical reasons (number of animals in one experiment) it was not possible to perform experimentation on all the MOx nanoparticles assayed in vitro, we used two experiments to compare in each a number of nanoparticles from the predicted high (Co3O4, Cr2O3, Ni2O3, CuO, Mn2O3 and CoO nanoparticles) with the predicted low (Y2O3, ZrO2, CeO2, HfO2, In2O3, NiO, Fe2O3 and Fe3O4), toxicological categories (Fig. 5, Fig. S6). ZnO was not included in these animal studies because we have previously demonstrated its acute pro-inflammatory potential in a murine model based on its ability to induce oxidative stress.1, 26 In the first set of experiments, we compared the acute pro-inflammatory effects of 20 μg of Co3O4, Cr2O3, with the same amount of CuO with NiO, Fe2O3 and Fe3O4 nanoparticles, which were oropharyngeally instilled (Fig. 5, experiment 1). This dose was chosen based on preliminary dose-response analysis of a limited number of materials, which demonstrated that 20 μg falls on the steep part of the dose-response curve.1, 26 The mice were sacrificed after 40 hr and bronchoalveolar lavage (BAL) fluid was collected for the performance of differential cell counts as well as measuring cytokine and chemokine levels. The data demonstrated that Co3O4, Cr2O3, and CuO induced statistically significant (p <0.05) increases in neutrophil cell counts (Fig. 5A), MCP-1 (Fig. 5B) and IL-6 (Fig. 5B) levels compared to NiO, Fe2O3 and Fe3O4. Moreover, ELISA microarray analysis of the BAL fluid by the Pacific Northwest Laboratory confirmed that in addition to our in-house cytokine assays at least 10 cytokines and chemokines were significantly increased in response to the materials with the predictive higher toxicological potential (not shown). Similarly, in the second experiment, particles with a predictive higher toxicological potential (Mn2O3, CoO and Ni2O3) showed statistically significant increases in neutrophil, MCP-1 and IL-6 levels compared to Y2O3, ZrO2, CeO2, HfO2, and In2O3 (Fig. 5A–C). Figure S6 shows the integrated data set for all the animal experiments and confirms the excellent agreement of the pulmonary with the in vitro toxicological outcomes, namely that Co3O4, Cr2O3, Ni2O3, CuO, Mn2O3, CoO and ZnO have a higher toxicological potential than other MOx nanoparticles.
Figure 5. Acute metal oxide toxicity in the lungs of CB57 BL/6 mice.

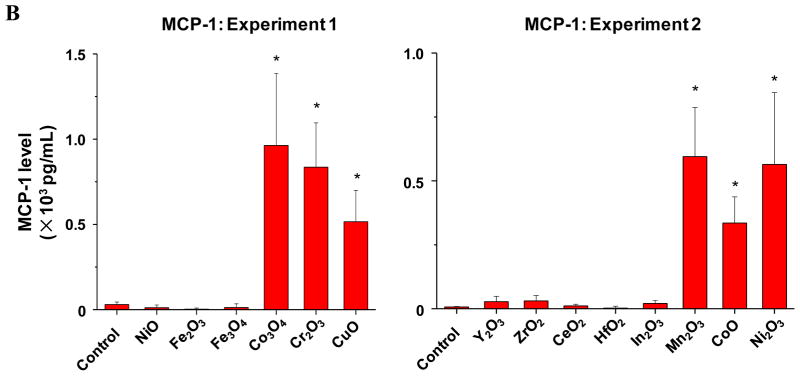
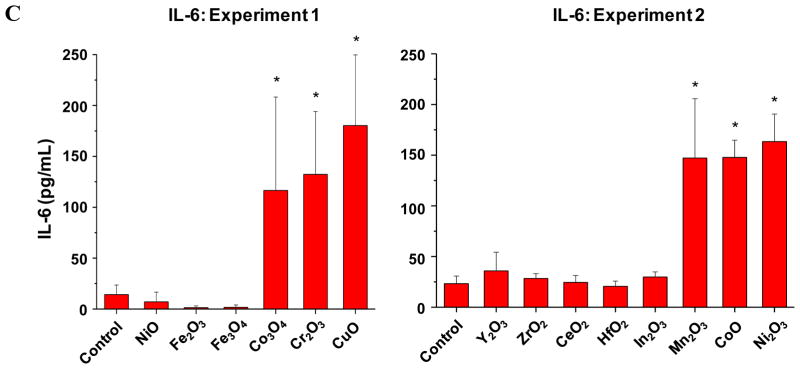
A) Neutrophil counts in BAL; B) MCP-1 level. C) IL-6 level. Two experiments were performed to compare small groups of materials with predicted low and high toxicological potential according to the in vitro assays. In the first experiment, the predicted toxic Co3O4, Cr2O3 and CuO nanoparticels were compared with predicted less toxic NiO, Fe2O3 and Fe3O4 nanoparticles. In the second experiment, the predicted toxic Mn2O3, CoO and Ni2O3 nanoparticles were compared with predicted less toxic Y2O3, ZrO2, CeO2, HfO2, and In2O3 nanoparticles. The mice received 20 μg of each of the nanoparticles by oropharyngeal installation, followed by sacrifice at 40 hours. Bronchoalveolar lavage (BAL) fluid was collected for the performance of differential cell counts as well as measuring cytokine and chemokine levels. *: p<0.05 compared with control.
The comparison of materials with predictive high and low toxicological potential was also carried out by using “normalized toxicological size effects” in vivo and in vitro (Fig. 6A and Fig. S7). The in vivo size effect was defined by a T-statistic value that analyzes the difference between the mean neutrophil cell counts in MOx-exposed vs non-exposed animals. The in vitro effect size was defined as the expected probability of cytotoxicity according to the classification tree model that is described in Materials and Methods as well as the next section. This regression model assigns a number between 0–1 for each nanoparticle, with “1” meaning 100% confidence of a cytotoxic effect and “0” meaning no chance. In this comparative analysis, nanoparticles with an in vitro toxicological probability > 50% (Cr2O3, Mn2O3, CoO, CuO, Ni2O3, Co3O4) were statistically more likely to induce a high neutrophil response in the animal lungs (Fig. 6A). Similar results were obtained in the analysis of the IL-6 and MCP-1 data (Fig. S7). Further demonstration that differences in the toxicological outcomes reflect the materials’ oxidative stress potential was provided by performing Western blotting analysis of the lungs of the animals in experiment 1 to look at expression of heme oxygenase 1 (HO-1), a sensitive tier 1 oxidative stress marker (Fig. 6B). Thus, while Co3O4, Cr2O3, and CuO induced HO-1 expression, the same response was not seen with NiO, Fe2O3 and Fe3O4. In contrast, there was no change in the expression of the household gene, β-actin (Fig. 6B). These results agree with the in vitro multi-parameter data.
Figure 6. In vivo toxicity validation for in vitro predicted probability and differential oxidative stress potentials in lung tissues.

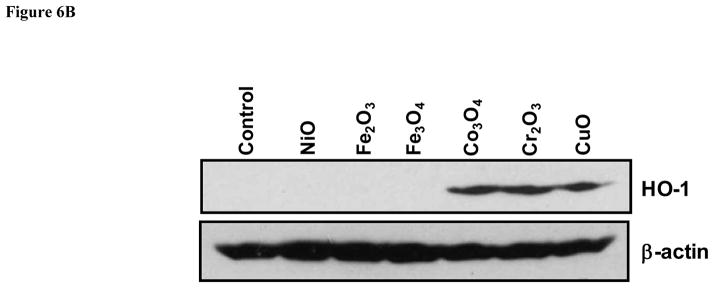
A) In vitro to in vivo toxicity prediction. The in vivo effect size was defined by a T-statistic value that analyzes the difference between the mean neutrophil cell counts of MOx-exposed vs non-exposed animals as shown in Figure 5A. The in vitro effect size was defined as the predicted probability of cytotoxicity according to the classification tree model as described in Materials and Methods. Large values of the T-test statistic indicate large mean differences between exposed and control mice, whereas large values for probability indicate nanoparticles that are likely toxic. The predicted probability of in vitro toxicity vs. the T-statistic of the in vivo toxicity data was plotted to compare the toxicity difference. The dot colors reflect the toxicological potential over a graded scale varying from yellow to red. B) Heme oxygenase 1 (HO-1) expression in the lung tissue of mice. The toxicological differences reflect the different materials’ oxidative stress potential in experiment 1 (as shown in Figure 5) were provided by performing Western blotting analysis of the lungs of the animals to show the expression of heme oxygenase 1 (HO-1).
Assessment of MOx nanoparticle dissolution demonstrates that the high dissolution rates of ZnO and CuO is associated with MOx toxicity independent of Ec levels
While the predictions premised on Ec overlap with the cellular redox potential (Fig. 1) shows excellent correlation to the toxicological assessment for five of six materials in vitro (Figs. 2 and 4) as well as in vivo (Fig. 5), ZnO and CuO were associated with significant cellular and lung toxicity, yet do not exhibit band gap overlap in accordance with the calculations in Fig. 1. We have previously shown that ZnO toxicity depends on nanoparticle dissolution,1, 26 suggesting that band gap energy is not required for promoting oxidative stress injury in vitro and in vivo. Since CuO is also a dissolvable nanomaterial, we used ICP-MS analysis to compare the dissolution of the full panel of MOx nanoparticles in water, BEGM and DMEM. The results, which are displayed in Fig. 7A, indicate that among the seven materials exhibiting predictive in vitro and in vivo toxicological potential, only ZnO and CuO dissolved by ~ 10 % or more in tissue culture media. Thus, ZnO dissolution amounted to 33.7±0.4% and 37.2±0.9%, respectively, in BEGM and DMEM, while the comparable percentages for CuO were 17.9±0.2% and 9.4±0.8%, respectively. Only CoO among the predicted toxic nanoparticles showed significant metal shedding, amounting to 3.4 and 2.9 %, respectively, in BEGM and DMEM. Co3O4, Cr2O3, Ni2O3 and Mn2O3 nanoparticles yielded dissolution percentages <1%.
Figure 7. Assessment of metal dissolution of metal oxide nanoparticles and regression tree analysis for the toxicological impact of metal dissolution versus conduction band energy.


A) The graph shows the % of metal dissolution for the individual nanoparticles in different incubation media. The analysis was performed by suspending 200 μg/mL of each of the nanoparticles in deionized water or cell culture medium, followed by incubation at room temperature for 24 h. The supernatants were collected by centrifugation at 20,000 x g for 30 min and digested by concentrated nitric acid at 90 °C for 3 h. The well-digested solutions were dried by evaporation at 120 °C, and dissolved in 3 mL of 5% nitric acid for ICP-MS measurement. B) Toxicological impact of metal dissolution versus conduction band energy. Cytotoxic potential of nanoparticles was defined by the area under normalized dose-response curve in LDH assay. A regression tree model was used to define recursive partitions in the dissolution and Ec domains aimed at characterizing regions amongst possible values of the particle descriptors where nanoparticle cytotoxicity is relatively homogenous. The model shows that partitioning premised on a % dissolution > 13.05 isolates ZnO and CuO as dissolvable materials that are also toxic or highly toxic. In contrast, nanoparticles with a dissolution < 13.05%, could be partitioned according to their Ec values, according to which particles with an Ev of −4.2 to −4.8 eV are those that exhibited higher toxicity in the LDH assay.
In order to display the toxicological impact of band gap versus material dissolution, a regression tree was constructed to display these predictors as non-linear functions superimposed on actual toxicological outcome as determined by the single parameter assays (LDH, MTS, ATP, PI). A parameter representing the nanoparticles’ toxicological outcome was then used for partitioning these materials toxicological profiles according to a display of Ec values versus % metal dissolution (Fig. 7B). Each nanoparticle’s toxicological performance was calculated by computing the area under the LDH dose response curve, which was then used for classifying their toxicity. In the example shown in Fig. 7B, MOx toxicity is classified according a graded color scale varying from safe to toxic. Superimposition of these categories on the Ec versus % metal dissolution grid resulted in a regression tree that partitions the materials according to their dissolution and energy levels. The display in Fig. 7B shows that using a % dissolution >13.05 % led to the isolation of ZnO and CuO as dissolvable materials, which both performed in the highly toxic category. However, for nanoparticles with dissolution < 13.05%, there was more heterogeneity. Thus, nanoparticles with an eV between −4.2 to −4.8 (Cr2O3, CoO, Co3O4, Ni2O3 and Mn2O3) belong to the category of toxic or highly toxic materials, which is in good agreement with the band gap predictions in Fig. 1. In contrast, low solubility nanomaterials with an eV above or below this redox interval showed little or no toxicity. Similar results were obtained when using the steepness of the dose response curve for making the comparisons. In summary, the regression tree delineates two groups of toxic materials, namely materials with a high % of metal shedding (ZnO and CuO) as well as less soluble materials that exhibit Ec values that overlap with biological redox potential. Similar results were obtained when constructing regression trees from the data obtained from the MTS, ATP and PI assays (not shown).
MOx nanoparticles and metal ions selectively affect the cytochrome c as an example of one of the redox couples that determine the cellular redox potential
According to the band gap hypothesis,21, 22 nanoparticles with Ec values that overlap with the cellular redox potential could engage in electron transfers to and from the redox couples that maintain the cellular redox potential (Fig. 8A). To confirm this hypothesis, effects of the nanoparticles on redox couples were studied by spectroscopic methods. As a representative redox couple, cytochrome c-Fe3+/cytochrome c-Fe2+ was chosen for several reasons: (i) cytochrome c is an essential component of the mitochondrial electron transport chain, where ROS generation can take place; (ii) HTS screening demonstrated increased superoxide level (detected by MitoSox Red) in mitochondria; (iii) cytochrome c oxidation can be easily monitored by UV-vis spectroscopy that shows dual peaks (534 and 550 nm) for the reduced form while the oxidized form shows a single peak at 540 nm. Figure 8B & Figure S9 show examples of the changes of the UV-vis profiles of cytochrome c in response to all 24 nanoparticles. The top left-hand panel in Fig. 8B shows the UV-vis spectroscopy profile of reduced and oxidized cytochrome c; while the reduced form of this molecule exhibited two peaks at 534 and 550 nm, the oxidized version shows a single peak at 540 nm. These differences reflect the oxidation status of the heme group in this molecule (Fig. S8). Fig. 8B also demonstrates that while ZnO is incapable of oxidizing cytochrome c, CuO and Mn2O3 could convert the heme Fe2+ to Fe3+ (Fig. S8), resulting in a dose-dependent shift in the spectroscopic characteristics. This shift was used to quantify the % reduced cytochrome c, which demonstrated that in addition to CuO and Mn2O3, CoO, Co3O4, and Ni2O3 could also induce its oxidation (Fig. 8C). By contrast, TiO2 and Cr2O3 failed to do so. Additional UV-vis profiles are included in Fig. S9. Since we have attributed the toxicity of ZnO and CuO to their solubility, we were interested in comparing the effects of soluble ZnCl2 and CuCl2 on the cytochrome c redox status. Fig. 8D demonstrates that while CuCl2 is capable of oxidizing cytochrome c, ZnCl2 does not have the same potential. This suggests that CuO nanoparticle dissolution can impact cytochrome c’s the redox status independent of the effect of the material band gap. This is compatible with the literature data showing that Cu2+ can oxidize cytochrome c, being converted to Cu+ in the process.33, 34 All considered, these results demonstrate that among the MOx nanoparticles showing Ec overlap with the cellular redox potential (Co3O4, Cr2O3, Ni2O3, Mn2O3 and CoO), most materials are capable of oxidizing cytochrome c, with the exception of Cr2O3. Besides the cytochrome c-Fe3+/cytochrome c-Fe2+ redox couple, we also investigated NADP+/NADPH, using a similar spectroscopic approach. The result showed that Mn2O3 was capable of NADP oxidation (not shown). This suggests that individual redox couples may be selectively affected by individual oxide nanoparticles according to specific band gap levels. More work is required to develop a comprehensive understanding of the full range of interactions between oxide nanoparticles and biological redox couples.
Figure 8. Spectroscopic analysis of oxidation of reduced cytochrome c by toxic MOx nanoparticles and free metal ions.


A) Demonstration of the series of redox couples that contribute to the maintenance of the cellular redox potential in the range −4.12 eV to −4.84 eV. This includes the contribution of reduced/oxidized cytochrome c. B) UV-vis spectroscopy was performed to demonstrate the change in the redox state of cytochrome c (40 μM) in the absence (upper-left panel) or presence of ZnO (upper-right panel), CuO (lower-left panel) and Mn2O3 (lower-right panel) over a dose range of 400 ng/mL-50 μg/mL. Reduced cytochrome c shows two peaks at 534 and 550 nm while its oxidized version has a single peak at 540 nm. The presence of ZnO does not change the oxidation status while CuO and Mn2O3 nanoparticles could oxidize cytochrome c. C) Percent oxidation of reduced cytochrome c in the presence of metal oxide nanoparticles with predictive toxicity. While incremental doses of Co3O4, Ni2O3, CuO, Mn2O3, CoO nanoparticles could significant the decrease the % of reduced cytochrome c, Cr2O3, ZnO and TiO2 nanoparticles failed to do so. D) UV-vis spectroscopy looking at possible cytochrome c (40 μM) oxidation by soluble ZnCl2 and CuCl2 over the same dose range as for the nanoparticles in B). CuCl2 is capable of oxidizing cytochrome c while ZnCl2 does not have the same effect, demonstrating that Cu2+ ions can contribute to the nanoparticle effect on this redox couple.
DISCUSSION
In this paper we demonstrate for a core sample of 24 MOx nanoparticles that it is possible to use conduction band energy levels to delineate the role of a key semiconductor property in the generation of cellular oxidative stress and acute pulmonary inflammation. Overlap of the conduction band energy levels with the cellular redox potential was strongly correlated to the ability of Co3O4, Cr2O3, Ni2O3, Mn2O3 and CoO nanoparticles to induce ROS production, oxidative stress and pro-inflammatory effects in this predictive toxicological model. Both single as well as multi-parameter cellular assays showed strong correlation with the generation of acute neutrophilic inflammation and cytokine responses in the lungs of CB57 Bl/6 mice. The multi-parameter assay allows high throughput screening of an integrated series of sub-lethal and lethal cellular responses triggered by cellular oxidative stress.2, 10, 11 Co3O4, Ni2O3, Mn2O3 and CoO nanoparticles could also be shown to oxidize cytochrome c as a representative example of one of the redox couples that maintain the cellular redox potential in range −4.12 to −4.84 eV. These redox couples are also involved in the antioxidant defense of Tier 1 of the hierarchical oxidative stress response, and it is therefore of considerable interest that overlap of the energy states of redox couples with the conduction band of specific oxide nanoparticles could play a permissive role in determining ROS production and onset of oxidative stress. Among the materials showing Ec overlap with the cellular redox potential, only TiO2 failed to exhibit significant pro-oxidative and oxidative stress effects. While CuO and ZnO generated oxidative stress and acute pulmonary inflammation that is not predicted by Ec levels, the adverse biological effects of these materials could be explained by their solubility, as demonstrated by ICP-MS analysis. The metal ions released from these materials are well-known inducers of ROS production, oxidative stress and pulmonary inflammation. Soluble Cu ions could also induce cytochrome c oxidation. Taken together, these results demonstrate, for the first time, that it is possible to predict the toxicity of a large series of MOx nanoparticles in the lung premised on semiconductor properties and an integrated in vitro/in vivo hazard ranking model. This establishes a robust platform for future modeling of MOx structure-activity relationships based on band gap energy levels and particle dissolution. Our predictive toxicological paradigm is of considerable importance for regulatory decision-making about a class of ENM materials that is of high industrial importance. Our ability to use HTS to perform a comparative toxicological analysis could also speed up the rate of safety assessment and safe implementation of MOx nanoparticles.
Review of the literature indicates that a number of studies have been undertaken in cells, bacteria and animals to show differences in the hazard potential of MOx’s. 1–6, 26, 35–50 While there are agreements as well as differences of opinion regarding: (i) the hierarchical ranking of MOx toxicity; (ii) coherence of response outcomes in cells versus whole organisms; (iii) the reproducibility of the toxicological screening tools; most studies agree that: (i) the toxicity of MOx nanoparticles can be traced to the catalytic properties of the intact particles as well as their propensity to shed metal ions; 1, 2, 26, 35, 36 (ii) particle catalytic effects and dissolved metal ions contribute to ROS generation and oxidative stress injury;37–43 and (iii) that particulate-induced oxidative stress in response to ENMs as well as ambient ultrafine particles is closely related to the generation of pulmonary inflammation.3–6, 32, 44–46 While a variety of primary MOx nanoparticle properties (e.g., size, crystallinity, aspect ratio, surface area, dispersion, dissolution, semiconductor and band gap activity, surface coating, etc) could contribute to these pro-inflammatory and pro-oxidative effects, a key property of semiconducting materials is participation in electron transfers in the setting of an aqueous environment, such as biological fluids or the cellular interior that contains electrolytes and redox-active biological molecules. Moreover, it is well known from the catalyst literature that electrons can only be transferred if the energetic states of the semiconductor and redox couples in the aqueous environment are of approximately the same magnitude.19 Thus, an important advance in understanding MOx toxicity has been the suggestion by Burello and Worth that the valence and conduction band energies in relation to the biological redox potential could explain these materials’ oxidative stress effects.21, 22 According to this theory, calculation of the band gap energies from the electronegativities of the constituent metal oxide atoms and expression on the same energy scale as the redox potentials of couples active in biological media, may be useful to predict material toxicity.21, 22 Based on historical examples taken from the literature, these authors went on to predict that this theory could explain why TiO2, CuO, FeO and Fe2O3 could lead to biological hazard by inducing oxidative stress effects.
We selected 24 commonly used oxide nanoparticles to experimentally assess the Ec and Ev values and to test their toxicological predictions with respect to the in vitro and in vivo oxidative stress responses included in our hierarchical oxidative stress paradigm.7, 9 For the reasons described below, we settled on the overlap of Ec values with the cellular redox potential to study the selected materials’ in vitro and in vivo oxidant injury potential, utilizing cellular screening assays, an acute pulmonary inflammation model and in silico hazard ranking tools as key ingredients of our predictive toxicological modeling. The current study represents the largest and most comprehensive predictive toxicological analysis of oxide nanoparticles, providing novel insight into how semiconductor properties could relate to in vitro and in vivo hazard potential. Not only do we demonstrate a direct relationship of cellular oxidative stress responses to MOx conduction band energy levels, but also show that there is an excellent correlation with the ability of Co3O4, Cr2O3, Ni2O3, Mn2O3 and CoO nanoparticles to induce acute pulmonary inflammation. The likely explanation for this in vitro to in vivo correlation is activation of the NF-κB and MAP signaling cascades by an advanced degree of oxidative stress,1, 24, 26, 50 which, in turn, reflects the specific surface energy levels of these materials.
While the relevant energy levels for a semiconductor are the top of the valence band and the bottom of the conduction band, electron transfers to and from redox-active aqueous species in the vicinity of the semiconductor are dependent on the highest occupied and lowest unoccupied electronic levels in the MOx nanoparticles.19, 21, 22 Electron transfers to and from the aqueous redox couples likely only occurs when an orbital from the semiconductor shares an energy level with one of the orbitals in a redox couple. If the electron transfer involves the acceptance of an electron, this could lead to the occupation of a previously unoccupied electronic level while donation requires that an electron be removed from an occupied level. 19, 21, 22 Thus, when the semiconductor is introduced into a solution containing redox-active species, electrons will be transferred across the semiconductor/redox couple interface until the chemical potentials of the electrons in the solid and the solution is equalized. This could be direct transfer reactions to and from the nanomaterial as well as secondary reactions that involve to a cascade of intermediary electron acceptors until equality is reached. Because the valence band in most semiconductors is occupied while the electronic levels in the conduction band are mostly empty, we focused on the electron transfer conditions in which the biological redox potential is higher than the material’s Ec level. Such materials could accept and electron into their conduction bands. As an illustration of that possibility, we performed an abiotic experiment in which we demonstrated that reduced cytochrome c can be oxidized by Co3O4, Ni2O3, Mn2O3 and CoO nanoparticles. Oxidation of the heme group in this biomolecules constitutes the first demonstration that a MOx nanoparticle can change cytochrome c redox status. We have also demonstrated that Mn2O3 nanoparticles can oxidize NADP to NADPH under abiotic conditions (not shown) and propose that a series of related electron transfers between the conduction band of individual MOx nanoparticles and energetically coupled biomolecules couples could determine ROS generation at select subcellular sites.
It is possible that the specific orbital composition of different types of oxide nanoparticles could play a key role in determining their biological impact. For instance, in most non-transition metal oxides (e.g. ZnO, SnO2) the bottom of the conduction band is primarily comprised of metal s orbitals while the top of the valence band is primarily comprised of oxygen 2p orbitals.19 For transition oxide nanoparticles with low d electron occupancy (e.g., TiO2, ZrO2, WO3) the top of the valence band is still mostly derived from the oxygen 2p orbitals while the conduction band is frequently derived from metal d orbitals.19 Electrons in the conduction band and holes in the valence band often confer high reducing and oxidizing power for this class. For oxides of transition metals with high d electron occupancy (e.g., Fe2O3) metal d states are present in both valence and conduction band edges.19
In their theoretical framework, Burello and Worth used the electronegativities of the constituent atoms and oxide band gap values, assuming that these materials do not exhibit additional energy levels in the band gap and therefore behave like bulk materials.21, 22 Although they used theoretical calculations for the band gap of 70 oxide nanoparticles with diameters >20–30 nm, several of the materials hypothesized in their analysis to be potentially toxic did not show toxicity in our in vitro and in vivo toxicological analyses. However, when using Burello’s theoretical calculations for the materials we have studied, most of the conduction band gap predictions still held true, with the exception CuO and Fe2O3 that were absent from our projections (compare Fig. 1 with Fig. S10). We did observe, however, that CuO caused robust pro-oxidative and pro-inflammatory effects. To account for this discrepancy, we studied particle dissolution in the tissue culture media, using ICP-MS analysis. This demonstrated that CuO and ZnO are highly dissolvable and could be segregated during regression tree analysis from materials utilizing band gap energy to induce oxidative stress and inflammation. The regression tree clearly delineates two modes of MOx toxicity: one that can be explained by shedding of toxic metal ions and the other dependent on the Ec values of less soluble MOx nanoparticles. Moreover, our previous studies have demonstrated the importance of ZnO dissolution in generating oxidative stress injury at cellular and pulmonary levels, including the ability to control the toxicity by using less soluble Fe-doped ZnO nanoparticles.2, 26 While soluble ZnCl2 failed to impact cytochrome c oxidation, the abiotic assay demonstrated that soluble CuCl2 is capable of oxidizing the heme group. All considered, the above data demonstrate that while band gap energies present a good opportunity for modeling MOx toxicity, we should also pay attention to other properties that contribute to toxicity. Moreover, it is important to consider that material band gap is dependent on primary particle size, pH, temperature and pressure, which we could not address in the current study for logistical reasons. However, we are planning more detailed experimentation that will use combinatorial ENM libraries that incorporate systematic change of particle size, shape, dissolution, etc., to build a more comprehensive model. These studies will also consider contribution of reduction/dissolution and oxidation/dissolution processes that depends on the redox status of the cell. In this regard, Auffan et al have suggested that two kinds of metallic nanoparticles can be distinguished, namely (i) fully or partially oxidized nanoparticles with the redox potential higher than that of the bio-active redox couples, and (ii) fully or partially reduced nanoparticles characterized by a redox potential lower than that of the cellular redox couples.25
An interesting false-positive prediction was the observation that TiO2 failed to induce noticeable pro-oxidative and pro-inflammatory effects in spite of Ec overlap with the cellular redox potential. One possible explanation is that this material’s conduction band is extremely close to the upper edge of the cellular redox potential range, and may not provide enough differential for electron transfer. It should be noted that the proposed redox potential range does not necessarily have solid boundaries and may be subject to change in specific intracellular locations based on the redox couples that play a role at these sites. Therefore, prediction making based on energy “overlap” alone can be ambiguous when dealing with materials that exhibit conduction band energy levels close to the boundary. Another possibility is that our studies are being conducted under dark or non-UV exposure conditions (ambient indoor light conditions), in contrast to the circumstances where we have recently shown the emergence of TiO2 toxicity and oxidative stress, namely the use of UV exposure conditions in mammalian cells and bacteria.51, 52 It is well-known that absorption of photons with energy higher than the TiO2 bandgap energy can promote an electron from the valence to the conduction band of TiO2, with the concomitant generation of a hole in the valence band. The photo-excited electrons and holes can then react with aqueous electron acceptors and donors, respectively. However, for a spontaneous reaction to occur under non-UV exposure conditions, electrons cannot enter the conduction band. We theorize, therefore, that under our study conditions TiO2 redox reactions cannot be completed and that this explains the lack of oxidant injury and toxicity. While the crystalline phase of TiO2 could play a role in toxicological outcome, our nano spheres include both the rutile and anatase (20:80%) phases without noticeable toxicity. It is also worth mentioning that TiO2 shape change to nano wires can induce lysosomal injury due to the long aspect ratio of the wires.53
This study holds a number of important implications for the field of nanotoxicology and the safe implementation of nanotechnology to the benefit of society. The first is the use of HTS to develop a predictive toxicological paradigm that attempts to link specific MOx physicochemical properties to an oxidative stress injury paradigm at cellular and lung levels. While there are several potential shortcomings of in vitro screening assays as well as the use of instillation exposures in mice, the ability to link hazard ranking at cellular level to hazard ranking in vivo allows toxicological binning of in vitro and in vivo toxicological data to set priorities for the study of materials that could lead to exposures in workers, consumers and the environment. HTS allows hazard ranking of a large number of materials, as shown in this study, helping to prioritize which materials should undergo further safety testing and should be considered for early regulatory considerations. Because of the logistical limitations of the number of animals that can be used for safety assessment, we demonstrate how the in vitro hazard ranking could be used to prioritize the in vivo studies. In vivo studies, in turn, help to validate the in vitro screening assays. The demonstration of the highly significant statistical association of (i) Ec levels with toxicological outcomes, (ii) single parameter with multi-parameter cellular assays, and (iii) in vitro to in vivo toxicological outcomes demonstrates the feasibility of using a predictive toxicological approach for more extensive modeling of MOx toxicity. The overall impact will be to speed up the rate at which ENMs are being assessed as well as to define structure-activity relationships that can be used for safer design of nanomaterials.
Finally, it is also important to summarize the limitations of the current study. Although the Burello and Worth theory based on the overlap of conduction band energy with the cellular redox potential correlates reasonably well with our in vitro and in vivo toxicity results, this does not necessarily mean the nanoparticle toxicity potential was solely determined by the “overlap”. One may notice that materials like Fe3O4 and WO3 actually have conduction band positions lower than the biological redox potential range that, based on thermodynamic considerations, should allow electron injection into their conduction bands. The fact that these materials do not show any noticeable toxicity suggests that other factors may play a role in determining the toxicological potential of metal oxide nanoparticles. This could include variables such as the Fermi levels of the MOx nanoparticles as well as the HOMO and LUMO energy levels of the biomolecules. Acquisition of a large number of MOx nanoparticles from commercially available sources places limitations on the selection of primary particle size, which does play a role in determining band gap energy levels.19 Thus, while our in-house synthesized materials could be made to required size specifications, it was not possible to obtain identical sizes from the commercial suppliers. In vitro assays are hampered by the number of potential pitfalls related to the interactions of nanoparticles with the test system analytes.54 We systematically excluded the occurrence of false positive or negative results by developing standardized procedures for assay development as discussed previously.55 Oropharyngeal aspiration delivers a one-time dose that does not accurately reflect aerosolized inhalation, deposition, distribution and fate in the lung.5 Thus, the instillation approach is only valid for hazard ranking and cannot be used for detailed analysis of real-life exposures and calculation of toxicological relevant nanoparticle doses. However, hazard ranking does provide a stratification of the toxicological potential of nanoparticles and serves as a prioritization process to determine which materials should be subjected to aerosolized inhalation studies, which require a lot of time, effort and money. Thus, aerosolized exposure is not practical as an initial screening procedure. While we have been able to generate in vitro dose-response slopes that have allowed us to calculate EC50 values, this is only the first step towards more detailed dosimetry, which requires in vitro to in vivo extrapolation. One approach is to convert the mass-dose to mass per surface area in the tissue culture dish and the lung to perform a comparative analysis.6 Another is to convert particle surface area dose to impacted surface area in the tissue culture dish and lung.46 With the emergence of the current predictive toxicological paradigm, we are now in a position to select specific materials with contrasting toxicological profiles to perform more detailed in vitro to in vivo dosimetry analysis.. These dosimetry studies have to consider the dispersion characteristics of the nanoparticles, because the formation of a protein corona can change the hydrodynamic sizes of the primary particles and, thereby affect their gravitational setting during performance of cellular studies. 56 This could change the dynamics of cellular uptake and the intracellular dose response kinetics that are required to initiate oxidative stress. 56, 57 In spite of all these shortcomings, the consistency of our toxicological evaluations as well as the excellent correlation between in vitro and in vivo data sets suggest that our study approach and toxicological paradigm will lead to major advances in understanding MOx toxicity.
Conclusion
Using 24 representative metal oxides, we demonstrate that the toxicity of metal oxide nanoparticles closely correlates with their semiconducting property and band positions. Overlap of metal oxide conduction band energies (Ec) with the cellular redox potential (−4.12 to −4.84 eV) can lead to ROS generation and oxidative stress injury as well as the generation of pulmonary inflammation, which can be assessed by single and multi-parametric toxicological assay as well as acute pulmonary inflammation. While the toxicity of CuO and ZnO is independent of their Ec levels, the adverse biological effects of these materials could be explained by their solubility. These results provide a novel platform for establishing MOx structure-activity relationships based on band energy levels and particle dissolution. We also demonstrate that the in silico hazard ranking and statistical tools can be used to establish a predictive toxicological paradigm, in which in vitro toxicological ranking can be used to predict the in vivo toxicological outcome.
MATERIALS AND METHODS
Materials
Metal oxide nanoparticles were obtained through in-house synthesis or purchasing from commercially available sources as outlined in Table 1. A flame spray pyrolysis reactor was used for the in-house synthesis of CuO, Co3O4, Fe3O4, Sb2O3, TiO2, WO3 and ZnO as previously described by us.1, 2, 10, 51 All chemicals were reagent grade and used without further purification or modification unless otherwise indicated. Reagent grade water used in all experimental procedure was obtained from a Milli-Q water purification system (Millipore, Bedford, MA).
Physicochemical Characterization
All the nanoparticles were provided in powdered form. Transmission electron microscopy (TEM, JEOL 1200 EX, accelerating voltage 80 kV) was used to observe the shapes and primary sizes of the nanoparticles. Samples were prepared by placing a drop of the aqueous nanoparticle suspension on a carbon-coated TEM grid and waiting until the water evaporates. X-ray powder diffraction (XRD, Panalytical X’Pert Pro diffractometer, CuKα radiation) was utilized for identifying the crystal structure of each material. The XRD pattern was collected with a step size of 0.02 ° and a counting time of 0.5 s per step over a range of 10–100° 2θ. High throughput dynamic light scattering (HT-DLS, Dynapro™ Plate Reader, Wyatt Technology) was performed to determine the particle size and size distribution of the nanoparticles in water and the cell culture media following the procedure developed in our previous study.58 Zeta potential measurement of the nanoparticle suspensions in water was performed using a ZetaPALS instrument (Zeta Potential Analyzer, Brookhaven Instruments Corporation, Holtsville, NY). Metal dissolution was determined by inductively coupled plasma-mass spectrometry (Perkin-Elmer SCIEX Elan DRCII ICP-MS).58 40 μL of freshly prepared metal oxide (5 mg/mL) was mixed with 960 μL deionized water or culture medium at room temperature, with gentle shaking for 24h. The resulting mixture was centrifuged at 20,000 rcf for 30 min, and 300 μL of the supernatant was digested by 3 mL of concentrated nitric acid at 90 °C for 3 h. The well digested solution was dried by evaporation at 120 °C, and 3 mL of 5% nitric acid was added for ICP-MS measurement.1, 51
Calculation of conduction and valence band energies
The conduction and valence band energies shown in Table 3 were derived from the following equations with pH= 7.4 in a biological system:
| (1) |
| (2) |
Ec refers to conduction band energy; Ev is valence band energy; χoxide is absolute electronegativity for each metal oxide; Eg is band gap; and PZZP is point of zero zeta potential of each oxide.19, 21, 22 Various methods can be used to obtain the electronegativity, band gap, and PZZP values, herein the absolute metal oxide electronegativities, χoxide, were calculated using a set of equations reported by Portier et al:59
| (3) |
| (4) |
| (5) |
z refers to cationic formal charge; r is ionic radius (Å); α is a correction term whose exact value can be found in Portier et al.;59 χcation (P.u.) is cationic electronegativity in Pauling unit; and χcation (eV) is absolute cationic electronegativity in electron volt. The band gap energies were obtained from diffuse reflectance (DR) UV-vis spectroscopic analysis (Cary 5000 UV-vis-NIR spectrometer equipped with a Praying Mantis accessory). All measurements were conducted in ambient air using a bandwidth of 1.0 nm. The collected DR-UV-vis spectra were converted into Kubelka–Munk function [F(R∞)] spectra using the Cary Win UV software. The detailed band gap determination is described in the Supporting Information Figure S11 and S12. The PZZP values were determined by measuring zeta potentials of each nanoparticle suspension over a wide pH range (typically 2–11) using a ZetaPALS instrument.
As an alternative approach, the band gap values can also be calculated from the standard enthalpy of formation of oxides using a correlation reported by Portier et al.:60
| (6) |
Where Eg (eV) is the band gap; A is the pre-exponential constant, which varies from 0.5 to 1.7 depending on the cation of the oxide; and EΔH° (eV) is the standard enthalpy of formation. Using these Eg values, the absolute electronegativities calculated from Equations 3–5, and PZZP values obtained from a handbook source,61 another set of conduction and valence band energies can then be derived using Equations 1 and 2 and listed in Table S4.
Using both methods, six metal oxides including CoO, Co3O4, Cr2O3, Ni2O3, Mn2O3 and TiO2 consistently showed up in the predictions (Figures 1 and S10). However, ambiguity does exist for a couple of other metal oxides. For example, Fe2O3 and CuO that are predicted to be nontoxic using the first method (with our own measured band gap and PZZP values) are predicted to be toxic in the second method. One should note that, although calculation of Eg values based on empirical equations is more convenient, it involves many assumptions and rough generalizations that only represent bulk properties of the metal oxides. In addition, very often the same material has different reported Eg or PZZP values, which makes it difficult to select reliable data for the final band position calculation. Based on these considerations, we decided to use our own measured band gap and PZZP values that represent the real properties of the metal oxides for band edge energy calculation and modeling.
Nanoparticle dispersion in tissue culture media 2, 11, 58
Nanoparticle stock solutions (5 mg/mL) were prepared by dispersing the dry particles in deionized water through probe sonication (3 W). The stock solution was used to remove 40 μL aliquots which were mixed with an equal volume of 4% bovine serum albumin (BSA) (Fraction-V, Gemini Bioproducts, USA) and equilibrated for 1 h at room temperature. Cell culture media (920 μL) were added to the BSA-coated nanoparticle suspensions. The nanoparticle suspensions were sonicated (3 W) for 15 seconds prior to conducting cellular studies. In case for toxicity study in BEGM, 2 mg/mL of BSA was kept in BEGM for preparation of a series of nanoparticle suspensions at different concentrations.
Cell culture
Human bronchial epithelial cells (BEAS-2B) and rat alveolar macrophage cells (RAW 264.7) were cultured in vented T-75 cm2 flasks (Corning, Fisher Scientific, Pittsburgh, PA) at 37°C in a humidified 5% CO2 atmosphere, and passaged at 70–80% confluency every 2–4 days. BEAS-2B cells were cultured in bronchial epithelial basal medium (BEBM) (Lonza, Walkersville, MD), supplemented with growth factors from the Single Quot kit (Lonza) to reconstitute bronchial epithelial growth medium (BEGM). RAW 264.7 cells were cultured in DMEM medium containing 10% fetal calf serum (FCS), 100 U/mL penicillin, 100 μg/mL streptomycin, and 2 mM L-glutamine.
Assessment of cellular viability by single parameter assays1
Cell death, cell viability and intracellular ATP levels were determined by LDH, MTS and ATP assays, which were carried out with CytoTox 96® (Promega Corporation, Madison, WI), CellTiter 96® AQueous (Promega Corporation) and ATPliteTM 1step (Perkin Elmer, Boston, MA) assay kits, respectively. Ten thousand cells in 100 μL medium were plated in each well of a 96 multi-well black plate (Costar, Corning, NY) for overnight growth. The medium was removed and cells treated for 24 hr with 100 μL of a series of nanoparticle suspensions to yield final concentrations of 0.4, 0.8, 1.6, 3.2, 6.3, 12.5, 25, 50, 100 and 200 μg/mL. For the LDH assay, supernatants were transferred to a new 96 multi-well plate and centrifuged at 2000 G for 10 min in NI Eppendorf 5430 with microplate rotor to spin down the cell debris and nanoparticles. 50 μL of the supernatant was removed from each well and transferred into a new 96-well plate and mixed with 50 μL of reconstituted substrate solution for 30 min at room temperature in dark. The reaction was terminated by the addition of 50 μL stop solution. Cells treated with the Lysis Solution (provided by manufacturer) for 45 min were used as the positive control. Three independent experiments and 3 replicates for each experiment were performed. The absorbance of formazan was read at 490 nm on a SpectraMax M5 microplate spectrophotometer (Molecular Devices, Sunnyvale, CA). For the performance of the MTS assay, the cell culture medium was removed and following washing of the plates three times with PBS, each well received 100 μL of culture medium containing 16.7% of MTS stock solution for an hour at 37°C in a humidified 5% CO2 incubator. The supernatants were transferred to a new 96 multi-well plate and centrifuged at 2000 G for 10 min in NI Eppendorf 5430 with microplate rotor to spin down the cell debris and nanoparticles. 80 μL of the supernatant was removed from each well and transferred into a new 96-well plate. The absorbance of formed formazan was read at 490 nm on a SpectraMax M5 microplate spectrophotometer. To perform the ATP assay, cells used for performing the MTS assay, were washed three times with PBS and incubated with 100 μL of reconstituted ATPlite 1step reagent for 10 min. The luminescence intensity was recorded on SpectraMax M5 microplate spectrophotometer.
Dose-Response Analysis (pertaining to Figure 3)
The responses generated for the MTS, LDH and ATP single assays were first normalized considering plate controls. For the ATP and MTS assays, negative control (NCTRL) is a reference of 100% cell “health”. Accordingly, the data were normalized as , where Rnp and R̄nc denote the response induced by nanoparticles and the average response of the controls, respectively; negative Tnp values were set to zero. For LDH, the negative control (NCTRL) is the “low-end” of the measurements. Accordingly, the data were normalized as , where Tnp is LDH positive control response which was 3.86, and 3.92 for the BEAS-2B and RAW cell lines, respectively. The normalized data variable, Tnp, ranges from 0 (no effect) to 1 (100% of the cells were affected). The normalized data were then described by the commonly used sigmoid dose-response function , in which S is the slope of the dose-response curve (i.e., the rate of response increase with concentration) at the EC50 (dose at which 50% of the cell population is affected). It is noted that a low value of S (p- value<5% for MTS and ATP and p-value <0.1% for LDH), for the experimental period is indicative of a statistically insignificant response over this period.
Use of a HTS assay to assess multiple integrated parameters of toxic oxidative stress 2, 10, 11
The rationale for this assay is described in several previous publications 7, 8, 9 and summarized in Figure S3. Five thousand cells in 50 μL of tissue culture medium were plated into each well of a 384 multi-well plate (Greiner Bio-One, Monroe, NC), followed by overnight growth at 37°C in a humidified 5% CO2 incubator. The medium in each well was aspirated and 25 μL of a nanoparticle dilution series added to quadruplicate wells to deliver a dose range of 0.4, 0.8, 1.6, 3.2, 6.3, 12.5, 25, 100 and 200 μg/mL.2, 10, 11 This work was carried out in the Molecular Shared Screening Resource laboratory in the California Nano Systems Institute, where cellular seeding of the plates, preparation of the nanoparticle working solutions and their addition to the tissue culture plates are carried out with automated liquid handling devices including a Multidrop (Thermo-Fischer, Waltham, MA), Precision 2000 (Biotek Instruments, Winooski, VT) and Hydra 96 (Robbins Scientific, Golden Valley, MN).55 Three cocktails of fluorescent dye mixtures were prepared by mixing dyes with compatible wavelengths in BEGM or complete DMEM. 2, 10, 11 The first cocktail contained Hoechst 33342 (1 μM), Fluo-4 (5 μM), and propidium iodide (5 μM); the second cocktail contained Hoechst 33342 (1 μM), DCF (5 μM), and MitoSox Red (5 μM), and the third, Hoechst 33342 (1 μM) and JC-1 (5 μM) (Fig. S3B). The utility of these dyes, their excitation/emission wavelengths, and response profiling are explained in Fig. S3 and summarized in Table S3. The addition of the cocktails according to the layout of the individual 384 plates is explained in Fig. S3B. Each well received 2.5 μL of one of the dye mixtures for 30 min, with the plates being kept in under dark cell culture conditions. Epifluorescence readings were obtained hourly for the first 6 hours and again at the 24 hr mark, using an Image-Xpressmicro (Molecular Devices, Sunnyvale, CA) equipped with a laser autofocus. DAPI, FITC, and TRITC filter/dichroic combinations were used to image Hoechst 33342 (blue), Fluo-4/DCF/JC-1 (green), and PI/MitoSox Red (red), respectively. Images were processed using MetaXpress software (Molecular Devices, Sunnyvale, CA) at 10 × magnification. The total number of nuclei was counted in the Hoechst/DAPI channel using the following settings: The minimum width was 3 μm (about 3 pixels), the approximate maximum width was 10 μm (about 7 pixels) and the threshold intensity was 100 gray levels above background. For the FITC and TRITC channels the approximate minimum width was 5 μm (about 6 pixels) and the approximate maximum width was 30 μm (about 22 pixels). The thresholds were set at 250 and 500 gray levels, respectively, above background. The percentage of cells positive for each response parameter was calculated using MetaXpress software on the basis of the total number of Hoechst-positive cells showing increased fluorescence intensity above a defined threshold for each particular dye.
The HTS toxicity data were first normalized via strictly standard mean difference (SSMD) to quantify the cell responses induced by the nanoparticles.62–64 SSMD measures the magnitude of the differences between each set of quadruplicate measurements and the control population (cell population that were not exposed to ENMs) standardized by their variances with the following definition
where, μ and σ denote the mean and standard deviation of the sample quadruplicate or the control population (identified by the subscripts). The SSMD normalized HTS data are illustrated in Figure 4A and 4B, where |SSMD| ≥ 3 indicates a significant difference between the nanoparticle-induced cell response to control (given that the mean difference is normally distributed, |SSMD| ≥ 3 indicates that, in a probability above 99%, the sample population is different from the control population).
Assessment of acute toxicological responses in the mouse lung by oropharyngeal aspiration
Eight-week old male C57 BL/6 mice were purchased from Charles River Laboratories (Hollister, CA). Oropharyngeal aspiration of MOx nanoparticles were conducted using our previously published approach with minor modifications.1, 26 Briefly, under ketamine/xylazine (100/10 mg/kg) anesthesia, the animals were held vertically and the tongue was gently pulled out of the mouth using forceps. MOx nanoparticles (20 μg suspended in 50 μl of PBS containing 0.6 mg/mL mouse serum albumin and 10 μg/mL PDDC) were administered by placing the particle suspension at the back of the tongue while the nose was closed, thereby forcing the animal to breathe through its mouth. The nose and tongue were released after at least two breaths had been completed. Animal necropsy was performed 40 hrs after oropharyngeal aspiration of the nanoparticles as previously described by us.1, 26 After the mice had been anesthetized by intra-peritoneal injection of pentobarbital (50 mg/kg), bronchoalveolar lavage (BAL) was performed by cannulating the trachea and gently lavaging the lung 3 times with 1 ml of sterile PBS. BAL cells were adhered onto microscopic slides for differential cell count, while BAL fluid was stored at −80 °C for assessing cytokine and chemokine levels. BAL differential cell count was performed as described by us.1, 26 MCP-1 and IL-6 levels in the BAL fluid were analyzed using ELISA kits (BD Biosciences, San Diego, CA) according to manufacturer’s instructions.
Regression tree analysis for the effect of Ec and metal dissolution on toxicity
We normalized the data for each of the 24 MOx nanoparticles and each of the 4 biological outcomes (LDH, MTS, ATP, PI) by subtracting the mean background levels. We established dose-response curves using non-parametric smoothing splines and summarized each trajectory with the area under the estimated dose-response curve. We related cytotoxicty (as measured by area under the curve) to conduction energy (Ec) and metal dissolution (dissolution in BEGM) in a regression tree model. This model is part of a family of advanced non-parametric statistical techniques and it is particularly suited for this analysis as it captures effortlessly both expected non-linear dependence between particle descriptor and cytotoxicity and possible interactions between Ec and dissolution. Intuitively, the model defines recursive partitions in the dissolution and Ec domains aimed at characterizing regions amongst possible values of the particle descriptors where nanoparticle cytotoxicity is relatively homogenous. The complexity of the tree was determined minimizing the leave-one-out cross validation error. We performed similar analysis for the MTS, ATP and PI data sets.
Comparison of normalized toxicity effect sizes in vivo and in vitro
The predictive performance of in vitro tests was validated comparing the expected probability of particle toxicity to in vivo neutrophil counts, MCP-1 and IL-6 levels. This was achieved by plotting predictive or expected probability of in vitro toxicity vs. the T-statistic of the in vivo toxicity data. To generate the expected probability of toxicity, we performed independent F-tests for differences in mean response across exposure levels and exposure durations for each of the 24 MOx nanoparticles and for each of 4 biological outcomes (MTS, ATP, LDH, PI). Rejection of this test indicates that exposure to nanoparticles initiates a statistically significant dose response dynamic in vitro. We reduced the full dose-response data set to binary indicators of in vitro toxicity (1 if toxic, 0 if non-toxic) and used this summary in a logistic regression tree model, including Ec and dissolution. Our model provides estimates of the expected probability of toxicity for every nanoparticle. Therefore, for any possible combination of Ec and dissolution values, our model generates a number between 0 and 1, where 0 indicates 0% probability of cytotoxicity (highly unlikely to be toxic) and 1 indicates 100% probability of cytotoxicity (very likely toxic). In vivo toxicity was then quantified for the 14 nanoparticles tested in vivo, using the value of independent T-tests for differences in the mean of each biological outcome (neutrophil counts, MCP-1 and IL-6 levels). For each nanoparticle, we evaluated the average difference between responses obtained in control and particle-exposed mice. The plots generated project the expected probability of toxicity (on the horizontal axis) versus the value of the T-tests (vertical axis). Large values of the T-test statistic indicate large mean differences between exposed and control mice, whereas large values for the predicted probability of toxicity indicate nanoparticles that are likely toxic. The combined result demonstrates a clear separation of the magnitude of the observed in vivo outcomes for nanoparticles with predictive in vitro toxicological probabilities of > 50%.
Preparation of oxidized and reduced cytochrome c
The oxidized form of horse heart cytochrome c was purchased from Sigma-Aldrich and used without further purification. The concentration was determined by measuring the optical absorbance at 550 nm with an extinction coefficient of 8.4 mM−1 cm−1. The reduced form of horse heart cytochrome c was prepared by adding an excess of sodium ascorbate to reduce the oxidized version, followed by dialysis to remove the excess ascorbate.65 Briefly, 60 μg of the oxidized cytochrome c was dissolved in 1.5 mL of 0.01 M potassium phosphate buffer (pH 7.0), and mixed with 1.5 mL of 0.1 M sodium ascorbate in 0.01 M potassium phosphate buffer (pH 7.0). The mixture was stirred for 1 hour at 4 °C and the resulting solution was transferred into Slide-A-Lyzer dialysis cassette (Thermo Scientific, Rochford, IL, USA) using a syringe and then dialyzed against 0.01M phosphate buffer (pH 7.0). Dialysis was performed for 24 hours at 4 °C with 4 buffer exchanges. The concentration of reduced cytochrome c was determined by measuring the optical absorbance at 550 nm with extinction coefficient of 21.1 mM−1 cm−1.66
Spectroscopic analysis of the oxidation of reduced cytochrome c
Oxidation of the reduced cytochrome c was determined by spectroscopic properties. 990 μL of various concentrations of metal oxide nanoparticles was mixed with 10 μL of 40 μM reduced cytochrome c in a 1.5 mL eppentorf tube, following with a gentle shaking on a rotator for 24 hours at 4 °C. The resulting solution was centrifuged at 10,000 rpm for 10 min, and the supernatant was collected for measuring the UV-visible spectra on SpectraMax M5 in 1.0-cm-path-length cell.
Supplementary Material
Acknowledgments
Primary support was provided by the US Public Health Service Grants, U19 ES019528 (UCLA Center for Nanobiology and Predictive Toxicology) and RO1 ES016746. This work was also supported by the National Science Foundation and the Environmental Protection Agency under Cooperative Agreement Number DBI-0830117. Any opinions, findings, conclusions or recommendations expressed herein are those of the author(s) and do not necessarily reflect the views of the National Science Foundation or the Environmental Protection Agency. This work has not been subjected to an EPA peer and policy review. Fluorescent microscopy was performed at the CNSI Advanced Light Microscopy/Spectroscopy Shared Facility at UCLA.
References
- 1.Xia T, Kovochich M, Liong M, Madler L, Gilbert B, Shi HB, Yeh JI, Zink JI, Nel AE. Comparison of the Mechanism of Toxicity of Zinc Oxide and Cerium Oxide Nanoparticles Based on Dissolution and Oxidative Stress Properties. ACS Nano. 2008;2:2121–2134. doi: 10.1021/nn800511k. [DOI] [PMC free article] [PubMed] [Google Scholar]
- 2.George S, Pokhrel S, Xia T, Gilbert B, Ji ZX, Schowalter M, Rosenauer A, Damoiseaux R, Bradley KA, Madler L, et al. Use of a Rapid Cytotoxicity Screening Approach To Engineer a Safer Zinc Oxide Nanoparticle through Iron Doping. ACS Nano. 2010;4:15–29. doi: 10.1021/nn901503q. [DOI] [PMC free article] [PubMed] [Google Scholar]
- 3.Cho WS, Duffin R, Poland CA, Howie SEM, MacNee W, Bradley M, Megson IL, Donaldson K. Metal Oxide Nanoparticles Induce Unique Inflammatory Footprints in the Lung: Important Implications for Nanoparticle Testing. Environ Health Perspect. 2010;118:1699–1706. doi: 10.1289/ehp.1002201. [DOI] [PMC free article] [PubMed] [Google Scholar]
- 4.Lu SL, Duffin R, Poland C, Daly P, Murphy F, Drost E, MacNee W, Stone V, Donaldson K. Efficacy of Simple Short-Term In Vitro Assays for Predicting the Potential of Metal Oxide Nanoparticles to Cause Pulmonary Inflammation. Environ Health Perspect. 2009;117:241–247. doi: 10.1289/ehp.11811. [DOI] [PMC free article] [PubMed] [Google Scholar]
- 5.Oberdörster G, Donaldson K, Castranova V, Fitzpatrick J, Ausman K, Carter J, Karn B, Kreyling W, Lai D, Olin S, et al. Principles for Characterizing the Potential Human Health Effects from Exposure to Nanomaterials: Elements of A Screening Strategy. Part Fibre Toxicol. 2005;2:8. doi: 10.1186/1743-8977-2-8. [DOI] [PMC free article] [PubMed] [Google Scholar]
- 6.Rushton EK, Jiang J, Leonard SS, Eberly S, Castranova V, Biswas P, Elder A, Han XL, Gelein R, Finkelstein J, et al. Concept of Assessing Nanoparticle Hazards Considering Nanoparticle Dosemetric and Chemical/Biological Response Metrics. J Toxicol Env Health A. 2010;73:445–461. doi: 10.1080/15287390903489422. [DOI] [PMC free article] [PubMed] [Google Scholar]
- 7.Nel A, Xia T, Madler L, Li N. Toxic Potential of Materials at the Nanolevel. Science. 2006;311:622–627. doi: 10.1126/science.1114397. [DOI] [PubMed] [Google Scholar]
- 8.Nel AE, Madler L, Velegol D, Xia T, Hoek EMV, Somasundaran P, Klaessig F, Castranova V, Thompson M. Understanding Biophysicochemical Interactions at the Nano-bio Interface. Nat Mater. 2009;8:543–557. doi: 10.1038/nmat2442. [DOI] [PubMed] [Google Scholar]
- 9.Meng H, Xia T, George S, Nel AE. A Predictive Toxicological Paradigm for the Safety Assessment of Nanomaterials. ACS Nano. 2009;3:1620–1627. doi: 10.1021/nn9005973. [DOI] [PubMed] [Google Scholar]
- 10.George S, Xia TA, Rallo R, Zhao Y, Ji ZX, Lin SJ, Wang X, Zhang HY, France B, Schoenfeld D, et al. Use of a High-Throughput Screening Approach Coupled with In Vivo Zebrafish Embryo Screening To Develop Hazard Ranking for Engineered Nanomaterials. ACS Nano. 2011;5:1805–1817. doi: 10.1021/nn102734s. [DOI] [PMC free article] [PubMed] [Google Scholar]
- 11.Zhang HY, Xia T, Meng H, Xue M, George S, Ji ZX, Wang X, Liu R, Wang MY, France B, et al. Differential Expression of Syndecan-1 Mediates Cationic Nanoparticle Toxicity in Undifferentiated versus Differentiated Normal Human Bronchial Epithelial Cells. ACS Nano. 2011;5:2756–2769. doi: 10.1021/nn200328m. [DOI] [PMC free article] [PubMed] [Google Scholar]
- 12.Boro J, Deka D, Thakur AJ. A Review on Solid Oxide Derived from Waste Shells as Catalyst for Biodiesel Production. Renew Sust Energ Rev. 2012;16:904–910. [Google Scholar]
- 13.Zhou W, Wachs IE, Kiely CJ. Nanostructural and Chemical Characterization of Supported Metal Oxide Catalysts by Aberration Corrected Analytical Electron Microscopy. Curr Opin Solide State Mat Sci. 2012;16:10–22. [Google Scholar]
- 14.Wetchakun K, Samerjai T, Tamaekong N, Liewhiran C, Siriwong C, Kruefu V, Wisitsoraat A, Tuantranont A, Phanichphant S. Semiconducting Metal Oxides as Sensors for Environmentally Hazardous Gases. Sens Actuators B-Chem. 2011;160:580–591. [Google Scholar]
- 15.McNeilly JD, Heal MR, Beverland IJ, Howe A, Gibson MD, Hibbs LR, MacNee W, Donaldson K. Soluble Transition Metals Cause the Pro-inflammatory Effects of Welding Fumes In Vitro. Toxicol Appl Pharmacol. 2004;196:95–107. doi: 10.1016/j.taap.2003.11.021. [DOI] [PubMed] [Google Scholar]
- 16.Antonini JM, Murthy GGK, Rogers RA, Albert R, Ulrich GD, Brain JD. Pneumotoxicity and Pulmonary Clearance of Different Welding Fumes after Intratracheal Instillation in the Rat. Toxicol Appl Pharmacol. 1996;140:188–199. doi: 10.1006/taap.1996.0212. [DOI] [PubMed] [Google Scholar]
- 17.Hull MJ, Abraham JL. Aluminum Welding Fume-induced Pneumoconiosis. Hum Pathol. 2002;33:819–825. doi: 10.1053/hupa.2002.125382. [DOI] [PubMed] [Google Scholar]
- 18.Sano T. Pathology and Pathogenesis of Pneumoconiosis. Acta Pathologica Japonica. 1963;13:77–93. doi: 10.1111/j.1440-1827.1963.tb01912.x. [DOI] [PubMed] [Google Scholar]
- 19.Xu Y, Schoonen MAA. The Absolute Energy Positions of Conduction and Valence Bands of Selected Semiconducting Minerals. Am Miner. 2000;85:543–556. [Google Scholar]
- 20.Plumlee GS, Morman SA, Ziegler TL. The Toxicological Geochemistry of Earth Materials: An Overview of Processes and The Interdisciplinary Methods Used to Understand Them. Rev Mineral Geochem. 2006;64:5–57. [Google Scholar]
- 21.Burello E, Worth AP. A Theoretical Framework for Predicting the Oxidative Stress Potential of Oxide Nanoparticles. Nanotoxicology. 2011;5:228–235. doi: 10.3109/17435390.2010.502980. [DOI] [PubMed] [Google Scholar]
- 22.Burello E, Worth AP. QSAR Modeling of Nanomaterials. Wiley Interdiscip Rev-Nanomed Nanobiotechnol. 2011;3:298–306. doi: 10.1002/wnan.137. [DOI] [PubMed] [Google Scholar]
- 23.Xia T, Kovochich M, Brant J, Hotze M, Sempf J, Oberley T, Sioutas C, Yeh JI, Wiesner MR, Nel AE. Comparison of the Abilities of Ambient and Manufactured Nanoparticles to Induce Cellular Toxicity According to An Oxidative Stress Paradigm. Nano Lett. 2006;6:1794–1807. doi: 10.1021/nl061025k. [DOI] [PubMed] [Google Scholar]
- 24.Li N, Alam J, Venkatesan MI, Eiguren-Fernandez A, Schmitz D, Di Stefano E, Slaughter N, Killeen E, Wang XR, Huang A, et al. Nrf2 is a Key Transcription Factor that Regulates Antioxidant Defense in Macrophages and Epithelial Cells: Protecting Against the Proinflammatory and Oxidizing Effects of Diesel Exhaust Chemicals. J Immunol. 2004;173:3467–3481. doi: 10.4049/jimmunol.173.5.3467. [DOI] [PubMed] [Google Scholar]
- 25.Auffan M, Rose J, Wiesner MR, Bottero JY. Chemical Stability of Metallic Nanoparticles: A Parameter Controlling Their Potential Cellular Toxicity In Vitro. Environ Pollut. 2009;157:1127–1133. doi: 10.1016/j.envpol.2008.10.002. [DOI] [PubMed] [Google Scholar]
- 26.Xia TA, Zhao Y, Sager T, George S, Pokhrel S, Li N, Schoenfeld D, Meng HA, Lin SJ, Wang X, et al. Decreased Dissolution of ZnO by Iron Doping Yields Nanoparticles with Reduced Toxicity in the Rodent Lung and Zebrafish Embryos. ACS Nano. 2011;5:1223–1235. doi: 10.1021/nn1028482. [DOI] [PMC free article] [PubMed] [Google Scholar]
- 27.Liu R, Rallo R, George S, Ji ZX, Nair S, Nel AE, Cohen Y. Classification NanoSAR Development for Cytotoxicity of Metal Oxide Nanoparticles. Small. 2011;7:1118–1126. doi: 10.1002/smll.201002366. [DOI] [PMC free article] [PubMed] [Google Scholar]
- 28.Rallo R, France B, Liu R, Nair S, George S, Damoiseaux R, Giralt F, Nel A, Bradley K, Cohen Y. Self-Organizing Map Analysis of Toxicity-Related Cell Signaling Pathways for Metal and Metal Oxide Nanoparticles. Environ Sci Technol. 2011;45:1695–1702. doi: 10.1021/es103606x. [DOI] [PMC free article] [PubMed] [Google Scholar]
- 29.Droge W. Free Radicals in the Physiological Control of Cell Function. Physiol Rev. 2002;82:47–95. doi: 10.1152/physrev.00018.2001. [DOI] [PubMed] [Google Scholar]
- 30.Valko M, Leibfritz D, Moncol J, Cronin MTD, Mazur M, Telser J. Free Radicals and Antioxidants in Normal Physiological Functions and Human Disease. Int J Biochem Cell Biol. 2007;39:44–84. doi: 10.1016/j.biocel.2006.07.001. [DOI] [PubMed] [Google Scholar]
- 31.McNeilly JD, Jimenez LA, Clay MF, MacNee W, Howe A, Heal MR, Beverland IJ, Donaldson K. Soluble Transition Metals in Welding Fumes Cause Inflammation via Activation of NF-kappa B and AP-1. Toxicol Lett. 2005;158:152–157. doi: 10.1016/j.toxlet.2005.03.005. [DOI] [PubMed] [Google Scholar]
- 32.Warheit DB, Sayes CM, Reed KL. Nanoscale and Fine Zinc Oxide Particles: Can In Vitro Assays Accurately Forecast Lung Hazards Following Inhalation Exposures? Environ Sci Technol. 2009;43:7939–7945. doi: 10.1021/es901453p. [DOI] [PubMed] [Google Scholar]
- 33.Yandell JK. Kinetics of Oxidation of Reduced Cytochrome-C by Aquacopper(II) and Chlorocopper(II) Complexes in the Presence of Oxygen. Aust J Chem. 1981;34:99–106. [Google Scholar]
- 34.Rorabacher DB. Electron Transfer by Copper Centers. Chem Rev. 2004;104:651–697. doi: 10.1021/cr020630e. [DOI] [PubMed] [Google Scholar]
- 35.Frick R, Muller-Edenborn B, Schlicker A, Rothen-Rutishauser B, Raemy DO, Gunther D, Hattendorf B, Stark W, Beck-Schimmer B. Comparison of Manganese Oxide Nanoparticles and Manganese Sulfate with Regard to Oxidative Stress, Uptake and Apoptosis in Alveolar Epithelial Cells. Toxicol Lett. 2011;205:163–172. doi: 10.1016/j.toxlet.2011.05.1037. [DOI] [PubMed] [Google Scholar]
- 36.Cho WS, Duffin R, Thielbeer F, Bradley M, Megson IL, Macnee W, Poland CA, Tran CL, Donaldson K. Zeta Potential and Solubility to Toxic Ions as Mechanisms of Lung Inflammation Caused by Metal/metal-oxide Nanoparticles. Toxicol Sci. 2012;126:469–477. doi: 10.1093/toxsci/kfs006. [DOI] [PubMed] [Google Scholar]
- 37.Horie M, Fukui H, Nishio K, Endoh S, Kato H, Fujita K, Miyauchi A, Nakamura A, Shichiri M, Ishida N, et al. Evaluation of Acute Oxidative Stress Induced by NiO Nanoparticles In Vivo and In Vitro. J Occup Health. 2011;53:64–74. doi: 10.1539/joh.l10121. [DOI] [PubMed] [Google Scholar]
- 38.Kim IS, Baek M, Choi SJ. Comparative Cytotoxicity of Al(2)O(3), CeO(2), TiO(2) and ZnO Nanoparticles to Human Lung Cells. J Nanosci Nanotechnol. 2010;10:3453–3458. doi: 10.1166/jnn.2010.2340. [DOI] [PubMed] [Google Scholar]
- 39.Karlsson HL, Gustafsson J, Cronholm P, Moller L. Size-dependent Toxicity of Metal Oxide Particles-A Comparison between Nano- and Micrometer Size. Toxicol Lett. 2009;188:112–118. doi: 10.1016/j.toxlet.2009.03.014. [DOI] [PubMed] [Google Scholar]
- 40.Yang H, Liu C, Yang DF, Zhang HS, Xi ZG. Comparative Study of Cytotoxicity, Oxidative Stress and Genotoxicity Induced by Four Typical Nanomaterials: The Role of Particle Size, Shape and Composition. J Appl Toxicol. 2009;29:69–78. doi: 10.1002/jat.1385. [DOI] [PubMed] [Google Scholar]
- 41.Xu M, Fujita D, Kajiwara S, Minowa T, Li X, Takemura T, Iwai H, Hanagata N. Contribution of Physicochemical Characteristics of Nano-oxides to Cytotoxicity. Biomaterials. 2010;31:8022–8031. doi: 10.1016/j.biomaterials.2010.06.022. [DOI] [PubMed] [Google Scholar]
- 42.Landsiedel R, Ma-Hock L, Kroll A, Hahn D, Schnekenburger J, Wiench K, Wohlleben W. Testing Metal-Oxide Nanomaterials for Human Safety. Adv Mater. 2010;22:2601–2627. doi: 10.1002/adma.200902658. [DOI] [PubMed] [Google Scholar]
- 43.Huang CC, Aronstam RS, Chen DR, Huang YW. Oxidative Stress, Calcium homeostasis, and Altered Gene Expression in Human Lung Epithelial Cells Exposed to ZnO Nanoparticles. Toxicol Vitro. 2010;24:45–55. doi: 10.1016/j.tiv.2009.09.007. [DOI] [PubMed] [Google Scholar]
- 44.Zhao J, Shi X, Castranova V, Ding M. Occupational Toxicology of Nickel and Nickel Compounds. J Environ Pathol Toxicol Oncol. 2009;28:177–208. doi: 10.1615/jenvironpatholtoxicoloncol.v28.i3.10. [DOI] [PubMed] [Google Scholar]
- 45.Warheit DB, Reed KL, Sayes CM. A role for Nanoparticle Surface Reactivity in Facilitating Pulmonary Toxicity and Development of A Base set of Hazard Assays as A Component of Nanoparticle Risk Management. Inhal Toxicol. 2009;1:61–67. doi: 10.1080/08958370902942640. [DOI] [PubMed] [Google Scholar]
- 46.Monteiller C, Tran L, MacNee W, Faux S, Jones A, Miller B, Donaldson K. The Pro-inflammatory Effects of Low-toxicity Low-solubility Particles, Nanoparticles and Fine Particles, on Epithelial Cells In Vitro: The Role of Surface Area. Occup Environ Med. 2007;64:609–615. doi: 10.1136/oem.2005.024802. [DOI] [PMC free article] [PubMed] [Google Scholar]
- 47.Puzyn T, Rasulev B, Gajewicz A, Hu XK, Dasari TP, Michalkova A, Hwang HM, Toropov A, Leszczynska D, Leszczynski J. Using Nano-QSAR to Predict the Cytotoxicity of Metal Oxide Nanoparticles. Nat Nanotech. 2011;6:175–178. doi: 10.1038/nnano.2011.10. [DOI] [PubMed] [Google Scholar]
- 48.Hu XK, Cook S, Wang P, Hwang HM. In Vitro Evaluation of Cytotoxicity of Engineered Metal Oxide Nanoparticles. Sci Total Environ. 2009;407:3070–3072. doi: 10.1016/j.scitotenv.2009.01.033. [DOI] [PubMed] [Google Scholar]
- 49.Sayes C, Ivanov I. Comparative Study of Predictive Computational Models for Nanoparticle-Induced Cytotoxicity. Risk Anal. 2010;30:1723–1734. doi: 10.1111/j.1539-6924.2010.01438.x. [DOI] [PubMed] [Google Scholar]
- 50.McNeilly JD, Jimenez LA, Clay MF, MacNee W, Howe A, Heal MR, Beverland IJ, Donaldson K. Soluble Transition Metals in Welding fumes Cause Inflammation via Activation of NF-kappa B and AP-1. Toxicol Lett. 2005;158:152–157. doi: 10.1016/j.toxlet.2005.03.005. [DOI] [PubMed] [Google Scholar]
- 51.George S, Pokhrel S, Ji ZX, Henderson BL, Xia T, Li LJ, Zink JI, Nel AE, Madler L. Role of Fe Doping in Tuning the Band Gap of TiO(2) for the Photo-Oxidation-Induced Cytotoxicity Paradigm. J Am Chem Soc. 2011;133:11270–11278. doi: 10.1021/ja202836s. [DOI] [PMC free article] [PubMed] [Google Scholar]
- 52.Ivask A, Suarez E, Patel T, Boren D, Ji Z, Holden P, Telesca D, Damoiseaux R, Bradley KA, Godwin H. Genome-Wide Bacterial Toxicity Screening Uncovers the Mechanisms of Toxicity of a Cationic Polystyrene Nanomaterial. Environ Sci Technol. 2012;46:2398–2405. doi: 10.1021/es203087m. [DOI] [PubMed] [Google Scholar]
- 53.Hamilton RF, Wu NQ, Porter D, Buford M, Wolfarth M, Holian A. Particle Length-Dependent Titanium Dioxide Nanomaterials Toxicity and Bioactivity. Part Fibre Toxicol. 2009;6:35. doi: 10.1186/1743-8977-6-35. [DOI] [PMC free article] [PubMed] [Google Scholar]
- 54.Worle-Knirsch JM, Pulskamp K, Krug HF. Oops They Did It Again! Carbon Nanotubes Hoax Scientists in Viability Assays. Nano Lett. 2006;6:1261–1268. doi: 10.1021/nl060177c. [DOI] [PubMed] [Google Scholar]
- 55.Damoiseaux R, George S, Li M, Pokhrel S, Ji Z, France B, Xia T, Suarez E, Rallo R, Madler L, et al. No Time to Lose-high Throughput Screening to Assess Nanomaterial Safety. Nanoscale. 2011;3:1345–1360. doi: 10.1039/c0nr00618a. [DOI] [PMC free article] [PubMed] [Google Scholar]
- 56.Kato H, Fujita K, Horie M, Suzuki M, Nakamura A, Endoh S, Yoshida Y, Iwahashi H, Takahashi K, Kinugasa S. Dispersion Characteristics of Various Metal Oxide Secondary Nanoparticles in Culture Medium for In Vitro Toxicology Assessment. Toxicol Vitro. 2010;24:1009–1018. doi: 10.1016/j.tiv.2009.12.006. [DOI] [PubMed] [Google Scholar]
- 57.Teeguarden JG, Hinderliter PM, Orr G, Thrall BD, Pounds JG. ParticokineticsIn Vitro: Dosimetry Considerations for In Vitro Nanoparticle Toxicity Assessments. Toxicol Sci. 2007;95:300–312. doi: 10.1093/toxsci/kfl165. [DOI] [PubMed] [Google Scholar]
- 58.Ji ZX, Jin X, George S, Xia TA, Meng H, Wang X, Suarez E, Zhang HY, Hoek EMV, Godwin H, et al. Dispersion and Stability Optimization of TiO(2) Nanoparticles in Cell Culture Media. Environ Sci Technol. 2010;44:7309–7314. doi: 10.1021/es100417s. [DOI] [PMC free article] [PubMed] [Google Scholar]
- 59.Portier J, Campet G, Poquet A, Marcel C, Subramanian MA. Degenerate Semiconductors in the Light of Electronegativity and Chemical Hardness. Int J Inorg Mat. 2001;3:1039–1043. [Google Scholar]
- 60.Portier J, Campet G, Kwon CW, Etourneau J, Subramanian MA. Relationships between Optical Band Gap and Thermodynamic Properties of Binary Oxides. Int J Inorg Mat. 2001;3:1091–1094. [Google Scholar]
- 61.Kosmulski M. Surface Charging and Points of Zero Charge. CRC Press; Boca Raton: 2009. [Google Scholar]
- 62.Birmingham A, Selfors LM, Forster T, Wrobel D, Kennedy CJ, Shanks E, Santoyo-Lopez J, Dunican DJ, Long A, Kelleher D, et al. Statistical Methods for Analysis of High-throughput RNA Interference Screens. Nat Methods. 2009;6:569–575. doi: 10.1038/nmeth.1351. [DOI] [PMC free article] [PubMed] [Google Scholar]
- 63.Zhang XD. A New Method with Flexible and Balanced Control of False Negatives and False Positives for Hit Selection in RNA Interference High-throughput Screening Assays. J Biomol Screen. 2007;12:645–655. doi: 10.1177/1087057107300645. [DOI] [PubMed] [Google Scholar]
- 64.Zhang XD. A Pair of New Statistical Parameters for Quality Control in RNA Interference High-throughput Screening Assays. Genomics. 2007;89:552–561. doi: 10.1016/j.ygeno.2006.12.014. [DOI] [PubMed] [Google Scholar]
- 65.Ulmer DD. Optical Rotatory Dispersion of Oxidized and Reduced Cytochrome C. Biochemistry. 1965;4:902–907. doi: 10.1021/bi00881a017. [DOI] [PubMed] [Google Scholar]
- 66.Eden D, Matthew JB, Rosa JJ, Richards FM. Increase in Apparent Compressibility of Cytochrome-C Upon Oxidation. Proc Natl Acad Sci U S A. 1982;79:815–819. doi: 10.1073/pnas.79.3.815. [DOI] [PMC free article] [PubMed] [Google Scholar]
Associated Data
This section collects any data citations, data availability statements, or supplementary materials included in this article.