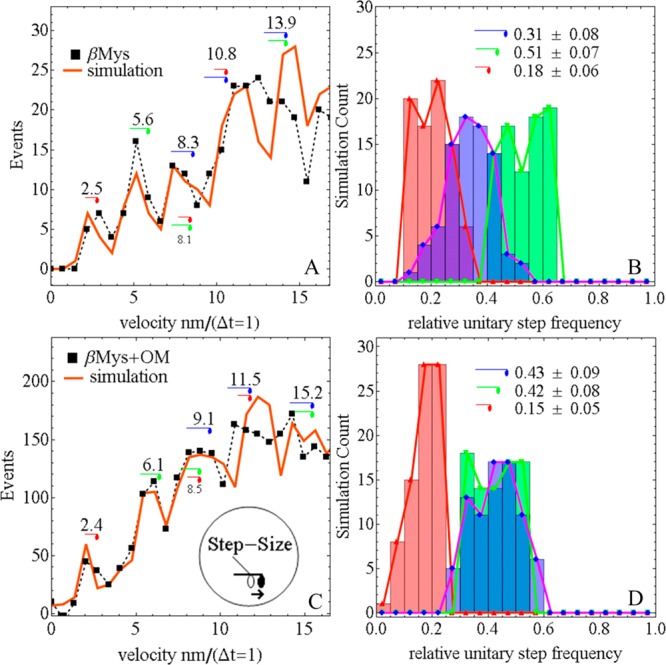
Figure 4.

Qdot assay velocity event density histogram (left) and step-frequency histogram (right) for βMys in the absence (top row) or presence (bottom row) of OM and 1% DMSO. Measured (■ and dashed line) and simulated (red line) data are shown for the velocity curve. The inset in panel C indicates translation of the motor domain associated with a unitary step-size and a lever-arm rotation. Unitary steps of ∼3 nm (red), ∼5 nm (green), and ∼8 nm (blue) are indicated symbolically near their event distribution peak. Several unitary step combinations are also indicated. The simulated velocity curve corresponds to the best fitting single simulation, while the histograms summarize findings from the 80 best simulations. Each simulated curve provided the number of unitary events for 3, 5, and 8 nm steps that is converted to relative unitary step-frequency by dividing the unitary step count by the total number of 3, 5, and 8 nm unitary steps, respectively. Relative unitary step-frequency summed over the 3 unitary steps is 1 for each simulation.
