

Abstract
A novel MALDI-FTICR imaging mass spectrometry (MALDI-IMS) workflow is described for on-tissue detection, spatial localization, and structural confirmation of low abundance bioactive ceramides and other sphingolipids. Increasingly, altered or elevated levels of sphingolipids, sphingolipid metabolites, and sphingolipid metabolizing enzymes have been associated with a variety of disorders such as diabetes, obesity, lysosomal storage disorders, and cancer. Ceramide, which serves as a metabolic hub in sphingolipid metabolism, has been linked to cancer signaling pathways and to metabolic regulation with involvement in autophagy, cell-cycle arrest, senescence, and apoptosis. Using kidney tissues from a new Farber disease mouse model in which ceramides of all acyl chain lengths and other sphingolipid metabolites accumulate in tissues, specific ceramides and sphingomyelins were identified by on-tissue isolation and fragmentation, coupled with an on-tissue digestion by ceramidase or sphingomyelinase. Multiple glycosphingolipid species were also detected. The newly generated library of sphingolipid ions was then applied to MALDI-IMS of human lung cancer tissues. Multiple tumor specific ceramide and sphingomyelin species were detected and confirmed by on-tissue enzyme digests and structural confirmation. High-resolution MALDI-IMS in combination with novel on-tissue ceramidase and sphingomyelinase enzyme digestions makes it now possible to rapidly visualize the distribution of bioactive ceramides and sphingomyelin in tissues.
Sphingolipids are a class of membrane biomolecules that include ceramides, sphingomyelins, sphingosine-1-phosphate (S-1-P), and glycosphingolipids, all of which are important for maintaining cell integrity and signal transduction processes.1−3 Consequently, altered or elevated levels of sphingolipids, sphingolipid metabolites, and sphingolipid metabolizing enzymes have been associated with a variety of disorders such as diabetes, obesity, lysosomal storage disorders, and cancer.1−14 Ceramides, which serve as a metabolic hub in sphingolipid metabolism, have been linked to cancer signaling pathways, a connection manifest by their involvement in autophagy, cell-cycle arrest, senescence, and apoptosis.1,2,8,9 While ceramides are pro-apoptotic in tumor cells, S-1-P, a ceramide metabolite, is antiapoptotic and promotes tumorigenesis.1−3,15−17
The levels of ceramide, sphingosine, and S-1-P are maintained by five distinct ceramidases, one of which is acid ceramidase (ACDase). These enzymes cleave ceramides into fatty acids and sphingosine, which in turn can be phosphorylated to the antiapoptotic (S-1-P) metabolite by sphingosine kinase.1,18 Because ACDase regulates the balance of pro (ceramides) versus antiapoptotic (S-1-P) metabolites, it is not surprising that ACDase overexpression is a hallmark of many cancers.2,4,18,19 Likewise in prostate, pancreatic, and nonsmall cell lung carcinomas (NSCLC), ACDase overexpression, and lower levels of intracellular ceramide, have also been linked to chemo- and radiation resistance, thus establishing ACDase as a potential therapeutic target.3,4,15,19−21 Importantly, well-established cancer drugs such as tamoxifen and carmofur have recently been found to modulate ACDase expression and directly inhibit its activity.22,23 This suggests that the efficacy of these drugs is dependent on manipulation of ceramides; thus, anticancer therapies could be enhanced by targeting ceramide metabolism.3,4,15,17,22−24 These findings highlight the importance of ceramide metabolism in cancer pathogenesis and the need for novel methods to identify and detect these species within cancer tissues.
Currently, liquid chromatography mass spectrometry (LC-MS) is the standard method used to identify sphingolipids within tissue; however, it confers no localization component relative to the histopathology of the tissue.25,26 Conversely, MALDI imaging mass spectrometry (MALDI-IMS) offers the distinct ability to spatially profile the distribution of a specific ion across a tissue of interest, linking the localization of the ion to the histopathology of the tissue.27,28 Although it was initially developed to spatially profile proteins and peptides within tissues,29−32 the variety of species that can now be imaged has greatly increased. Incorporation of high resolution Fourier transform ion cyclotron resonance (FTICR) MALDI mass spectrometry instruments in imaging workflows has facilitated detection of unique and lower abundance classes of positively and negatively charged lipids, N-linked glycans, drug compounds, and metabolites.33−40 While MALDI tissue imaging studies have been used to profile abundant lipid species across different tissue types,10,33−38,41 a definitive and comprehensive structural and tissue distribution analysis of bioactive ceramides and other important sphingolipids has not been reported, possibly due to their very low levels and to challenges in verifying their identity.
In this study, a workflow to profile ceramides was developed and validated in kidney tissues from an acid ceramidase-deficient mouse model (Asah1P361R/P361R) of Farber disease, which has significant accumulations of ceramides in various tissues.12 Detection of ceramide and sphingomyelin species was validated by structural fragmentation, comparison to standards, and on-tissue digestions with exogenous ceramidase or sphingomyelinase for ceramide and sphingomyelin species. The same strategy was applied to image and identify tumor-specific ceramides and other sphingolipids in matched nontumor and nonsmall cell lung carcinoma tissues (NSCLC). Defining these ceramide and sphingomyelin species further allowed identification of dehydroceramide, hydroxyceramide, and glycosphingolipid species. The data demonstrate the potential of using high-resolution MALDI-IMS to identify sphingolipid biomarkers related to human disorders of metabolism and cancers.
Materials and Methods
Materials
Ceramide lipid standards were purchased from Avanti-Polar Lipids Inc. (Alabaster, AL). 2,5-Dihydroxybenzioc acid (DHB) and trifluoroacetic acid (TFA) were obtained from Sigma-Aldrich (St. Louis, MO). HPLC-grade methanol (MeOH), ethanol, and water were obtained from Fisher Scientific. Indium tin oxide (ITO) slides were purchased from Bruker for MALDI-IMS experiments. Recombinant bCDase and bSMase were expressed and purified as previously described.20
Animal Model and Tissues
A single nucleotide mutation found in a patient was introduced into the murine Asah1 gene (Asah1P361R/P361R) to generate a knock-in model of Farber disease.12 Further details of the generation and characterization of this Farber disease model are described in Alayoubi et al.12 Animals were maintained under an ACC-approved protocol at the University Health Network in Toronto. Whole excised kidneys from 9 week-old euthanized animals were placed in weigh-boats and rapidly frozen with liquid nitrogen in the vapor phase for 2 min and placed directly in liquid nitrogen for 30 s. Mouse kidneys were stored at −80 °C until sectioning. Tissues were sectioned (10 μm) with a Thermo Microm HM550 cryostat. For each section analyzed, a serial section was collected for histological analysis and staining with hematoxylin and eosin (H&E). Human noncancer and nonsmall cell lung carcinoma tissues were collected under IRB approved and patient consented protocols in the Department of Surgery at MUSC and registered in the Hollings Cancer Center Biorepository and Tissue Analysis Resource. Samples were deidentified to the laboratory investigators.
MALDI Imaging Mass Spectrometry
Sectioned mouse kidney tissue samples were mounted on ITO coated slides and desiccated at room temperature for 20 min. An ImagePrep spray station (Bruker Daltonics) was used to coat the slide with a 0.2 mL solution containing 8 mU of the bCDase or 2 mU of the bSMase enzyme. This solution was sprayed by the ImagePrep using settings originally optimized for spraying trypsin. These settings result in minimal volumes and retention of spatial distribution. Control tissue slices were blocked with a glass slide during the spraying process. Following enzyme application, slides were incubated at 37 °C for 2 h in a humidified chamber and dried in a desiccator prior to matrix application. DHB matrix at a concentration of 0.2 M in 50% MeOH and 0.01% TFA was sprayed onto the slide using the ImagePrep for analysis in positive ion mode. Spectra were acquired across the entire tissue section on a Solarix dual source 7T FTICR mass spectrometer (Bruker Daltonics) to detect the lipid species of interest (m/z 200–2000) with a SmartBeam II laser operating at 1000 Hz, a laser spot size of 25 μm, and a raster width of 200 μm for general profiling or 75 μm for high resolution images. For each laser spot, 800 spectra were averaged. Images of differentially expressed lipids were generated using FlexImaging 4.0 software (Bruker Daltonics). Following MS analysis, data was loaded into FlexImaging Software focusing on the m/z range of 200–2000 and reduced to 0.98 ICR Reduction Noise thresholds. All data was normalized using root means square,42 and intensities were normalized to each other per figure as indicated in the figure legends.
Continuous Accumulation of Selected Ions and Collision-Induced Dissociation
Continuous accumulation of selected ions/collision-induced dissociation (CASI/CID) fragmentation was done with reference standards spotted on a MALDI plate with DHB matrix or directly off tissue. CASI allows for trapping of a specific ion of interest within the quadrupole of the Solarix 7T FTICR mass spectrometer. Following accumulation, the selected ion was fragmented using CID. Structural assignments were made following detection of specific fragmentation patterns and cross-validated with the Lipid Maps database.
Quantitation of Ceramides
Ceramide levels of tissue lysates from 9 week-old Farber mice were determined using LC-MS/MS as described previously.43
Results
MALDI Imaging Mass Spectrometry of Tissue Ceramides
To develop a systemic approach to profile the distribution of low abundance ceramide species in tissues, a novel and established mouse model of Farber disease that expresses variant ACDase homozygous Asah1P361R/P361R was used.12 This model mimics Farber disease in the accumulation of ceramide species of varying chain lengths in tissues and in clinical features.12 Kidneys were chosen as a starting material because they are affected by Farber disease and they offer suitable histopathological detail in regards to MALDI-IMS experiments. Ceramides are a central hub in sphingolipid metabolism, as summarized in Figure 1, and we hypothesized that these Farber model kidneys could contain all of the major and minor metabolites. Kidneys from wild-type, heterozygous, and homozygous mice were collected, frozen, and sectioned at 10 μm and thaw-mounted on ITO-coated glass slides. Sections were either sprayed with DHB matrix and analyzed by MALDI-IMS for lipid analysis or subjected to enzyme digestions prior to analysis (Supplemental Figure 1a, Supporting Information). Separate serial sections of each kidney were stained with H&E (Figure 2a and Supplemental Figure 1b, Supporting Information) for comparison. A variety of ceramide species with acyl chain lengths of C16–C24 and multiple counterions (H+, Na+, or K+) were detected primarily in the homozygous Asah1P361R/P361R kidneys (Figure 2b; Supplemental Table 1, Supporting Information), relative to heterozygote and control kidneys, and varied in chain length for each species by 28 mass units. The detected masses are also consistent with a small number of ceramide species detected by MALDI-IMS in human adrenal gland tissues.34 The ceramide species detected along with their relative intensity levels were consistent with the total concentration levels of the same kidney ceramides as determined from tissue lysates by LC-MS/MS (Figure 2c). Ion suppression and variation across tissue sections or matrix affects can be problematic in MALDI imaging experiments; thus, data was normalized using root mean squares optimal for MALDI-FTICR data.42
Figure 1.
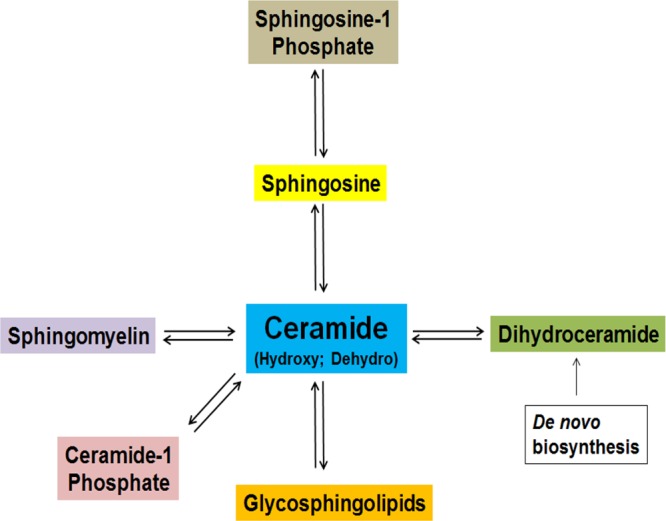
Summary schematic of ceramide metabolism.
Figure 2.

Analysis of ceramide species in wild type, heterozygous, and Asah1P361R/P361R murine kidneys. Signal intensities were normalized across the tissues at 60%. (a) H&E stain of serial kidney sections. Higher resolution images are shown in Supplementary Figure 1b, Supporting Information. (b) Representative MALDI-IMS data of sphingosine-1-phosphate and four ceramide species. A phosphatidylcholine (PC 34:0) was included for distribution comparisons. (c) LC-MS/MS quantitative data of the ceramides from kidney tissue lysates of wild-type, heterozygous, and Asah1P361R/P361R mice.
Further, linking the histopathology of the Asah1P361R/P361R kidney (Figure 3a) to the imaging data shows the distinct distribution of ceramide species. A high-resolution MALDI image of the Farber kidney is included that documents the presence of sphingosine-1-phosphate and two ceramide-1-phosphates (C16:0 and C22:0) (Figure 3b) along with two ceramide species detected primarily in the kidney medulla (C18:0) (Figure 3c, panel 2) or cortex (C16:0 and C24:1) (Figure 3c, panel 1, 3). An example of a hydroxyceramide species (C24:1) is shown in Figure 3c, panel 4. Differential ceramide distribution within the Farber kidney is especially evident in the overlay images of the different species (Figure 3d) and also include two species of monohexose-ceramides (C24:0 and C26:0).
Figure 3.

Ceramide distribution in Asah1P361R/P361R Farber mice kidneys. (a) H&E of Farber mouse kidney. (b) Distribution of sphingosine-1-phosphate and two ceramide-1-phosphate examples. (c) Select ceramides showing distribution specific to medulla or cortex are shown in the first three panels. The fourth panel is a hydroxyceramide. (d) Colocalization of different ceramides are shown in the first three panel overlays. An overlay of two hexosylceramides is shown in the fourth panel. All ions were normalized to the same intensities.
Initially, structural assignment of the ceramides was performed on the basis of accurate masses and cross-referenced to the LIPID MAPS database (http://www.lipidmaps.org/). In order to verify that the species being detected were all ceramides as indicated, it was necessary to demonstrate that the compounds being profiled remained intact during the laser desorption ionization process. This was accomplished using a panel of sphingolipid standards representing different ceramides, sphingosine-1-phosphate, ceramide-1-phosphate, sphingomyelins, and glycosphingolipids (Supplemental Figure 2a–i, Supporting Information). These standards were spotted on a steel MALDI plate with DHB matrix and analyzed using the Bruker Solarix 70T FTICR mass spectrometer. For comparison, the same standards were measured on a separate MALDI instrument, a Bruker AutoFlex III MALDI-TOF/TOF in linear and reflectron modes. Use of the FTICR instrument readily identified the expected parent masses of each sphingolipid standard. Continuous accumulation of selected ions/collision-induced dissociation (CASI/CID) fragmentation further confirmed the expected structural components, in particular detection of an ion at m/z = 264 that is the sphingoid base common to all sphingolipid species. Identification of this 264 ion as a component of ceramide species previously has been reported.6,25 Fragmentation of sphingomyelins produced CID patterns characterized by the loss of their phosphocholine headgroup (Supplemental Figure 1d, Supporting Information); fragmentation of sphingosine-1-phosphate demonstrated loss of phosphate (Supplemental Figure 2e, Supporting Information), and for glycosphingolipids (Supplemental Figure 2f,g, Supporting Information), fragmentation was accompanied by loss of the intact glycans. The corresponding linear and reflectron spectra generated by the MALDI-TOF were less robust, with frequent dehydroxylation of the parent molecule and other fragmentations. Retaining the intact glycolipids and other standards reflect the high-pressure collisional cooling condition following MALDI ionization that is used in the Bruker Solarix FTICR mass spectrometer.44−46 Following this experiment, ceramides with fatty acyl chain lengths from C12–C26 were directly isolated from Farber kidney tissue by CASI/CID. This allowed simultaneous capture and enrichment of selected ceramide species, followed by CID fragmentation and detection of the confirmatory sphingoid base ion at 264.1. Representative capture and fragmentation spectra the different ceramides in tissue are provided in Supplemental Figure 3a–h, Supporting Information.
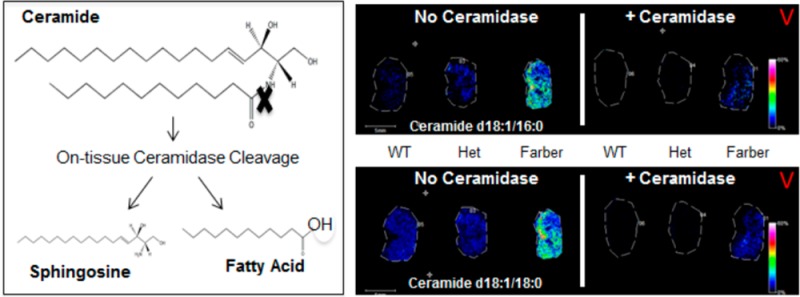
On-Tissue Ceramidase Digestion
While CASI/CID is an accurate method for on-tissue confirmation of ceramide structures, these species exist in a background of more abundant sphingomyelin and glycerophospholipids present in tissues at similar masses that can affect isolation and CID identification of each potential ceramide of interest. In order to more quickly and definitively identify ceramide species in tissues, we incorporated an on-tissue digestion of ceramides in kidney tissues with recombinant bacterial ceramidase from Pseudomonas aeroginosa (bCDase)20 prior to MALDI-IMS (Figure 4a). Action of bCDase produces a sphingosine and a fatty acid (Figure 4b). Kidneys from wild-type, heterozygous, and homozygous Farber mice were sectioned in duplicate, with half of the slide sprayed with bCDase at a concentration of 8 mU and the other half covered by a glass slide as a control (Figure 4a). As expected, the treated tissues showed a decrease in Farber-specific ceramide species ions compared to nontreated tissues (Figure 4a). As expected, the glycosphingolipid species were not sensitive to ceramidase, as illustrated by a monohexose-ceramide (C24:1+K), nor were glycerophospholipids like the shown phosphatidylcholine PC (34:0) (Figure 4d).
Figure 4.

On-tissue bCDase digestion of murine kidney tissues. (a) Kidneys were sectioned and placed as mirror images on an ITO coated slide. The tissues on the left part of the slide were covered while the right half was sprayed with bCDase. Following MALDI-IMS, all intensities were normalized to each other at 60%. (b) bCDase cleavage produces a sphingosine and a fatty acid. (c) Lack of ceramidase cleavage is shown for an example hexosylceramide and phosphatidylcholine to demonstrate enzyme specificity.
A known feature of Farber disease is also the accumulation of hydroxylated ceramide species.47 From the same bCDase digestion, ions corresponding to hydroxlated ceramides were detected in the Farber tissues (Supplemental Figure 4a,b, Supporting Information). Additionally, these species decreased following bCDase digestion (Supplemental Figure 4c, Supporting Information), and their identities correlated with the LC-MS/MS data of kidney homogenates (Supplemental Figure 4d, Supporting Information) and clinical data.14 Overall, the bCDase digestion provided a rapid enzymatic biochemical verification of global ceramide expression within the tissues, and all identified ceramides are included (Supplemental Table 1, Supporting Information).
Sphingomyelin Identification and Sphingomyelinase
Less is known about the heterogeneity of sphingomyelin (SM) species expression in Farber disease; thus, their distributions were also assessed in the same kidney tissues. Farber kidneys were sectioned, H&E stained (Figure 5a), and analyzed. Results suggest that a SM (d18:1/16:0) species is uniformly detected across the three kidneys (Figure 5b) while the longer chain SM (d18:2/24:1) was elevated in the Farber tissues. Similar to the bCDase digestions, an analogous on-tissue digestion with an exogenous bacterial sphingomyelinase (bSMase) from Bacillus cereus was performed. bSMase releases phosphocholine and ceramide as products (Figure 5c), and the resulting ceramide therefore will differ from the parent SM by a phosphocholine headgroup (184 mass units). As shown in Figure 5d, the left side of the section was treated with 2mU bSMase and showed a decrease in SM concentration. The cleavage product produced from digestion can also be seen in the treated tissues in the right panel (Figure 5d). Levels of a phosphatidylcholine (C38:0) species were included to show enzyme specificity across the tissues, and the m/z values of the sphingomyelin species identified are listed in Supplemental Table 1, Supporting Information.
Figure 5.
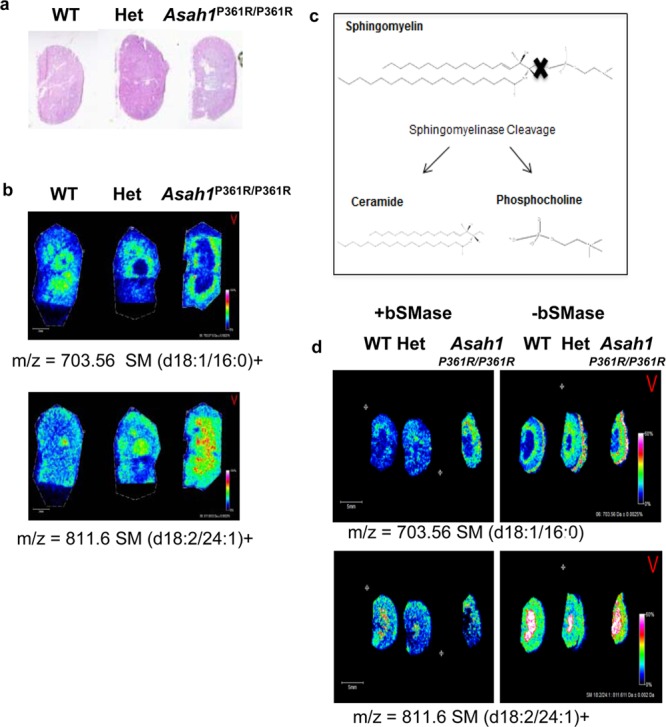
On-tissue bSMase digestion of kidney tissues. (a) H&E of the kidney tissues processed for bSMase. Higher resolution images are shown in Supplementary Figure 1b, Supporting Information. (b) Example sphingomyelins identified across the tissues, SM (d18:1/16:0) and (18:2/24:1). (c) bSMase produces a ceramide and choline phosphate. (d) For the bSMase digestion, kidneys were sectioned and placed as mirror images on an ITO coated slide. The tissues on the left side of the slide were sprayed with enzyme while the right side was an unsprayed control.
Analysis of Nonsmall Cell Lung Carcinoma Tissues
To implement these techniques in a true discovery mode in the context of human cancers, we next analyzed tissues derived from human nonsmall cell lung carcinomas (NSCLC). A squamous tumor and normal tissue from a subject with NSCLC were sectioned (Figure 6a), and the same ceramide and SM workflow was applied, with and without bCDase and bSMase digestions. As expected, overall endogenous ceramide levels were noticeably lower in these tissue sections and difficult to detect by MALDI-IMS. However, two ceramide species (d18:1/12:0+K and d18:0/20:0+Na) were detected at elevated levels in only the NSCLC tissue (Figure 6b). The structures of these ceramides were confirmed using CID and bCDase enzyme digestions (Figure 6c; Supplementary Figure 2, Supporting Information). Two hexosylceramides (HexCer d18:1/22:1 and d18:1/24:1) were also detected at elevated levels in the NSCLC tissue. The presence of the more abundant sphingomyelins was also assessed (Figure 6e), and two species (d18:1/16:0 and d18:0/20:0) were also elevated in the tumor. Another SM (d18:1/18:0) showed equal distribution across both tissues. The structures were confirmed by CID and bSMase digestion (Figure 6f; Supplemental Figure 5a–d, Supporting Information).
Figure 6.

MALDI-IMS workflows on tissues from normal and tumor nonsmall cell lung carcinoma (NSCLC) tissues. (a) H&E of the normal and squamous NSCLC lung tissues processed for analysis. Higher resolution images of these tissues are provided in Supplementary Figure 6, Supporting Information. (b) Ceramides identified across the tissues. (c) The right panel shows the bCDase workflow demonstrating a decrease in the relative amounts of ceramide. (d) Two examples of hexosylceramides elevated in lung tumor. (e) Sphingomyelins were identified in the lung tissues, with SM (d18:1/16:0)+K and SM (d18:0/20:0) elevated in the tumor tissues. (f) Similarly, bSMase digestion decreased levels of the detected sphingomyelins.
Discussion
The combination of a unique Farber disease model with on-tissue enzymatic and CID structural confirmation facilitated development of a novel and comprehensive MALDI-IMS workflow to identify and visualize multiple low-abundance sphingolipid metabolites directly in tissue sections. Tandem liquid chromatography mass spectrometry has been the gold standard in identifying and quantifying sphingolipid species derived from tissue samples. However, it cannot provide the spatial distribution and localization of these species within the tissues of interest, which increasingly is critical to know when assigning signal transduction functions to specific sphingolipid species. MALDI-IMS imaging directly provides the capability of simultaneously profiling the distribution of all detectable sphingolipids within a given tissue, complementing the quantitative data obtained with LC-MS. The central role of ceramides in sphingolipid metabolism (Figure 1) made these molecules the primary target for initial characterization; as once their respective masses could be defined, the blueprint for characterizing the other metabolites was available. Starting with tissues derived from a Farber disease mouse model in which all ceramide species accumulate was a crucial component, essentially serving as a biological tissue standard. Multiple ceramide, ceramide phosphate, glucosylceramides, and sphingomyelin species were detected, as well as sphingosine-1-phosphate. Structural information such as fatty acyl chain length and degree of saturation was also obtained. Distributions of each of the ceramide and sphingomyelin species within the tissues were then directly linked to their localization within the cortex and medulla regions of the Farber kidney tissue. Addition of upfront on-tissue digestions with bCDase proved beneficial when confirming ceramide and hydroxylated ceramide identities. The bCDase and bSMase incorporation also provides a rapid way to generate a quick global view for detection of the abundance and distribution of ceramides and sphingomyelins of interest, while also providing enzymatic-based biochemical structural verifications.
The workflow optimized in the Farber experiments was then successfully applied to tissues derived from nonsmall cell lung carcinomas. Tumor-specific ceramides and sphingomyelins could be readily detected, identified, and correlated to specific tissue locations. Knowing the distribution and identity of ceramides and sphingomyelins within tumor tissue samples could be useful in addressing many questions concerning the role of ceramides and sphingomyelins in cancer initiation and progression. For example, does ceramide acyl chain length or saturation modulate cancer progression? If so, could these structural characteristics be used to develop new cancer diagnostics?13,48 Furthermore, because these biomolecules are assessable now at the tissue level, it can be determined whether the elevation of a ceramide species is specific to an individuals’ tumor or more generalizable to NSCLC or other subtypes. If their concentrations change with treatment as determined in tissues, it could also be feasible to monitor these changes as potential therapeutic biomarkers in matched patient biofluids.
High-resolution imaging could also be beneficial in understanding how anticancer drugs modify ceramide metabolism. For example, tamoxifen and carmofur, which are currently used in anticancer treatment, were recently found to inhibit acid ceramidase activity.22,23 These findings suggest a new role for these drugs within cancer therapies focused on targeting ceramide metabolism, and as such, their effects on ceramide metabolism could be measured using MALDI-IMS approaches. Tumor chemoresistance is also a formidable challenge facing clinicians in designing cancer treatments. Accordingly, combination therapies that include targeting of sphingolipid metabolism are being assessed to resensitize drug-resistant tumor cells.4,18,19,21−24,49,50 This has recently been demonstrated in NSCLC tumors which often acquire resistance to choline kinase α (ChoKα) inhibitor therapy specifically due to an elevation of acid ceramidase. Interestingly, when an acid ceramidase inhibitor was administered with the ChoKα inhibitor, resistance did not occur.19 Implementation of MALDI-IMS studies within these workflows could help identify specific ceramide species which predict tumor resistance.
The imaging methods established herein are feasible for any fresh-frozen tissue samples, and similar approaches can be done to identify the distribution of more complex glycosphingolipids in tissues. As demonstrated, this is possible due to the use of the Solarix MALDI-FTICR mass spectrometer, which applies a high pressure collisional cooling condition after MALDI ionization that preserves the intact glycolipid.44−46 A similar strategy could be applied using other lysosomal storage disease models that accumulate distinct glycosphingolipid species, for example, Gaucher disease and glucosylceramides or Fabry disease and globotrioasylceramides. In combination with on-tissue application of their corresponding degradative enzymes and MALDI-IMS, the approach could effectively identify and generate a database of target glycosphingolipid structures. The database and degradative enzymes could in turn be used for analysis of other tissues, other glycosphingolipids, and charged sulfated galactosylceramides (i.e, sulfatides51). In conclusion, novel MALDI-IMS workflows such as those established herein offer a new approach to aid in visualizing and deciphering the role of sphingolipids in lysosomal storage diseases, cancer, and other disorders.
Acknowledgments
This work was supported by grants from the National Institutes of Health/National Cancer Institute (R01CA135087), the Department of Defense (W81XWH-10-1-0136), and the state of South Carolina SmartState Endowed Research program to R.R.D. Additional resources and support were from the Biorepository & Tissue Analysis Shared Resource, Hollings Cancer Center (P30 CA138313) and the South Carolina Clinical and Translational Research (SCTR) Institute (UL1 RR029882 and UL1 TR000062) for R.R.D.; from a National Institutes of Health/National Cancer Institute grant CA097132 (to Y.A.H.); a Vaincre Les Maladies Lysosomales (VML) grant award (to T.L. and J.A.M.); and National Institutes of Health grant R21NS078191 (to J.A.M.).
Supporting Information Available
A file of supplemental figures and data tables. This material is available free of charge via the Internet at http://pubs.acs.org/.
The authors declare no competing financial interest.
Funding Statement
National Institutes of Health, United States
Supplementary Material
References
- Hannun Y. A.; Obeid L. M. J. Biol. Chem. 2011, 286, 27855–27862. [DOI] [PMC free article] [PubMed] [Google Scholar]
- Morad S. A.; Cabot M. C. Nat. Rev. Cancer 2013, 13, 51–65. [DOI] [PubMed] [Google Scholar]
- Liu J.; Beckman B. S.; Foroozesh M. Future Med. Chem. 2013, 5, 1405–1421. [DOI] [PMC free article] [PubMed] [Google Scholar]
- Beckham T. H.; Lu P.; Jones E. E.; Marrison T.; Lewis C. S.; Cheng J. C.; Ramshesh V. K.; Beeson G.; Beeson C. C.; Drake R. R.; Bielawska A.; Bielawski J.; Szulc Z. M.; Ogretmen B.; Norris J. S.; Liu X. J. Pharm. Exp. Ther. 2013, 344, 167–178. [DOI] [PMC free article] [PubMed] [Google Scholar]
- Blachnio-Zabielska A. U.; Pulka M.; Zabielski P.; Gorska M.; Gorski J. J. Cell. Physiol. 2012, 227, 550–557. [DOI] [PubMed] [Google Scholar]
- Chen Y.; Liu Y.; Sullards M. C.; Merrill A. H. Jr. NeuroMol. Med. 2010, 12, 306–319. [DOI] [PMC free article] [PubMed] [Google Scholar]
- Kim I. C.; Lee J. H.; Bang G.; Choi S. H.; Kim Y. H.; Kim K. P.; Kim H. K.; Ro J. Anticancer Res. 2013, 33, 2467–2472. [PubMed] [Google Scholar]
- Saddoughi S. A.; Ogretmen B. Adv. Cancer Res. 2013, 117, 37–58. [DOI] [PubMed] [Google Scholar]
- Slotte J. P. Prog. Lipid Res. 2013, 52, 424–437. [DOI] [PubMed] [Google Scholar]
- Vouk K.; Hevir N.; Ribic-Pucelj M.; Haarpaintner G.; Scherb H.; Osredkar J.; Moller G.; Prehn C.; Rizner T. L.; Adamski J. Hum. Reprod. 2012, 27, 2955–2965. [DOI] [PubMed] [Google Scholar]
- Zhu J.; Wang Y.; Yu Y.; Wang Z.; Zhu T.; Xu X.; Liu H.; Hawke D.; Zhou D.; Li Y. Liver Int. 2014, 34, 147–160. [DOI] [PubMed] [Google Scholar]
- Alayoubi A. M.; Wang J. C.; Au B. C.; Carpentier S.; Garcia V.; Dworski S.; El-Ghamrasni S.; Kirouac K. N.; Exertier M. J.; Xiong Z. J.; Prive G. G.; Simonaro C. M.; Casas J.; Fabrias G.; Schuchman E. H.; Turner P. V.; Hakem R.; Levade T.; Medin J. A. EMBO Mol. Med. 2013, 5, 827–842. [DOI] [PMC free article] [PubMed] [Google Scholar]
- Hartmann D.; Lucks J.; Fuchs S.; Schiffmann S.; Schreiber Y.; Ferreiros N.; Merkens J.; Marschalek R.; Geisslinger G.; Grosch S. Int. J. Biochem. Cell Biol. 2012, 44, 620–628. [DOI] [PubMed] [Google Scholar]
- Samuelsson K.; Zetterstrom R. Scand. J. Clin. Lab. Invest. 1971, 27, 393–405. [DOI] [PubMed] [Google Scholar]
- Barth B. M.; Cabot M. C.; Kester M. Anti-Cancer Agents Med. Chem. 2011, 11, 911–919. [DOI] [PubMed] [Google Scholar]
- Beckham T. H.; Cheng J. C.; Lu P.; Shao Y.; Troyer D.; Lance R.; Marrison S. T.; Norris J. S.; Liu X. Oncogenesis 2013, 2, e49. [DOI] [PMC free article] [PubMed] [Google Scholar]
- Kolesnick R. J. Clin. Invest. 2002, 110, 3–8. [DOI] [PMC free article] [PubMed] [Google Scholar]
- Selvam S. P.; Ogretmen B. Handb. Exp. Pharmacol. 2013, 3–27. [DOI] [PubMed] [Google Scholar]
- Ramirez de Molina A.; de la Cueva A.; Machado-Pinilla R.; Rodriguez-Fanjul V.; Gomez del Pulgar T.; Cebrian A.; Perona R.; Lacal J. C. Curr. Cancer Drug Targets 2012, 12, 617–624. [DOI] [PubMed] [Google Scholar]
- Canals D.; Hannun Y. A. Handb. Exp. Pharmacol. 2013, 211–238. [DOI] [PMC free article] [PubMed] [Google Scholar]
- Casson L.; Howell L.; Mathews L. A.; Ferrer M.; Southall N.; Guha R.; Keller J. M.; Thomas C.; Siskind L. J.; Beverly L. J. PloS One 2013, 8, e54525. [DOI] [PMC free article] [PubMed] [Google Scholar]
- Morad S. A.; Levin J. C.; Tan S. F.; Fox T. E.; Feith D. J.; Cabot M. C. Biochim. Biophys. Acta 2013, 1831, 1657–1664. [DOI] [PubMed] [Google Scholar]
- Realini N.; Solorzano C.; Pagliuca C.; Pizzirani D.; Armirotti A.; Luciani R.; Costi M. P.; Bandiera T.; Piomelli D. Sci. Rep. 2013, 3, 1035. [DOI] [PMC free article] [PubMed] [Google Scholar]
- Korbelik M.; Zhang W.; Saw K. M.; Szulc Z. M.; Bielawska A.; Separovic D. J. Photochem. Photobiol. 2013, 126, 72–77. [DOI] [PMC free article] [PubMed] [Google Scholar]
- Pettus B. J.; Bielawska A.; Kroesen B. J.; Moeller P. D.; Szulc Z. M.; Hannun Y. A.; Busman M. Rapid Commun. Mass Spectrom. 2003, 17, 1203–1211. [DOI] [PubMed] [Google Scholar]
- Sullards M. C.; Liu Y.; Chen Y.; Merrill A. H. Jr. Biochim. Biophys. Acta 2011, 1811, 838–853. [DOI] [PMC free article] [PubMed] [Google Scholar]
- Schone C.; Hofler H.; Walch A. Clin. Biochem. 2013, 46, 539–545. [DOI] [PubMed] [Google Scholar]
- Schwamborn K.; Caprioli R. M. Nat. Rev. Cancer 2010, 10, 639–646. [DOI] [PubMed] [Google Scholar]
- Cazares L. H.; Troyer D.; Mendrinos S.; Lance R. A.; Nyalwidhe J. O.; Beydoun H. A.; Clements M. A.; Drake R. R.; Semmes O. J. Clin. Cancer Res. 2009, 15, 5541–5551. [DOI] [PubMed] [Google Scholar]
- Morgan T. M.; Seeley E. H.; Fadare O.; Caprioli R. M.; Clark P. E. J. Urol. 2013, 189, 1097–1103. [DOI] [PMC free article] [PubMed] [Google Scholar]
- Nicklay J. J.; Harris G. A.; Schey K. L.; Caprioli R. M. Anal. Chem. 2013, 85, 7191–7196. [DOI] [PMC free article] [PubMed] [Google Scholar]
- Seeley E. H.; Caprioli R. M. Proc. Natl. Acad. Sci. U.S.A. 2008, 105, 18126–18131. [DOI] [PMC free article] [PubMed] [Google Scholar]
- Anderson D. M.; Mills D.; Spraggins J.; Lambert W. S.; Calkins D. J.; Schey K. L. Mol. Vision 2013, 19, 581–592. [PMC free article] [PubMed] [Google Scholar]
- Wang X.; Han J.; Pan J.; Borchers C. H. Anal. Chem. 2014, 86, 638–646. [DOI] [PubMed] [Google Scholar]
- Chughtai K.; Jiang L.; Greenwood T. R.; Glunde K.; Heeren R. M. J. Lipid Res. 2013, 54, 333–344. [DOI] [PMC free article] [PubMed] [Google Scholar]
- Ruh H.; Salonikios T.; Fuchser J.; Schwartz M.; Sticht C.; Hochheim C.; Wirnitzer B.; Gretz N.; Hopf C. J. Lipid Res. 2013, 54, 2785–2794. [DOI] [PMC free article] [PubMed] [Google Scholar]
- Angel P. M.; Spraggins J. M.; Baldwin H. S.; Caprioli R. Anal. Chem. 2012, 84, 1557–1564. [DOI] [PMC free article] [PubMed] [Google Scholar]
- Berry K. A.; Hankin J. A.; Barkley R. M.; Spraggins J. M.; Caprioli R. M.; Murphy R. C. Chem. Rev. 2011, 111, 6491–6512. [DOI] [PMC free article] [PubMed] [Google Scholar]
- Castellino S.; Groseclose M. R.; Sigafoos J.; Wagner D.; de Serres M.; Polli J. W.; Romach E.; Myer J.; Hamilton B. Chem. Res. Toxicol. 2013, 26, 241–251. [DOI] [PubMed] [Google Scholar]
- Powers T. W.; Jones E. E.; Betesh L. R.; Romano P.; Gao P.; Copland J. A.; Mehta A. S.; Drake R. R. Anal. Chem. 2013, 85, 9799–9806. [DOI] [PMC free article] [PubMed] [Google Scholar]
- Thomas A.; Patterson N. H.; Marcinkiewicz M. M.; Lazaris A.; Metrakos P.; Chaurand P. Anal. Chem. 2013, 85, 2860–2866. [DOI] [PubMed] [Google Scholar]
- Deininger S. O.; Cornett D. S.; Paape R.; Becker M.; Pineau C.; Rauser S.; Walch A.; Wolski E. Anal. Bioanal. Chem. 2011, 401, 167–181. [DOI] [PMC free article] [PubMed] [Google Scholar]
- Munoz-Olaya J. M.; Matabosch X.; Bedia C.; Egido-Gabas M.; Casas J.; Llebaria A.; Delgado A.; Fabrias G. ChemMedChem 2008, 3, 946–953. [DOI] [PubMed] [Google Scholar]
- Baykut G.; Fuchser J.; Witt M.; Weiss G.; Gosteli C. Rapid Commun. Mass Spectrom. 2002, 16, 1631–1641. [DOI] [PubMed] [Google Scholar]
- O’Connor P. B.; Costello C. E. Rapid Commun. Mass Spectrom. 2001, 15, 1862–1868. [DOI] [PubMed] [Google Scholar]
- O’Connor P. B.; Mirgorodskaya E.; Costello C. E. J. Am. Soc. Mass Spectrom. 2002, 13, 402–407. [DOI] [PubMed] [Google Scholar]
- van Lijnschoten G.; Groener J. E.; Maas S. M.; Ben-Yoseph Y.; Dingemans K. P.; Offerhaus G. J. Pediatr. Dev. Pathol. 2000, 3, 597–602. [DOI] [PubMed] [Google Scholar]
- Grosch S.; Schiffmann S.; Geisslinger G. Prog. Lipid Res. 2012, 51, 50–62. [DOI] [PubMed] [Google Scholar]
- Cheng J. C.; Bai A.; Beckham T. H.; Marrison S. T.; Yount C. L.; Young K.; Lu P.; Bartlett A. M.; Wu B. X.; Keane B. J.; Armeson K. E.; Marshall D. T.; Keane T. E.; Smith M. T.; Jones E. E.; Drake R. R. Jr.; Bielawska A.; Norris J. S.; Liu X. J. Clin. Invest. 2013, 123, 4344–4358. [DOI] [PMC free article] [PubMed] [Google Scholar]
- Mahdy A. E.; Cheng J. C.; Li J.; Elojeimy S.; Meacham W. D.; Turner L. S.; Bai A.; Gault C. R.; McPherson A. S.; Garcia N.; Beckham T. H.; Saad A.; Bielawska A.; Bielawski J.; Hannun Y. A.; Keane T. E.; Taha M. I.; Hammouda H. M.; Norris J. S.; Liu X. Mol. Ther. 2009, 17, 430–438. [DOI] [PMC free article] [PubMed] [Google Scholar]
- Kuchar L.; Asfaw B.; Poupetova H.; Honzikova J.; Turecek F.; Ledvinova J. Clin. Chim. Acta 2013, 425C, 153–159. [DOI] [PMC free article] [PubMed] [Google Scholar]
Associated Data
This section collects any data citations, data availability statements, or supplementary materials included in this article.