Abstract
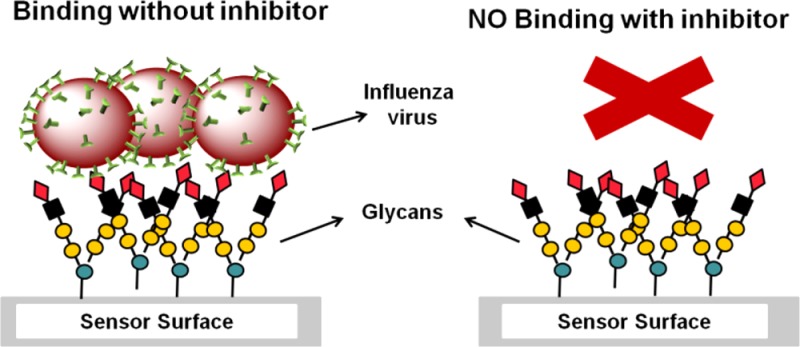
We have developed a panel of synthetic glycans as receptor mimics for the specific capture of influenza viruses. The glycans were printed onto commercial glass slides using a free amine at the end of a spacer to generate a small focused microarray. The microarray was evaluated for its ability to capture three different strains of influenza A virus, two H1N1, A/Brisbane/59/2007 and A/Solomon Islands/3/2006 and one H3N2, A/Aichi/2/1968. We observed an excellent detection ability with some compounds exhibiting clinically relevant (101 plaque forming units) limit of detection. We also tested the drug susceptibility of current antivirals, Zanamivir and Ostelamivir using this microarray and could determine antiviral resistance for these strains.
Influenza virus is a respiratory pathogen that causes over 30 000 deaths and 200 000 hospitalizations in the United States annually.1 Pandemics, like the recent 2009 H1N1 “swine flu” can cause a significant number of infections and death in addition to disruption of economic activity.2,3 Inexpensive, point of care diagnosis capable of detecting the virus rapidly would be very useful to mitigate the effects of the virus and possibly arrest its spread. Additionally, early detection is important because the antivirals lose their efficacy if administered 24–48 h after onset of infection in people with weak or compromised immune systems.4,5 Measuring drug susceptibility would provide primary care physicians with an added diagnostic tool in support of their clinical decisions. Monitoring drug susceptibility is especially important since reports of inhibitors such as M2 ion channel protein, e.g., Amantadine and Neuraminidase (NA) inhibitors, e.g., Oseltamivir, resistance has been reported, the former exhibiting widespread resistance.6−8 Antiviral resistance for the current FDA approved drugs, Zanamivir and Oseltamivir and the investigational drugs, Premavir and Laninamivir, is not easy to perform and most certainly not applicable for point of care diagnosis at this time. Traditional cell culture assays to test drug susceptibility take a long time and therefore, these assays are typically performed in a resourceful laboratory setting using molecular markers that are known to cause NA inhibitor resistance.9 Here, we report the synthesis and ability of sialic acid analogues to capture influenza virus using three different strains. We have also developed an assay to monitor NA inhibitor susceptibility of the virus toward the two major FDA approved NA inhibitors, Zanamivir and Oseltamivir.
Influenza virus has two major surface glycoproteins, Hemagglutinin (HA) and Neuraminidase (NA) that are known to bind to N-acetyl neuraminic acids (sialic acids) present on glycoproteins and glycolipids of the host cells.10 HA is involved in the initial attachment of the virus to the host cells, whereas NA is the enzyme that cleaves the residual sialic acid from the remaining cells to facilitate release of the viral progeny. These two influenza glycoproteins are excellent targets for capturing influenza virus for use in diagnosis, particularly because there are approximately 300 copies of HA and 50 copies of NA on a single viral particle, respectively.11−13 Although several studies, including our own, have focused on developing sialic acid based microarrays to capture HA to study transmissibility of the virus,14−18 we focused on developing molecules that capture NA in this report. This approach allows us to monitor drug susceptibility since Zanamivir and Oseltamivir are NA inhibitors.
Experimental section
A. Chemical Synthesis and Characterization
The synthesis and characterization of the compounds used in this article are given in the Supporting Information.
B. Biological Assays
B.1. Immobilization of Glycans
Synthetic glycans were covalently immobilized onto Nexterion NHS slides using a DIGILAB OmniGrid Micro printer in 300 mM phosphate buffer with 0.005% Tween-20 at pH 8.5. Each glycan was printed 20 times in quintuplicate at 200 μM concentration. Following printing, the glycans were allowed to react for 30 min at 60% humidity. After overnight desiccation, the slides were blocked for 60 min with 50 mM ethanolamine in 50 mM boric acid buffer (pH 9.5), washed 3 times with deionized (DI) water, dried and stored at −20 °C.
B.2. Limit of Detection Assay
To determine the limit of detection, a serial 10-fold dilution was performed for A/Brisbane/59/2007, A/Solomon Islands/3/2006 and A/Aichi/2/1968 strains. The concentration of A/Brisbane/59/2007 was tested from 2.4 × 10⁶–2.4 × 101 plaque forming units (PFU), A/Solomon Islands/3/2006 from 9.0 × 10⁶–9.0 × 101 PFU and A/Aichi/2/1968 from 1.5 × 10⁶–1.5 × 101 PFU. Each concentration of virus was applied to the microarray for 60 min in a buffer consisting of PBS, 2% BSA and 0.05% Tween-20. Postvirus incubation and wash (three times with PBS and 0.05% Tween-20 and two times with PBS), antibodies specific to each virus were diluted and added to the microarray for 60 min. For A/Brisbane/59/2007, ferret hyperimmune sera to influenza A/Brisbane/59/2007 (H1N1), NR-19260 was diluted 5000-fold, for A/Solomon Islands/3/2006 ferret hyperimmune sera to influenza A/Solomon Islands/3/2006 (H1N1), NR-19262 was diluted 1000-fold and for A/Aichi/2/1968 polyclonal anti-influenza virus A/Aichi/2/1968 (H3N2) antiserum chicken, NR-3125 was diluted 5000-fold. Slides were washed as described above and incubated for 60 min with the appropriate fluorescently tagged secondary antibodies. For A/Brisbane/59/2007, antiferret IgG, IgA, IgM (H+L) rhodamine antibody was diluted 10 000-fold, for A/Solomon Islands/3/2006 antiferret IgG, IgA, IgM (H+L), rhodamine antibody was diluted 5000-fold and for A/Aichi/2/1968, Alexa Fluor 633 goat antichicken IgG (H+L) was diluted 20 000-fold. The slides were washed as described above, followed by a DI water rinse. The slides were dried and scanned using the GenePix4000B scanner. A/Brisbane/59/2007 and A/Solomon Islands/3/2006 were scanned at 532 nm and A/Aichi/2/1968 at 635 nm. All experiments were performed in triplicate.
B.3. Drug Susceptibility Assay
To determine drug susceptibility for A/Brisbane/59/2007, A/Solomon Islands/3/2006 and A/Aichi/2/1968, each virus strain, 105 PFU, was premixed with 10 ng of antiviral Zanamivir or Oseltamivir, for 30 min at rt. The premixed sample was subsequently added to the microarray and allowed to incubate for 60 min. Fluorescence intensity was measured as previously described in the limit of detection methods. All experiments were performed in triplicate.
Results and Discussion
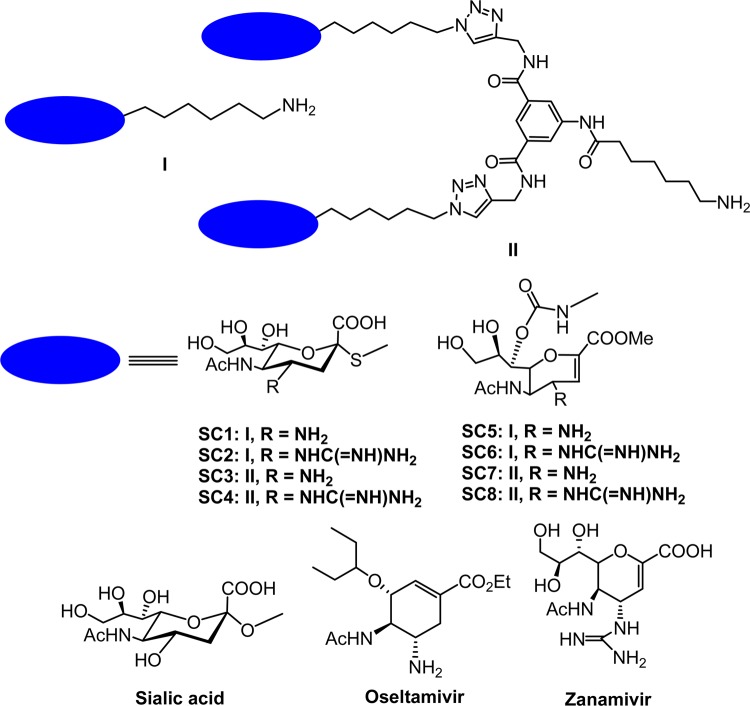
The structures of the eight molecules used to develop the focused microarray are shown in Figure 1. There are several salient features of the designer molecules. First, all eight molecules are derived from the natural receptor, namely sialic acid. Second, the molecules have a free amine at the end of a spacer, which is necessary for facile attachment to an activated carboxyl acid group on any surface. Third, the molecules also have an amine or a guanidine group at the four position; introduction of a polar group at the four position has been demonstrated to be highly specific to influenza virus as X-ray structures have shown that the polar group fits very well into a binding pocket of influenza virus NA, but does not fit well into human or bacterial NA.19 Fourth, we designed two types of molecules; SC1–4 are sialic acid analogues that have spacers attached to the 2 position via a thiol linkage, in contrast, SC5–SC8 are analogues derived from Zanamivir and attached to the spacer at the 7 position.20−22 Finally, since we recently demonstrated that molecules similar to SC1–4 and bivalent molecules thereof, inhibited two H1N1 and H3N2 strains at low nanomolar concentrations, we designed monovalent and bivalent derivatives.23 The bivalent derivatives were synthesized for two reasons. First, the bivalent scaffold provides additional distance from the microarray surface for the NAs of the virus to bind. Second, NA exists as a tetramer with four binding sites, the distances between the two glycan headgroups are spaced such that a single molecule could fit into to two binding sites from a single NA tetramer or alternatively, fit into the pockets of two adjacent NA tetramers on a single virion.23 When these mono and bivalent molecules are tethered to a surface, the overall binding affinity of multiple glycans with influenza viruses is expected to increase exponentially, leading to a higher capturing efficiency.
Figure 1.
Structures of the tailored glycans. The blue ellipse represents the two glycan headgroups, and I and II represent mono and bivalent derivatives. The natural receptor, N-acetyl neuraminic acid (sialic acid), and the FDA approved antivirals, Zanamivir and Oseltamivir, are also depicted.
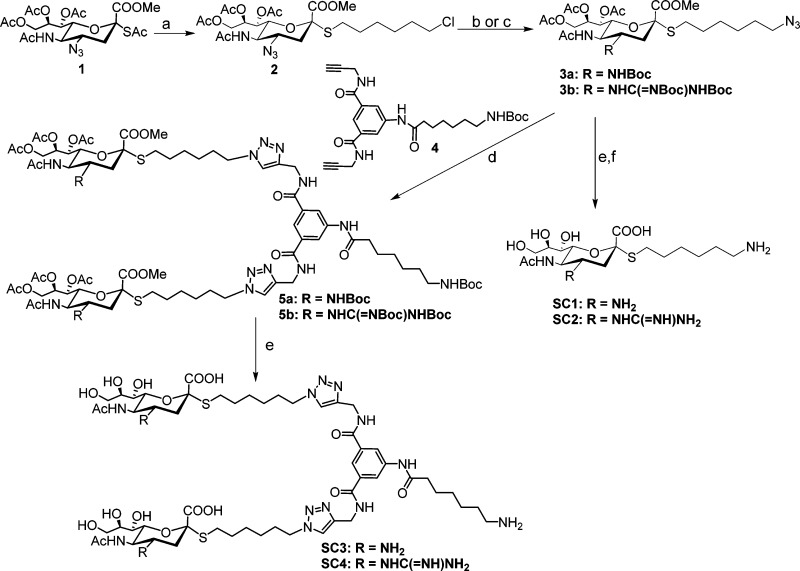
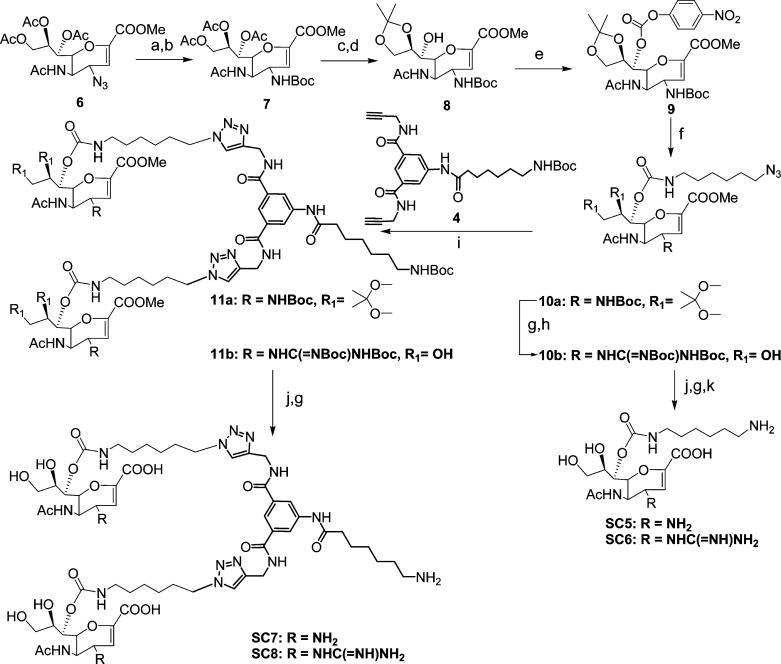
The syntheses of the molecules are shown in Schemes 1 and 2. For SC1–4, the thioacetate group of the known azido compound 1(24) was reacted with a suitable six carbon spacer, which had a chloride at the terminus to yield 2 in appreciable amounts. The azide was reduced under mild conditions using triphenylphosphine and the amine group was either protected by a tert-butoxy group or a suitably protected guanidine group followed by replacement of the chloride by an azide using sodium azide to yield 3a and 3b in decent yields. Zemplén deprotection to remove the acetates and methyl ester was followed by acidic removal of the tert-butoxy groups and subsequent reduction of the azide using standard hydrogenation conditions yielded the monovalent compounds SC1 and SC2, which had an amine and a guanidine group at the four position of the sialic acid, respectively. Copper(I) catalyzed 1,3 dipolar addition of 3a,b with a dimeric scaffold, 4, bearing two alkyne groups resulted in the fully protected bivalent compounds, 5a,b, in good yields. The protecting groups were removed using the same conditions as described for the monovalent derivatives to yield the bivalent compounds, SC3–4. For the Zanamivir analogues, SC5–8, we attached the spacer to the seven hydroxyl group as modifications at this position are well tolerated by NA; indeed, this approach has been used to attach a biotin to Zanamivir.20 To this end, we elaborated the known azido compound 6(20−22) by reducing the azide and protecting the free amine group using a tert-butoxy group to yield 7 in high yields. This was followed by base induced deprotection of the acetate groups and acetonide protection of the 8,9 hydroxyl groups, leaving the hydroxyl group at the seven position open for conjugation to the spacer. The terminal amine of a six carbon spacer bearing an azide group at the opposite end was conjugated to 8 in a two-step procedure using p-nitrochloroformate as the coupler to yield the carbamate 9. The acetonide group was removed under mild acidic conditions to produce 10a. The guanidine derivative, 10b, was synthesized from 10a, the tert butoxy group was removed and a suitably protected guanidine group was attached to the free amine to yield 10b in significant amounts. This strategy of installing the guanidine group at this later stage was more successful in our hands as opposed to introducing the guanidine group early in the synthesis, the latter strategy gave us undesirable products and variable results. Global deprotection of 10a,b was performed as described for SC1,2 to yield SC5,6 in good yields. The bivalent derivatives SC7,8 were synthesized from 10a,b in a manner similar to the synthesis of SC3,4 by coupling to the scaffold 4, followed by global deprotection. The final compounds were purified using size exclusion chromatography using Biogel P2 and the appropriate fractions containing the compounds were freeze-dried to produce colorless foamy solid material.
Scheme 1. Reagents and Conditions.
(a) 6-Chlorohexyl 4-methylbenzenesulfonate, DEA, DMF, rt, 4 h. 80% (b) i. PPh3, THF/H2O (1:1), 40 °C, 12 h. ii. (t-Boc)2O, TEA, THF, 60%. iii. NaN3, DMF, 60 °C. 90%. (c) i. PPh3, THF/H2O (1:1), 40 °C, 12 h. ii. 1,3-Bis(tert-butoxycarbonyl)-2-methyl-2-thiopseudourea, TEA, HgCl2, 85%. iii. NaN3, DMF, 60 °C. 93%. (d) Na-L-ascorbate, CuSO4, THF/H2O. 12 h, 60% for 5a; 65 for 5b. (e) i. NaOMe, MeOH. ii. DCM/TFA. iii. NaOH, MeOH, 80% yield for SC3, 70% yield for SC4. (f) H2, Lindlar catalyst, EtOH/H2O, 4 h, 75% yield for SC1, 70% yield for SC2.
Scheme 2. Reagents and Conditions.
(a) H2, Lindlar catalyst, EtOH, 4 h, quant. (b) Boc2O, TEA, THF, 12 h, 86%. (c) NaOMe, MeOH, 1 h, quant. (d) H+ resin, acetone, 12 h, 88%. (e) DMAP, pyridine, p-NO2C6H4OCOCl, 12 h, 80%. (f) 6-Azido-hex-1-amine, CH3CN, TEA, 3 h, 89%. (g) TFA, DCM. (h) 1,3-Bis(tert-butoxycarbonyl)-2-methyl-2-thiopseudourea. HgCl2, TEA, DCM, 12 h, 84%. (i) Na-L-ascorbate, CuSO4, THF/H2O, 12 h. 78% for 11a; 80% for 11b. (j) NaOH, MeOH. 1 h. 70% for SC7; 79% for SC8. (k) H2, Lindlar catalyst, EtOH, 4 h. 76% for SC5; 72% for SC6.
The synthetic glycans were printed onto commercial glass slides bearing activated carboxyl groups for conjugation to the free amines of SC1–8 to produce a focused microarray. Printing was performed at various concentrations; we used a concentration of 200 μM for all assays in this report as it gave us excellent signal-to-noise ratio. Amine terminated PEG was printed as a negative control. Amine terminated biotin was included as a positive control. The microarray was exposed to three different strains of influenza virus, two H1N1, A/Brisbane/59/2007 and A/Solomon Islands/3/2006 and a H3N2, A/Aichi/2/1968. The strains were incubated at rt for 60 min, followed by incubation of the appropriate primary and fluorescently labeled secondary antibody. The slides were washed at every stage extensively, and the slides were scanned using a Genepix scanner at 532 or 635 nm. Reproduced in Figure 2A is the fluorescence image where the microarray was exposed to 105 PFU of H1N1 Influenza virus A/Brisbane/59/2007. The image clearly shows that the bivalent compounds, SC3,4,7,8, captured the virus very well; however, most of the monovalent compounds, SC1,2,5,6, bind weakly to this strain, suggesting that the bivalent derivatives provide the required distance from the surface for the virus to bind. We and others have observed this phenomenon before, binding of glycans to their respective analytes are highly dependent on glycan density and presentation.14,25 Exposure to H3N2 strain A/Aichi/2/1968 resulted in similar results (Figure 3C); however, all compounds bound to H1N1 A/Solomon Islands/3/2006, indicating that this virus strain is more accommodating in its binding preferences. (Figure 3B). Nonspecific binding to the control ligand, PEG, was negligible, which is a very important aspect of biosensor development as viruses are notorious in terms of nonspecific binding. Several other controls (with buffer only, using other synthetic glycans) were performed and all of these control experiments resulted in no binding. We observed a differential response to the ligands for each viral strain, for example, the A/Aichi/2/1968 strain exhibits similar binding to all four bivalent compounds, the A/Brisbane/59/2007 strain binds better to the bivalent compounds, SC4 and SC8, with the guanidine group at the four position. With more ligands and slight differences in the binding affinities, this differential pattern could potentially be used to develop a “fingerprint” pattern of recognition for each strain, including emerging strains.26
Figure 2.
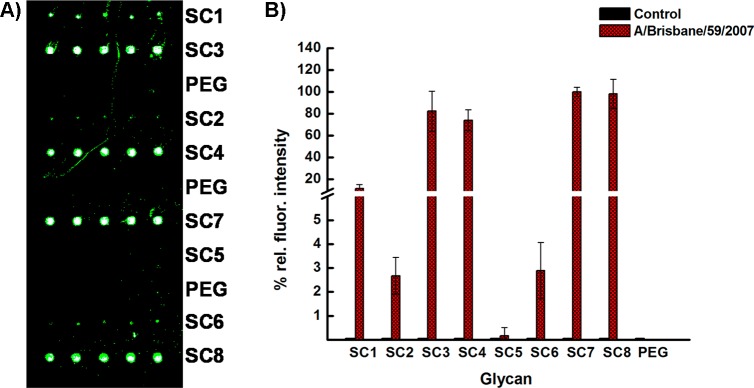
Influenza virus binding studies. (A) Fluorescence image of microarray containing eight glycans (SC1–SC8) after exposure to 105 PFU of H1N1 Influenza A/Brisbane/59/2007, followed by ferret hyperimmune sera and antiferret rhodamine labeled secondary antibody for A/Brisbane/59/2007 and scanned by Genepix scanner at 532 nm. (B) Fluorescence detection of H1N1 (A/Brisbane/59/2007) influenza A virus using synthetic glycans. Glycans, PEG (negative control) and biotin (positive control) were printed at 200 μM. Virus concentration was 105 PFU. Fluorescence intensity was measured by the Genepix scanner using ferret hyperimmune sera to influenza A/Brisbane/59/2007 (H1N1) and antiferret rhodamine labeled antibody. A/Brisbane/59/2007 was scanned at 532 nm. The experiment was performed in triplicate.
Figure 3.
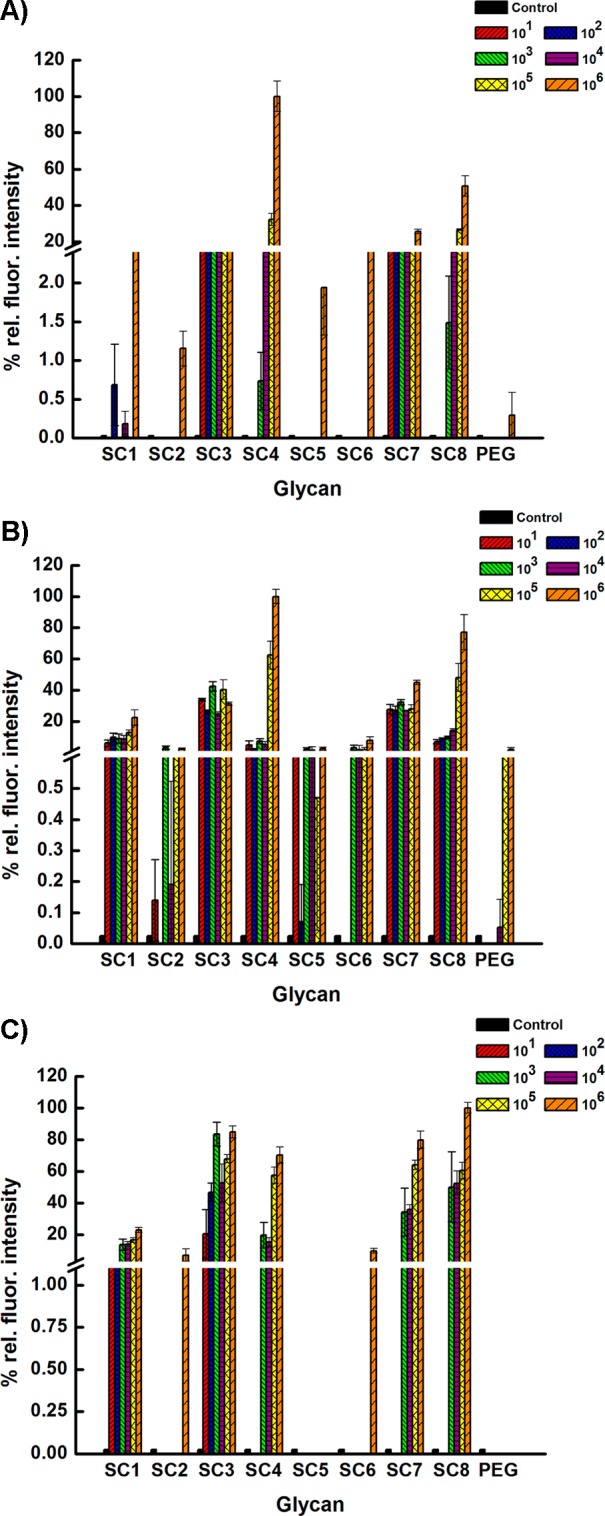
Analytical sensitivity studies. Limit of detection for (A) H1N1 Influenza A/Brisbane/59/2007, (B) H1N1 Influenza A/Solomon Islands/3/2006 (C) H3N2 Influenza A/Aichi/2/1968. Fluorescence intensity for A/Brisbane/59/2007 was measured as previously described for Figure 2. Fluorescence intensity was measured by the Genepix scanner using ferret hyperimmune sera to influenza A/Solomon Islands/3/2006 (H1N1) and antiferret rhodamine labeled antibody; polyclonal antiserum chicken to A/Aichi/2/1968 (H3N2) and Alexa Fluor 633 labeled antichicken. A/Solomon Islands/3/2006 was scanned at 532 nm and A/Aichi/2/1968 at 635 nm. All experiments were performed in triplicate.
Next, we determined the analytical limit of detection using different concentrations of the different strains from 106 to 101 PFU. As shown in Figure 3A–C, the bivalent compounds bind to the three different strains at higher concentrations very well with high relative fluorescence intensities. At the lowest tested concentration of 101 PFU, the bivalent compounds SC3 and SC7 bind well to the H1N1 A/Brisbane/59/2007 and the A/Solomon Islands/3/2006 strains; however, SC3 and SC1 bind to the H3N2 A/Aichi/2/1968 strain. Known differences in the binding pockets of N1 and N2 could be a possible reason for this difference in binding at lower concentrations in addition to the number of NAs present on the surface of each strain.27 We note that these first generation ligands can capture extremely low clinically relevant concentrations of viruses and further optimization could lead to lower limits of detection. Finally, we tested the microarray for susceptibility to FDA approved antivirals, Zanamivir and Oseltamivir (Figure 4). Briefly, known concentrations of the three strains were premixed with either one of the antivirals and exposed to the microarray. Washing to remove unbound virus was followed by detection using the appropriate primary and labeled secondary antibody. It was gratifying to observe no binding to any of the compounds for all three strains, which indicates that the antiviral blocks the NA leading to loss of signal. There are two outliers, SC3 and SC7. In the presence of antivirals, SC3 binds H3N2 A/Aichi/2/1968 strain and SC7 binds both H1N1 strains. A possible explanation for these observations could be that the binding pocket of HA for each particular strain could accommodate sialic acid with an amine at the 4 position, which is similar to the structure of the glycan head groups in SC3 and SC7.
Figure 4.
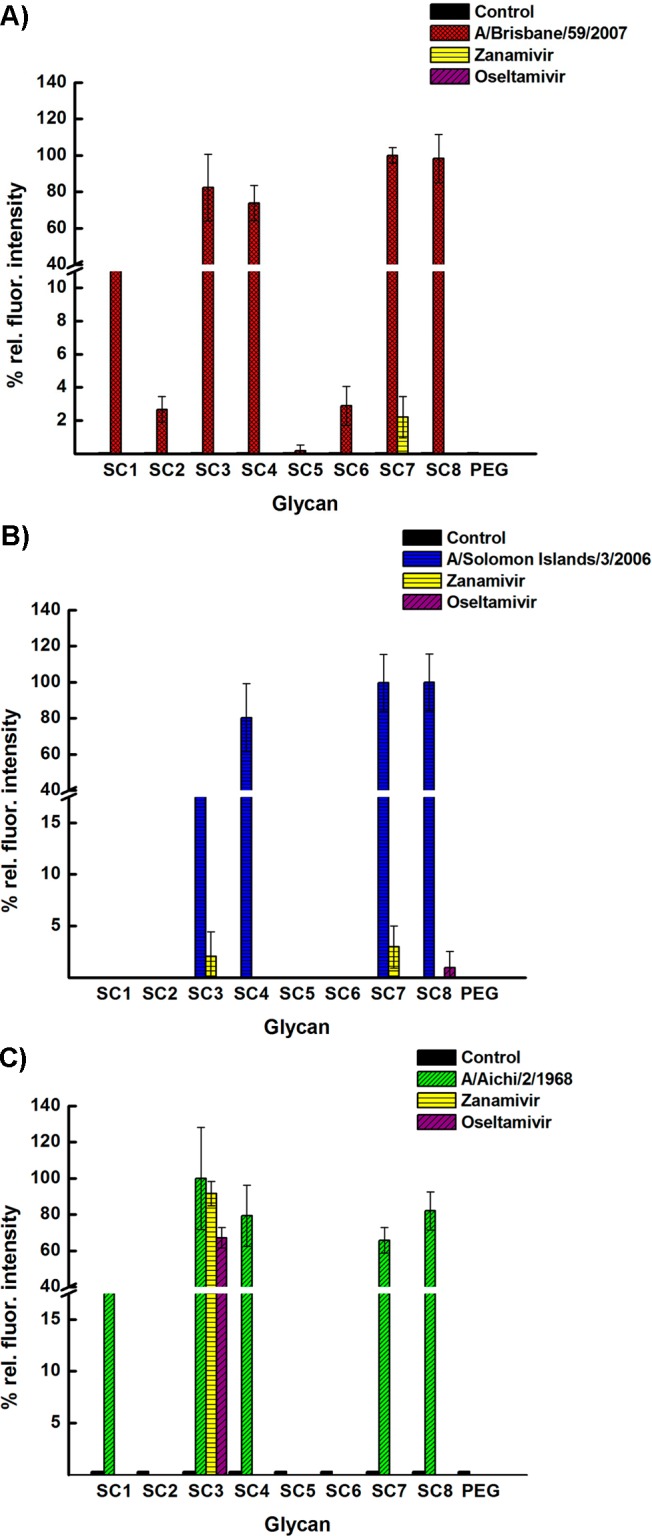
Drug susceptibility studies. (A) H1N1 Influenza A/Brisbane/59/2007. (B) H1N1 Influenza A/Solomon Islands/3/2006. (C) H3N2 Influenza A/Aichi/2/1968. Ten nanograms of antivirals Zanamivir or Oseltamivir were premixed with the strains at 105 PFU for 30 min at rt and subsequently added to the microarray. Fluorescence intensity was measured as previously described in Figures 2 and 3. All experiments were performed in triplicate.
Conclusions
We have synthesized tailored glycans, printed them onto glass slides and demonstrated the ability of a focused microarray to capture three influenza strains at different concentrations. We determined the limit of detection to be 101 PFU, which indicates that the assay is clinically relevant. We also demonstrated that the assay can be used to test drug susceptibility of current FDA approved antivirals, Zanamivir and Oseltamivir, by premixing the antivirals with the strains and performing the assay. Thus, the assay reported in this article can be performed rapidly within hours using minimal tools. In contrast, current genotyping methods to determine antiviral resistance is typically performed in a clinical laboratory using molecular markers by trained personnel, specialized equipment and days to accomplish. We are currently expanding our efforts to develop second generation ligands and include more strains to demonstrate broad applicability. By further optimization of ligand structure, testing different conditions and biosensor platforms, this assay has the potential to be translated to rapid diagnostic tests.
Acknowledgments
We are grateful for NIH-NIAID (R01-AI089450) for funding. We also thank BEI Resources, NIAID, NIH for the viral strains and the antibodies. We also thank Dr. Binghe Wang, GSU for use of the microarray printing facilities.
Supporting Information Available
Chemical structures and synthesis information for compounds 2, 3a, 3b, 4, 5a, 5b, SC1, SC2, SC3, SC4, 7, 8, 9, 10a, 10b, 11a, 11b, SC5, SC6, SC7 and SC8. This material is available free of charge via the Internet at http://pubs.acs.org.
Author Contributions
‡ H.D. and X.Z. contributed equally to the paper.
The authors declare no competing financial interest.
Funding Statement
National Institutes of Health, United States
Supplementary Material
References
- Fiore A. E.; Shay D. K.; Broder K.; Iskander J. K.; Uyeki T. M.; Mootrey G.; Bresee J. S.; Cox N. S. MMWR Recomm. Rep. 2008, 57, 1. [PubMed] [Google Scholar]
- Zarocostas J. British Med. J. 2009, 338, b2425. [DOI] [PubMed] [Google Scholar]
- Butler D. Nature 2009, 458, 1082. [DOI] [PubMed] [Google Scholar]
- Hsu J.; Santesso N.; Mustafa R.; Brozek J.; Chen Y. L.; Hopkins J. P.; Cheung A.; Hovhannisyan G.; Ivanova L.; Flottorp S. A.; Saeterdal I.; Wong A. D.; Tian J.; Uyeki T. M.; Akl E. A.; Alonso-Coello P.; Smaill F.; Schunemann H. J. Ann. Int. Med. 2012, 156, 512. [DOI] [PMC free article] [PubMed] [Google Scholar]
- Fiore A. E.; Fry A.; Shay D.; Gubareva L.; Bresee J. S.; Uyeki T. M. MMWR Recomm. Rep. 2011, 60, 1. [PubMed] [Google Scholar]
- Hurt A. C.; Holien J. K.; Parker M. W.; Barr I. G. Drugs 2009, 69, 2523. [DOI] [PubMed] [Google Scholar]
- Mai-Phuong H. V.; Hang N. L. K.; Phuong N. T. K.; Mai L. Q. West. Pac. Surveill. Response J. 2013, 4, 25. [Google Scholar]
- Cai J.; Wang X.; Zhao B.; Yao W.; Zhu Q.; Zeng M. J. Med. Virol. 2014, 86, 1026. [DOI] [PubMed] [Google Scholar]
- Okomo-Adhiambo M.; Sheu T. G.; Gubareva L. V. Influenza Other Respir. Viruses 2013, 7Suppl 144. [DOI] [PMC free article] [PubMed] [Google Scholar]
- von Itzstein M. Nat. Rev. Drug Discovery 2007, 6, 967. [DOI] [PubMed] [Google Scholar]
- Murti K. G.; Webster R. G. Virology 1986, 149, 36. [DOI] [PubMed] [Google Scholar]
- Wasilewski S.; Calder L. J.; Grant T.; Rosenthal P. B. Vaccine 2012, 30, 7368. [DOI] [PMC free article] [PubMed] [Google Scholar]
- Harris A.; Cardone G.; Winkler D. C.; Heymann J. B.; Brecher M.; White J. M.; Steven A. C. Proc. Natl. Acad. Sci. U. S. A. 2006, 103, 19123. [DOI] [PMC free article] [PubMed] [Google Scholar]
- Lewallen D. M.; Siler D.; Iyer S. S. ChemBioChem 2009, 10, 1486. [DOI] [PubMed] [Google Scholar]
- Kale R. R.; Mukundan H.; Price D. N.; Harris J. F.; Lewallen D. M.; Swanson B. I.; Schmidt J. G.; Iyer S. S. J. Am. Chem. Soc. 2008, 130, 8169. [DOI] [PubMed] [Google Scholar]
- Stevens J.; Blixt O.; Paulson J. C.; Wilson I. A. Nat. Rev. Microbiol. 2006, 4, 857. [DOI] [PMC free article] [PubMed] [Google Scholar]
- Stevens J.; Blixt O.; Glaser L.; Taubenberger J. K.; Palese P.; Paulson J. C.; Wilson I. A. J. Mol. Biol. 2006, 355, 1143. [DOI] [PubMed] [Google Scholar]
- Gulati S.; Lasanajak Y.; Smith D. F.; Cummings R. D.; Air G. M. Cancer Biomarkers 2014, 14, 43. [DOI] [PMC free article] [PubMed] [Google Scholar]
- von Itzstein M.; Wu W.-Y.; Kok G. B.; Pegg M. S.; Dyason J. C.; Jin B.; Phan T. V.; Smythe M. L.; White H. F.; Oliver S. W.; Colman P. M.; Varghese J. N.; Ryan D. M.; Woods J. M.; Bethell R. C.; Hotham V. J.; Cameron J. M.; Penn C. R. Nature 1993, 363, 418. [DOI] [PubMed] [Google Scholar]
- McKimm-Breschkin J. L.; Colman P. M.; Jin B.; Krippner G. Y.; McDonald M.; Reece P. A.; Tucker S. P.; Waddington L.; Watson K. G.; Wu W. Y. Angew. Chem., Int. Ed. 2003, 42, 3118. [DOI] [PubMed] [Google Scholar]
- Ying L.; Gervay-Hague J. ChemBioChem 2005, 6, 1857. [DOI] [PubMed] [Google Scholar]
- Lu Y.; Gervay-Hague J. Carbohydr. Res. 2007, 342, 1636. [DOI] [PMC free article] [PubMed] [Google Scholar]
- Yang Y.; He Y.; Li X.; Dinh H.; Iyer S. S. Bioorg. Med. Chem. Lett. 2014, 24, 636. [DOI] [PMC free article] [PubMed] [Google Scholar]
- Chandler M.; Bamford M. J.; Conroy R.; Lamont B.; Patel B.; Patel V. K.; Steeples I. P.; Storer R.; Weir N. G.; Wright M.; Williamson C. J. Chem. Soc., Perkin Trans. 1 1995, 1173. [Google Scholar]
- Flagler M. J.; Mahajan S. S.; Kulkarni A. A.; Iyer S. S.; Weiss A. A. Biochemistry 2010, 49, 1649. [DOI] [PMC free article] [PubMed] [Google Scholar]
- Disney M. D.; Zheng J.; Swager T. M.; Seeberger P. H. J. Am. Chem. Soc. 2004, 126, 13343. [DOI] [PubMed] [Google Scholar]
- Russell R. J.; Haire L. F.; Stevens D. J.; Collins P. J.; Lin Y. P.; Blackburn G. M.; Hay A. J.; Gamblin S. J.; Skehel J. J. Nature 2006, 443, 45. [DOI] [PubMed] [Google Scholar]
Associated Data
This section collects any data citations, data availability statements, or supplementary materials included in this article.


