Abstract
Two immuno-loop-mediated isothermal amplification assays (iLAMP) were developed by using a phage-borne peptide that was isolated from a cyclic eight-peptide phage library. One assay was used to screen eight organophosphorus (OP) pesticides with limits of detection (LOD) between 2 and 128 ng mL–1. The iLAMP consisted of the competitive immuno-reaction coupled to the LAMP reaction for detection. This method provides positive results in the visual color of violet, while a negative response results in a sky blue color; therefore, the iLAMP allows one to rapidly detect analytes in yes or no fashion. We validated the iLAMP by detecting parathion-methyl, parathion, and fenitrothion in Chinese cabbage, apple, and greengrocery, and the detection results were consistent with the enzyme-linked immunosorbent assay (ELISA). In conclusion, the iLAMP is a simple, rapid, sensitive, and economical method for detecting OP pesticide residues in agro-products with no instrumental requirement.
Introduction
Organophosphorus (OP) pesticides are widely used in agriculture for the control of sucking and biting insects, including fruit flies, stem borers, mosquitoes, and cereal bugs. However, OP pesticides are considered hazardous substances because of their toxicity to nontarget species and periodic persistence problems in the environment.1 Therefore, it is important to develop a rapid, sensitive, and economical method for detecting OP pesticides and their residues in food and the environment.
Loop-mediated isothermal amplification (LAMP) is a novel nucleic acid amplification method that amplifies DNA with high specificity, sensitivity, and rapidity under isothermal conditions using a set of four specially designed primers and a DNA polymerase with strand displacement activity.2 The LAMP method has three main advantages. First, all reactions can be specifically carried out under isothermal conditions, and do not require a denatured DNA template. Compared to conventional PCR and real-time PCR assays, specialized and/or expensive equipment is not necessary, and there are fewer preparation steps.3,4 Second, the amplification efficiency is extremely high so that high amounts of amplification products can be obtained.5 Third, LAMP results can be read by the naked eye, on the basis of the change of turbidity.6 Alternatively, the LAMP products can be visualized by small molecules such as fluorescein isothiocyanate (FITC), hydroxynaphthol blue (HNB), and digoxigenin (DIG).7,8 Since the first description of the LAMP method in 2000,9 many LAMP assays have been developed for detection of pathogenic microorganisms,10,11 genetically modified ingredients,12,13 tumor detection,14,15 and embryo sex identification.16,17 However, no investigator has reported a LAMP assay for the detection of pesticides since most pesticides are low-molecular weight chemical compounds and do not contain nucleic acids. That LAMP technology likely was overlooked in the environmental field should be quite a concern.
Since phage peptide display was first reported,18 it has been a powerful tool for a variety of applications, including the isolation of peptide ligands for antibodies and enzymes,19−21 antibody engineering,22,23 and the isolation of receptor peptides for small molecules.24,25 A phage display random peptide library, which displays extensive random peptides on the N terminus of the minor coat protein g3p of the filamentous phage M13, can be used for this purpose. Peptides with specific affinities or activities toward targets can be screened from the peptide library.26−28 Phage g3p-displayed short peptide libraries have been approved to be efficient tools for selecting mimotope peptides of an array of compounds, including metabolites of pyrethroid insecticides,29 deoxynivalenol,30 zearalenone,31 ochratoxin A (OTA),32 and aflatoxin.33,34 The unique characteristics of a phage-borne peptide that connects the peptide with affinity to a target on the phage particles containing nucleic acids (single-stranded DNA) encoding the peptide make them excellent reagents to develop LAMP assays for small molecules.
To test this feasibility, we isolated four phage-borne peptides with specific affinities to a monoclonal antibody (mAb) against OP pesticides. This study describes our systemic approach to the development of the iLAMP using one phage-borne peptide with the highest sensitivity and validating the assay with application to several agricultural samples.
Materials and Methods
Reagents
All reagents were of analytical grade unless specified otherwise. Parathion-methyl, chlorpyrifos-methyl, azinphos-methyl, dimethoate, fenitrooxon, EPN, paraoxon-ethyl, paraoxon-methyl, dicapthon, cyanophos, and famphur were all purchased from Dr. Ehrenstorfer (Germany). Other pesticide standards were provided by the Jiangsu Pesticide Research Institute (China). Anti-OP pesticide mAb C8/D3 was produced in our laboratory.35 Mouse anti-M13 monoclonal antibody–horse radish peroxidase (HRP) conjugate was purchased from GE Health Care (Piscataway, NJ, U.S.A.). Bst DNA polymerase and Escherichia coli ER2738 were purchased from New England Biolabs (Ipswich, MA, U.S.A.). The cyclic 8-amino-acid random peptide library was developed in the laboratory (UC Davis, CA, U.S.A.) previously.34 Isopropyl-β-d-thiogalactoside (IPTG), 5-bromo-4-chloro-3-indolyl-β-d-galactoside (Xgal), betaine, and hydroxynaphthol blue (HNB) were purchased from Sigma (U.S.A.). MgCl2 and dNTPs were purchased from Takara (Japan). Double-distilled water was used in all experiments.
Phage Selection by Biopanning
Three wells of one microtiter plate were coated with purified C8/D3 mAb (10 μg mL–1) in 100 μL of phosphate-buffered saline (PBS) by overnight incubation 4 °C. Nonspecific binding was blocked by incubation with 300 μL of PBS containing 3% bovine serum albumin (BSA) for 1.5 h at 37 °C. To eliminate nonspecific binding of the phage to BSA, another plate coated with 100 μL of 3% BSA in PBS was used for preabsorption. For the panning–elution procedure, the phage library (1 × 10¹⁰ pfu mL–1) diluted with PBS was first added to the preabsorption plate and incubated at 37 °C for 1 h. Then, the supernatant was transferred to the plate coated with C8/D3 and incubated with shaking at room temperature for 1 h. The wells were washed 10 times with PBS containing 0.1% (v/v) Tween 20 (PBST). To elute the bound phage using competitive elution, 100 μL of parathion-methyl (100 ng mL–1 in PBS) was added to each well with shaking for 1 h to compete with the binding phage from the coating antibody. Alternatively, 100 μL of 0.2 M glycine-HCl (pH 2.2, acidic elution) and 1 mg mL–1 BSA was added with gentle rocking for no more than 20 min and then neutralized with 15 μL of 1 M Tris-HCl (pH 9.1). The elution solution was then collected and used to infect Escherichia coli ER2738 for amplification and titration. The amplified phage was used for a subsequent round of panning. In the second and third rounds of panning, the concentration of coating antibody was reduced to 5 and 1 μg mL–1, while the elution buffer was 10 and 1 ng mL–1 parathion-methyl, respectively. After three rounds of panning–elution selection, individual plaques were picked up from LB/IPTG/Xgal plates and tested for their ability to bind to the mAb by phage ELISA. Positive clones were further selected by titration and submitted for DNA sequencing using the primer 96gIII (CCCTCATAGTTAGCGTAACG) (Division of Biological Sciences, Automated DNA Sequencing Facility, University of California, Davis).
Screening of Phage Eluate by Phage ELISA
After three rounds of panning, 180 μL of ER2738 cell culture (mid log phase, OD600 = 0.5 AU) was resuspended with 10 μL of diluted phage eluates. Then, the infected cells were transferred to culture tubes containing 45 °C top agar and poured on a LB/IPTG/Xgal plate. The plates were incubated overnight at 37 °C. A total of 20 clones were picked, transferred to diluted ER2738 culture and grown at 37 °C with shaking for 4.5 h. Cells were pelleted by centrifugation at 10,000 rpm for 10 min, and the supernatants were collected for phage ELISA. To select the positive clones, a microtiter plate was coated with C8/D3 mAb and blocked as described above for panning–elution selection. Fifty microliters of phage supernatant of each clone was mixed with 50 μL of 100 ng mL–1 parathion-methyl in 10% methanol–PBS or pure dilution buffer. The mixtures were added to the wells, and the preparations were incubated at room temperature for 1 h with shaking. After the wells were washed six times with 0.1% PBST, 100 μL of anti-M13 phage antibody conjugated with HRP (1:5000 dilution in PBS) was added. After 1 h incubation and washing six times, the amount of bound enzyme was determined by adding 100 μL of peroxidase substrate (25 mL of 0.1 M citrate acetate buffer (pH 5.5), 0.4 mL of 6 mgmL–1 TMB in dimethyl sulfoxide (DMSO), and 0.1 mL of 1% H2O2). The absorbance at 450 nm was determined after the reaction was stopped by adding 50 μL of 2 M H2SO4 per well.
Primer Design
The specific LAMP primers based on the nucleotide sequence of phage were designed for detection of the phage-borne peptide by using Primer Explorer V4 (http://primerexplorer.jp/elamp4.0.0/index.html), an online primer-designing tool developed by Eiken Chemical Co. LTD, Japan.
LAMP Reaction
The LAMP reacted in a 25 μL volume containing 1.2 μM each of FIP and BIP, 0.2 μM of F3 and B3, 0.64 M betaine, 1 mM dNTPs, 3 mM MgCl2, 20 mM Tris–HCl (pH 8.8), 10 mM KCl, 10 mM (NH4)2SO4, 2 mM MgSO4, 0.1% Triton X-100, 8 U of Bst DNA polymerase, 150 μM HNB, and 1 μL of target DNA. The reaction was performed in 0.2 mL microcentrifuge tubes that were placed in a water bath or turbidimeter (LA-320C, Japanese Eiken Chemical Co. Ltd.) for 1 h at 63 °C, and the reaction was terminated by treatment at 80 °C for 10 min. A positive control (a sample known to contain the phage) and a negative control (a sample to which no template was added) were included in each run. The visualization indicator HNB was added to the reaction mixture before amplification. HNB produced a distinctive color if the reaction was positive; as a consequence, the iLAMP result could be observed by the naked eye without gel electrophoresis. When the LAMP reaction was completed, the color of the mixture in the tubes containing detectable amounts of phage changed from violet to sky blue, and the turbidity of the mixture increased. For confirmation of the LAMP assessment based on HNB-visualized color and turbidity change, 3 μL of each LAMP mixture was then subjected to 2.0% agarose gel electrophoresis, and the gels were stained with ethidium bromide.
Sensitivity and Specificity of the LAMP Reaction
The phage C11-2 (1.7 × 10¹¹ pfu mL–1) was serially diluted (from 2 × 10⁶ to 109 times) and analyzed by the LAMP to evaluate the sensitivity of the LAMP. Specificity of the LAMP was determined by performing the assay with helper phage M13K07 (2 × 10⁶ pfu mL–1, New England Biolabs) and M13KE vector (1 mg μL–1, New England Biolabs). When the reactions were complete, the LAMP products were observed by naked eye and gel electrophoresis. There were three replications for each sample, and the experiment was performed three times.
iLAMP Method
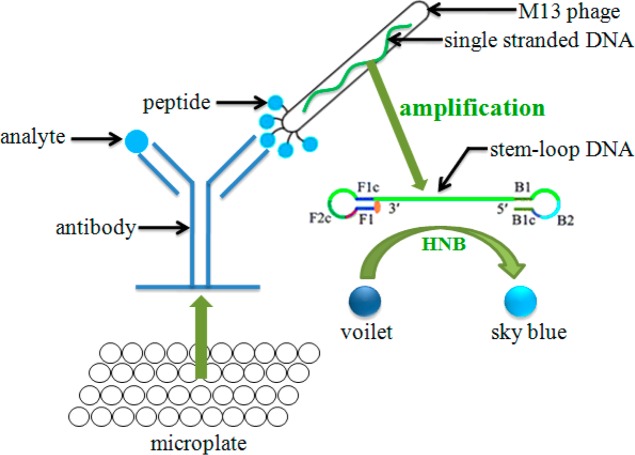
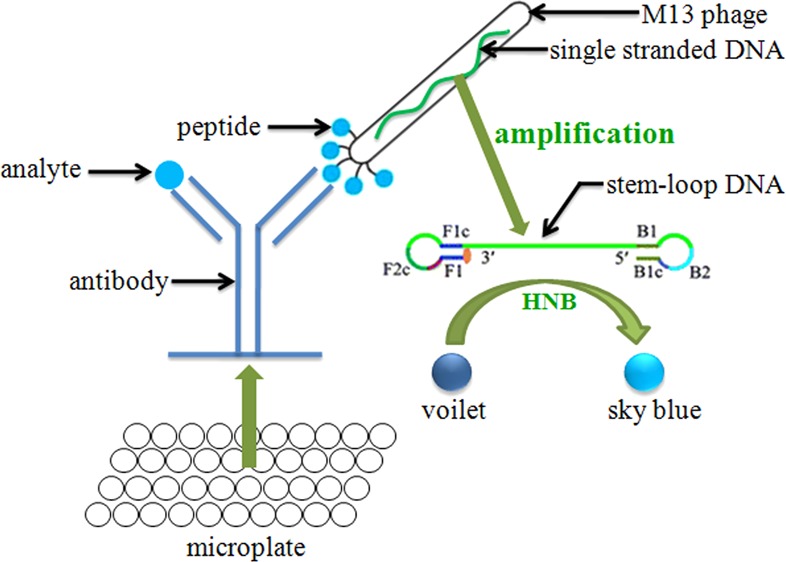
Two iLAMP methods consisting of the competitive immunoreaction and the LAMP reaction were carried out in this study (Figure 1). In the first method, a microtiter plate was coated with C8/D3 mAb (10 μg mL–1) in 100 μL of PBS by incubating for 2 h at 37 °C. Nonspecific binding was blocked by incubation with 300 μL of PBS containing 3% BSA for 1.5 h at 37 °C. The phage (8.5 × 10⁷ pfu mL–1) in 100 μL of PBS was added into the plate and incubated 37 °C for 1 h. The plate was washed six times with PBST, and 300 μL of PBS was added for 1 h at 37 °C. Then, the plate was washed eight times with PBST, and 100 μL of analyte was added for 1 h at 37 °C to compete with the binding phage from the coating antibody. After incubating, the supernatant was diluted 20-fold by double-distilled water, and 2 μL of the diluted supernatant was detected by LAMP. In this method, the sky blue color development (the color of the mixture in the tubes changed from violet to sky blue) represented the positive results.
Figure 1.
Schematic diagram of phage iLAMP.
In the second method, the plate was coated and blocked as the first method. Aliquots of 50 μL per well of analyte and 50 μL per well of the phage (1.7 × 10⁸ pfu mL–1) dissolved in PBS were added to the blocked plate. After incubating for 1 h at 37 °C, the plate was washed eight times with PBST and 100 μL of parathion-methyl (100 ng mL–1 in PBS) was added for 1 h at 37 °C to compete with the binding phage from the coating antibody. Then, the supernatant was diluted 5-fold by double-distilled water, and 2 μL of the diluted supernatant was detected by LAMP. In contrast to the first method, the color remaining violet represented the positive results in this method.
Sensitivity and Selectivity of the ILAMP
A series of concentrations (0.05–10,000 ng mL–1) of 23 analyte standards were prepared in 10% methanol–PBS and tested using the iLAMP; after 60 min the results were judged by the naked eye and turbidimeter. To evaluate the selectivity of the iLAMP, cross-reactivity (CR) was calculated on the basis of the limit of detection (LOD), the formula being as follows: CR = [LOD (parathion-methyl)/LOD (compound)] × 100%. Here, the CR of parathion-methyl was defined as 100%.
Accuracy (Analysis of Spiked Agricultural Samples)
Three different agricultural samples (Chinese cabbage, apple, and greengrocery) were chosen to evaluate the performance of the iLAMP. Chinese cabbage, apple, and greengrocery (organic) were purchased from local markets. Before the spiking and recovery study, each test sample was verified for no parathion-methyl, parathion, and fenitrothion in the tested samples by gas chromatography (limit of quantification was 40 ng g–1). All of the samples were spiked with known concentrations of parathion-methyl, parathion, and fenitrothion in methanol (the final concentrations were 0 LOD × dilution times, and 2-fold of LOD × dilution times). Each test was done in triplicate.
All samples were cut into pieces and homogenized. The spiked samples were thoroughly mixed and allowed to stand at room temperature for 1 h. The sample pretreatment procedure was as follows. All samples (5 g) were extracted twice by a vortex mixer in 10 mL of methanol for 1 min and centrifuged for 5 min at 4000 rpm. After centrifugation, the supernatant was transferred into a 25 mL volumetric flask, and adjusted to 25 mL with PBS. After dilution at an appropriate multiple, the solutions were analyzed via the iLAMP.
Results and Discussion
Panning–Elution Selection of Specific Phages
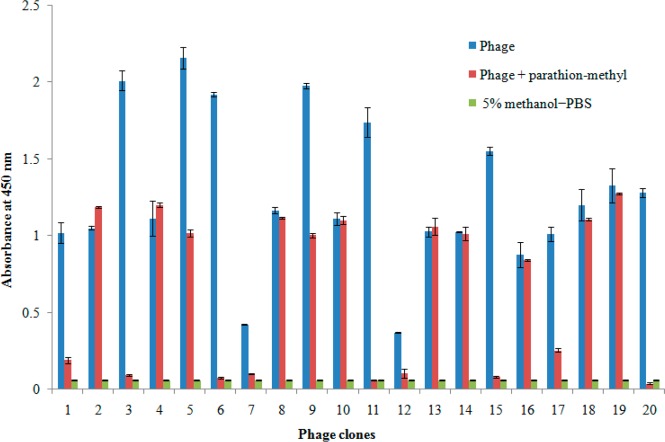
After three rounds of panning, randomly chosen clones (20 clones) were analyzed by phage ELISA in the presence (100 ng mL–1) or absence of parathion-methyl (Figure 2). Eleven clones out of 20 showed significant differences in signal with or without parathion-methyl in the assay. Phage single-stranded DNA from the positive clones was isolated, and the nucleotide sequence of each of them was determined. Only four different sequences (designated as C1-1, C3-3, C5-5, C11-2) were identified (Table 1), and they showed the consensus peptide sequence “-PWP-RP-”. Additionally, each amino acid sequence of the mimotope peptides contained four or more proline (P); thus, proline appears to be a crucial amino acid of the mimotope peptides.
Figure 2.
Screening of positive clones by phage ELISA. Eleven clones out of 20 showed significant signal differences with or without parathion-methyl at 450 nm in three replications.
Table 1. Amino Acid Sequences of Mimotope Peptides.
| clone name | sequencea |
|---|---|
| C1-1 | PPWPARPG (1) |
| C3-3 | PPWPLRPG (3) |
| C5-5 | APWPPRPG (5) |
| C11-2 | SPPWPPRP (2) |
A total of 11 clones were sequenced. The numbers of isolates bearing the same sequence are indicated in parentheses.
Primers
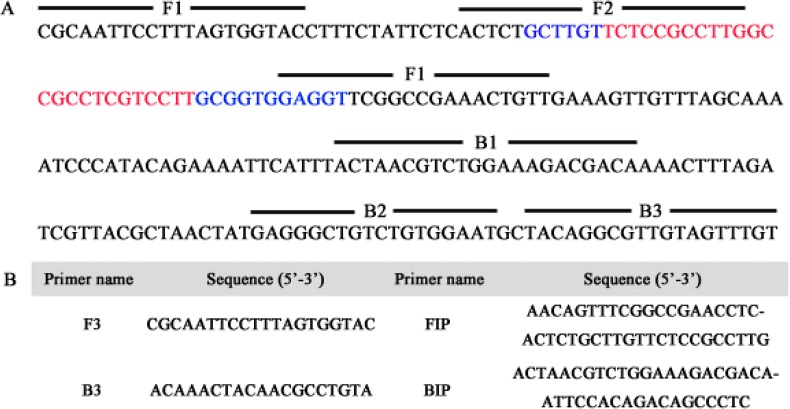
The specific LAMP primers based on the nucleotide sequence of C11-2 (Figure 3A) with the highest sensitivity for phage ELISA were designed by using Primer Explorer V4. The structure of the LAMP primers and their complementarity to target DNA used in this study are shown in Figure 3B. A forward inner primer (FIP) consisted of the complementary sequence of F1 (F1c) and F2, and a backward inner primer (BIP) consisted of B1c and B2. The outer primers F3 and B3 are required for initiation of the LAMP reaction.
Figure 3.
Design of LAMP primers for detection of C11-2. (A) The nucleotide sequence of C11-2, the color signal region was the nucleotide sequence of the cyclic 8-amino-acid peptide. The sequences used for LAMP primers are indicated by bold lines. (B) Information of the primers, a forward inner primer (FIP) consisted of the complementary sequence of F1 (F1c) and F2, and a backward inner primer (BIP) consisted of B1c and B2. The outer primers F3 and B3 are required for initiation of the LAMP reaction.
Sensitivity and Specificity of the LAMP
The limit of detection of LAMP for C11-2 was 8.5 × 10³ pfu mL–1 whether detection involved HNB (Figure 4A) or gel electrophoresis (Figure 4B). No positive DNA products were observed when helper phage M13K07 and M13KE vector were used as templates (Figure 4C,D). In this study, the LAMP reaction was the signal used to judge the result of the analysis. Therefore, the sensitivity and specificity of the LAMP reaction itself are significant parameters for development of the iLAMP. Comparing the titer of the supernatant (detected by LAMP reaction in iLAMP assay), the sensitivity of the LAMP was adequate for developing the iLAMP (Table 2). The LOD (the mean OD450 of control plus 3 standard deviations) of the ELISA (phage ELISA without parathion-methyl) detecting C11-2 was 1.2 × 10⁷ pfu mL–1 (Figure 5), which was 1400-fold higher than that of the LAMP reaction. In competitive immunoassay, analyte was generally detected by indirect screening of the competitor, so that this result indicated the LAMP reaction had the ability to develop a highly sensitive iLAMP. The specificity of the LAMP reaction indicated the iLAMP was not affected by the DNA template in the sample and environment.
Figure 4.
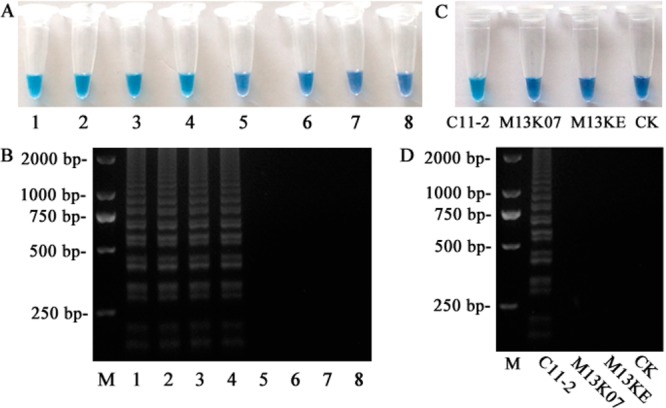
Sensitivity and specificity of the LAMP reaction. The sensitivity was evaluated on (A) HNB visualization of color change and (B) 2% agarose gel electrophoresis analysis of the LAMP products. Specificity was assessed by detecting 2 × 10⁶ pfu mL–1 helper phage M13K07 and 1 mg μL–1 M13KE vector, the result was observed by (C) color change and (D) 2% agarose gel electrophoresis. M represented 2000 bp DNA mark; 1 represented positive control; 8 and CK represented negative control; 2 to 7 respectively represented 8.5 × 10⁴, 1.7 × 10⁴, 8.5 × 10³, 1.7 × 10³, 8.5 × 10², and 1.7 × 10² pfu mL–1 C11-2.
Table 2. Titers and Their Difference between the Serial Concentrations of Parathion-methyl in the Two Methods (n = 3).
| The First Method | |||||||
|---|---|---|---|---|---|---|---|
| concentration (ng mL–1) | 10 | 5 | 1 | 0.5 | 0.1 | 0.05 | 0 |
| titer ( × 104, pfu mL–1) | 17.30 | 18.50 | 15.30 | 10.30 | 5.30 | 6.60 | 4.00 |
| con. xa/con. 0b | 4.3 | 4.6 | 3.8 | 2.6 | 1.3 | 1.6 | 1 |
| The Second Method | |||||||
|---|---|---|---|---|---|---|---|
| concentration (ng mL–1) | 8 | 4 | 2 | 1 | 0.5 | 0.25 | 0 |
| titer ( × 104, pfu mL–1) | 0.21 | 0.51 | 1.28 | 7.80 | 9.70 | 10.00 | 11.10 |
| con. 0/con. x | 52.9 | 21.8 | 8.7 | 1.4 | 1.1 | 1.1 | 1 |
The titer for serial concentrations of parathion-methyl.
The titer for 0 ng mL–1 parathion-methyl.
Figure 5.
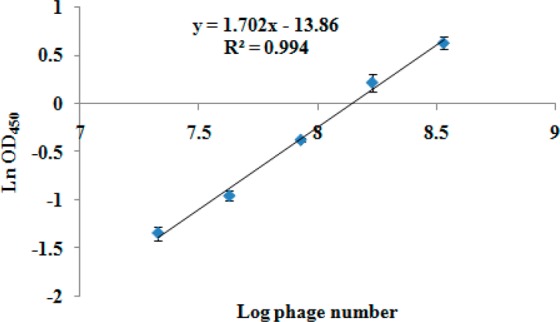
ELISA for phage C11-2. The LOD was calculated as the mean of negative OD450 (0.137) plus 3 standard deviations (3 × 0.008), which was at 0.161 (n = 3).
Comparison of the Two ILAMP Methods
In three repetitions, the LODs of the first iLAMP method were 0.5, 0.5, and 1 ng mL–1, respectively. The LOD of the second iLAMP method was consistently 2 ng mL–1 (Figure 6). Comparing the two iLAMP methods, the first method appeared to be more sensitive than the second method, but the variable LOD values of the first one was somewhat unsatisfactory. The titers of the supernatant (detected by LAMP reaction in iLAMP) were detected in order to explain the phenomenon (Table 2). Table 2 shows the difference in phage titer at different concentrations of parathion-methyl was not significant by the first method, with the maximal signal at the highest concentration 4.3 times higher than the lowest concentration. In contrast, the titer has considerable difference in second method, showing the maximal signal at 8 ng mL–1 52.9 times higher than that at 0 ng mL–1, resulting in much higher signal-to-noise ratio by the second method. This was the reason for the different stability between the two methods. Besides, the reason for the variable titer between the two methods can be in part explained by the assay protocols. In the first method, the steps of competing and eluting were completed in a single step by adding analyte in PBS for 1 h at 37 °C to elute the bound phage from the coating antibody. In the second method those steps were completed separately by adding analyte and phage together and eluting with 100 μL of parathion-methyl. Since the second method was more reproducible, it was used for the next study.
Figure 6.
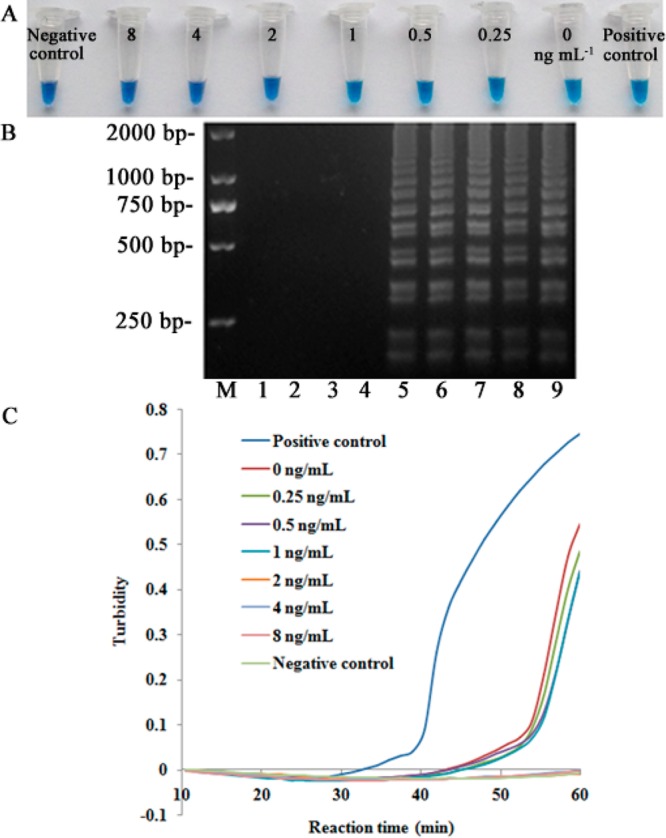
Sensitivity of the second iLAMP. Concentration range of parathion-methyl standard assayed by the second iLAMP. (A) HNB-visualized. (B) 2.0% agarose gel electrophoresis, M represented 2000 bp DNA mark, 1 represented negative control, 9 represented positive control, 2 to 8 respectively represented 8, 4, 2, 1, 0.5, 0.25, and 0 ng mL–1 parathion-methyl. (C) turbidimeter.
Sensitivity and Selectivity of the ILAMP (Second Method)
In total, 23 OP pesticides were evaluated using the iLAMP, and the results are presented in Table 3. The LOD ranged from 2 to 128 ng mL–1 for the eight OP pesticides (parathion-methyl, parathion, fenitrothion, EPN, cyanophos, paraoxon-methyl, paraoxon-ethyl, and fenitrooxon). The sensitivity of the iLAMP was higher than a previous qualitative immunoassay (immunochromatographic assay, ICA).35 The eight OP pesticides were the main cross reactants, and the CRs for the iLAMP were similar to those from the ELISA and ICA.35 Therefore, the developed iLAMP was selective for the eight OP pesticides.
Table 3. LOD and CR of a Set of Analogs Related to Parathion-methyl by ILAMP.
| cmpd | LOD (ng mL–1) | CR (%) | |
|---|---|---|---|
| 1 | parathion-methyl | 2 | 100 |
| 2 | parathion | 8 | 25 |
| 3 | fenitrothion | 4 | 50 |
| 4 | cyanophos | 16 | 12.5 |
| 5 | EPN | 32 | 6.3 |
| 6 | paraoxon-methyl | 128 | 1.6 |
| 7 | paraoxon | 128 | 1.6 |
| 8 | fenitrooxon | 128 | 1.6 |
| 9 | dicapthon | 512 | 0.4 |
| 10 | famphur | >10000 | <0.02 |
| 11 | isocarbophos | >10000 | <0.02 |
| 12 | fenthion | >10000 | <0.02 |
| 13 | triazophos | >10000 | <0.02 |
| 14 | chlorpyrifos | >10000 | <0.02 |
| 15 | chlorpyrifos-methyl | >10000 | <0.02 |
| 16 | phoxim | >10000 | <0.02 |
| 17 | malathion | >10000 | <0.02 |
| 18 | phorate | >10000 | <0.02 |
| 19 | dimethoate | >10000 | <0.02 |
| 20 | acephate | >10000 | <0.02 |
| 21 | dichlorvos | >10000 | <0.02 |
| 22 | tolclofos-methyl | >10000 | <0.02 |
| 23 | azinphos-methyl | >10000 | ⟨0.02 |
Analysis of Spiked Samples
During the iLAMP, the matrix interference was adequately removed from the Chinese cabbage, apple, and greengrocery samples with at least a 40-fold dilution. Each sample was spiked with parathion-methyl, parathion, and fenitrothion at different concentrations (0, LOD × 40, and LOD × 80) and determined by using the developed iLAMP assay. Each test was done in triplicate. The color of the mixture in the tube was sky blue for all the samples containing no analytes, and the color was violet for the spiked samples (Table 4). In this study, the spiked samples were detected by the ELISA35 that was established with the same antibodies to validate the novel iLAMP. The spiked recoveries of the ELISA were between 76.3% and 112.6%, and all of the coefficient of variation (CV) were less than or equal to 16.3% (Table 4). The results show the iLAMP and ELISA yielded comparable results. These results demonstrated that the iLAMP assay has high accuracy and reproducibility for detecting OP pesticides in agricultural products.
Table 4. Results of Spiked Sample Analysis by ILAMP and ELISA35.
| iLAMP (n = 3) | ELISA (n = 3) |
||||
|---|---|---|---|---|---|
| cmpd | sample | spiked (ng g–1) | color | recovery (%) | CV |
| parathion-methyl | Chinese cabbage | 0 | Sa, S, S | NDc | ND |
| 80 | Vb, V, V | 78.4 | 9.0 | ||
| 160 | V, V, V | 83.9 | 3.5 | ||
| apple | 0 | S, S, S | ND | ND | |
| 80 | V, V, V | 86.4 | 3.4 | ||
| 160 | V, V, V | 82.4 | 7.8 | ||
| greengrocery | 0 | S, S, S | ND | ND | |
| 80 | V, V, V | 108.8 | 3.8 | ||
| 160 | V, V, V | 107.6 | 3.0 | ||
| parathion | Chinese cabbage | 0 | S, S, S | ND | ND |
| 80 | V, V, V | 83.4 | 10.1 | ||
| 160 | V, V, V | 76.3 | 9.3 | ||
| apple | 0 | S, S, S | ND | ND | |
| 80 | V, V, V | 77.8 | 4.4 | ||
| 160 | V, V, V | 82.2 | 16.3 | ||
| greengrocery | 0 | S, S, S | ND | ND | |
| 80 | V, V, V | 112.2 | 2.8 | ||
| 160 | V, V, V | 106.6 | 5.5 | ||
| fenitrothion | Chinese cabbage | 0 | S, S, S | ND | ND |
| 80 | V, V, V | 80.0 | 9.8 | ||
| 160 | V, V, V | 90.9 | 9.1 | ||
| apple | 0 | S, S, S | ND | ND | |
| 80 | V, V, V | 82.6 | 5.9 | ||
| 160 | V, V, V | 84.6 | 10.8 | ||
| greengrocery | 0 | S, S, S | ND | ND | |
| 80 | V, V, V | 104.7 | 6.5 | ||
| 160 | V, V, V | 112.6 | 3.3 | ||
V: violet, represents the positive results (the concentration was 80 ng g–1 or greater).
S: sky blue, represents the negative results (the concentration was less than 80 ng g–1).
ND: no detection.
Conclusions
This work presents the development of a novel iLAMP assay to detect various OP pesticides in agricultural samples. Utilizing the phage display technology, the LAMP assay was successfully developed to analyze small-molecular weight pesticides with no DNA strand for amplification by the LAMP. The LODs of the developed iLAMP ranged from 2 to 128 ng mL–1 depending on the type of OP pesticide. The recovery test with spiked agricultural products indicated the iLAMP was a suitable method for the detection of many OP pesticides in agricultural samples. The phage-borne peptide could be used as a competitor directly, and its single-stranded DNA was a native template for amplification. The amplification of phage DNA by the LAMP was extremely efficient with no instrumental requirement. This study demonstrates that phage-borne peptide mimotopes could be an excellent secondary reagent to develop a novel iLAMP with higher sensitivity for the detection of small molecules. To the best of our knowledge, this is the first time that the iLAMP assay has been applied in the detection of compounds in general and for OP pesticides.
Acknowledgments
This work was supported by the National Natural Science Foundation of China (31301690), the Doctoral Program of Higher Education Research Fund (20130097120006), and the Youth Innovation Fund in Science & Technology of Nanjing Agricultural University (KJ2013008). Partial funding was also received from the National Institute of Environmental Health Sciences Superfund Research Program (P42 ES04699) and the National Institute of Occupational Health Sciences Western Center for Agricultural Health Research (U50 OH07550).
The authors declare no competing financial interest.
Funding Statement
National Institutes of Health, United States
References
- Roex E. W.; Keijzers R.; van Gestel C. A. Aquat. Toxicol. 2003, 64, 451–460. [DOI] [PubMed] [Google Scholar]
- Nagamine K.; Hase T.; Notomi T. Mol. Cell. Probes 2002, 16, 223–229. [DOI] [PubMed] [Google Scholar]
- Hara-Kudo Y.; Yoshino M.; Kojima T.; Ikedo M. FEMS Microbiol. Lett. 2005, 253, 155–161. [DOI] [PubMed] [Google Scholar]
- Hara-Kudo Y.; Nemoto J.; Ohtsuka K.; Segawa Y.; Takatori K.; Kojima T.; Ikedo M. J. Med. Microbiol. 2007, 56, 398–406. [DOI] [PubMed] [Google Scholar]
- Yamazaki W.; Taguchi M.; Ishibashi M.; Kitazato M.; Nukina M.; Misawa N.; Inoue K. J. Med. Microbiol. 2008, 57, 444–451. [DOI] [PubMed] [Google Scholar]
- Fu S.; Qu G.; Guo S.; Ma L.; Zhang N.; Zhang S.; Gao S.; Shen Z. Appl. Biochem. Biotechnol. 2011, 163, 845–850. [DOI] [PubMed] [Google Scholar]
- Chowdry V. K.; Luo Y.; Widén F.; Qiu H. J.; Shan H.; Belák S.; Liu L. J. Virol. Methods 2014, 197, 14–18. [DOI] [PubMed] [Google Scholar]
- Duan Y.; Ge C.; Zhang X.; Wang J.; Zhou M. Australasian Plant Pathol. 2014, 43, 61–66. [Google Scholar]
- Notomi T.; Okayama H.; Masubuchi H.; Yonekawa T.; Watanabe K.; Amino N.; Hase T. Nucleic Acids Res. 2000, 28, e63. [DOI] [PMC free article] [PubMed] [Google Scholar]
- Liu D. Y.; Liang G. T.; Zhang Q.; Chen B. Anal. Chem. 2013, 85, 4698–4704. [DOI] [PubMed] [Google Scholar]
- Nixon G.; Garson J. A.; Grant P.; Nastouli E.; Foy C. A.; Huggett J. F. Anal. Chem. 2014, 86, 4387–4394. [DOI] [PubMed] [Google Scholar]
- Zhang M.; Liu Y. N.; Chen L. L.; Quan S.; Jiang S. M.; Zhang D. B.; Yang L. T. Anal. Chem. 2013, 85, 75–82. [DOI] [PubMed] [Google Scholar]
- Chen L.; Guo J.; Wang Q.; Yang L. J. Agric. Food Chem. 2011, 59, 5914–5918. [DOI] [PubMed] [Google Scholar]
- Horibe D.; Ochiai T.; Shimada H.; Tomonaga T.; Nomura F.; Gun M.; Tanizawa T.; Hayashi H. Int. J. Cancer 2007, 120, 1063–1069. [DOI] [PubMed] [Google Scholar]
- Yoneda A.; Taniguchi K.; Torashima Y.; Susumu S.; Kanetaka K.; Kuroki T.; Eguchi S. J. Surg. Res. 2014, 187, e1–e6. [DOI] [PubMed] [Google Scholar]
- Hirayama H.; Kageyama S.; Takahashi Y.; Moriyasu S.; Sawai K.; Onoe S.; Watanabe K.; Kojiya S.; Notomi T.; Minamihashi A. Theriogenology 2006, 66, 1249–1256. [DOI] [PubMed] [Google Scholar]
- Huang J. M.; You W.; Wu N. K.; Tan X. W. Asian-Aust. J. Sci. 2007, 20, 866–871. [Google Scholar]
- Smith G. P. Science 1985, 228, 1315–1317. [DOI] [PubMed] [Google Scholar]
- Sompuram S. R.; Kodela V.; Ramanathan H.; Wescott C.; Radcliffe G.; Bogen S. A. Clin. Chem. 2002, 48, 410–420. [PubMed] [Google Scholar]
- Menendez A.; Scott J. K. Anal. Biochem. 2005, 336, 145–157. [DOI] [PubMed] [Google Scholar]
- Gonzalez-Techera A.; Vanrell L.; Last J. A.; Hammock B. D.; Gonzalez-Sapienza G. Anal. Chem. 2007, 79, 7799–7806. [DOI] [PMC free article] [PubMed] [Google Scholar]
- Dufner P.; Jermutus L.; Minter R. R. Trends Biotechnol. 2006, 24, 523–529. [DOI] [PubMed] [Google Scholar]
- Kim H. J.; McCoy M. R.; Majkova Z.; Dechant J. E.; Gee S. J.; Tabares-da Rosa S.; Gonzalez-Sapienza G. G.; Hammock B. D. Anal. Chem. 2012, 84, 1165–1171. [DOI] [PMC free article] [PubMed] [Google Scholar]
- Goldman E. R.; Pazirandeh M. P.; Charles P. T.; Balighian E. D.; Anderson G. P. Anal. Chim. Acta 2002, 457, 13–19. [Google Scholar]
- Kim Y.-G.; Lee C.-S.; Chung W.-J.; Kim E.-M.; Shin D.-S.; Rhim J.-H.; Lee Y.-S.; Kim B.-G.; Chung J. Biochem. Biophys. Res. Commun. 2005, 329, 312–317. [DOI] [PubMed] [Google Scholar]
- Wu J.; Wu M. C.; Zhang L. F. J. Biosciences 2009, 34, 213–220. [DOI] [PubMed] [Google Scholar]
- Park H. Y.; Park H. C.; Yoon M. Y. J. Microbiol. Methods 2009, 78, 54–58. [DOI] [PubMed] [Google Scholar]
- Bratkovic T. Cell. Mol. Life Sci. 2010, 67, 749–767. [DOI] [PMC free article] [PubMed] [Google Scholar]
- Kim H.-J.; González-Techera A.; González-Sapienza G. G.; Ahn K. C.; Gee S. J.; Hammock B. D. Environ. Sci. Technol. 2008, 42, 2047–2053. [DOI] [PubMed] [Google Scholar]
- Yuan Q.; Pestka J. J.; Hespenheide B. M.; Kuhn L. A.; Linz J. E.; Hart L. P. Appl. Environ. Microb. 1999, 65, 3279–3286. [DOI] [PMC free article] [PubMed] [Google Scholar]
- He Q.-H.; Xu Y.; Huang Y.-H.; Liu R.-R.; Huang Z.-B.; Li Y.-P. Food Chem. 2011, 126, 1312–1315. [Google Scholar]
- Renrong L.; Zhou Y.; Qinghua H.; Yang X. Food Control 2007, 18, 872–877. [Google Scholar]
- Thirumala-Devi K.; Miller J. S.; Reddy G.; Reddy D. V.; Mayo M. A. J. Appl. Microbiol. 2001, 90, 330–336. [DOI] [PubMed] [Google Scholar]
- Wang Y.; Wang H.; Li P.; Zhang Q.; Kim H. J.; Gee S. J.; Hammock B. D. J. Agric. Food Chem. 2013, 61, 2426–2433. [DOI] [PMC free article] [PubMed] [Google Scholar]
- Hua X.; Yang J.; Wang L.; Fang Q.; Zhang G.; Liu F. PLoS One 2012, 7, e53099. [DOI] [PMC free article] [PubMed] [Google Scholar]


