

Abstract
Predictive modeling of human disease based on the microbiota holds great potential yet remains challenging. Here, 50 adults underwent controlled transitions from naturally occurring gingivitis, to healthy gingivae (baseline), and to experimental gingivitis (EG). In diseased plaque microbiota, 27 bacterial genera changed in relative abundance and functional genes including 33 flagellar biosynthesis-related groups were enriched. Plaque microbiota structure exhibited a continuous gradient along the first principal component, reflecting transition from healthy to diseased states, which correlated with Mazza Gingival Index. We identified two host types with distinct gingivitis sensitivity. Our proposed microbial indices of gingivitis classified host types with 74% reliability, and, when tested on another 41-member cohort, distinguished healthy from diseased individuals with 95% accuracy. Furthermore, the state of the microbiota in naturally occurring gingivitis predicted the microbiota state and severity of subsequent EG (but not the state of the microbiota during the healthy baseline period). Because the effect of disease is greater than interpersonal variation in plaque, in contrast to the gut, plaque microbiota may provide advantages in predictive modeling of oral diseases.
Keywords: gingivitis, plaque, metagenomics, microbial indices of gingivitis
Introduction
With the importance of human microbiota in health and disease being discovered at an unprecedented rate, an ultimate goal has become to classify host states based on the microbiota, and, ultimately, to predict future states based on the current state of the microbiota (Knights et al., 2011; Lozupone et al., 2012). However, thus far, few reports of successful predictive modeling or classification of human disease based on the human microbiota have been published (Faith et al., 2011; Qin et al., 2012). Gingivitis, inflammation of the soft tissues surrounding the teeth, is one of the most prevalent infections and the most common oral disease in humans. As a worldwide health concern, it affects most children and adolescents (Petersen et al., 2005; Kornman, 2008; Filoche et al., 2010; Jin et al., 2011). The disease is believed to result from buildup of plaque (Moore et al., 1987) and ensuing interactions between the plaque microbiota and host tissues (Handfield et al., 2008; Offenbacher et al., 2009). Although no apical migration of the junctional epithelium occurs, these tissues become erythematous and bleed upon probing. Moreover, chronic gingivitis can progress to periodontitis, an irreversible periodontal infection characterized by alveolar bone loss, attachment loss, formation of periodontal pockets and eventually tooth loss (Sheiham, 1997; Loesche, 2007; Ramseier et al., 2009). Therefore, preventive measures against gingivitis, and improved tools for prognosis and early diagnosis, are of particular clinical significance.
Several factors have hindered investigating the etiology of gingivitis (Tatakis and Trombelli, 2004). In natural human populations, gingivitis symptoms can be reversible and volatile, because numerous internally or externally imposed disturbances including oral hygiene practices (personal or professional), impairment of immune system, injury, diet and oral state may all potentially affect disease development and confound disease monitoring (van der Weijden et al., 2002; Sharma et al., 2004). Moreover, clinical diagnoses of gingivitis at present are typically based on individual observations and judgment by human examiners, where the results can be difficult to compare between patients and examiners. Furthermore, despite the complexity of oral microbial communities and the suspected polymicrobial nature of chronic oral infections, most population-wide surveys of gingivitis-associated microbiota have been limited to only a few culturable bacteria (for example, the ‘red complex' including Porphyromonas gingivalis, Tannerella forsythia and Treponema denticola) (Loe et al., 1965; Savitt and Socransky, 1984; Socransky et al., 1998; Haffajee et al., 2008; Igic et al., 2012; Eick et al., 2013) or have employed a small sampling size (Kistler et al., 2013).
To address these challenges, we designed a retrogression–progression model to simulate the development of gingivitis in human population. Fifty human adults underwent a controlled temporal transition from naturally occurring gingivitis at day −21 to healthy gingivae at day 0 (‘baseline'), then back to a state of experimental gingivitis (EG) at day 21. For each host, the structure and function of the plaque microbiota was measured at the three time points along the retrogression–progression model: natural gingivitis (NG), baseline and EG. We could thus gain some understanding of the dynamics of the microbiota within each subject, albeit with limited temporal resolution. The taxonomic structures of the plaque microbiota were determined by pyrosequencing of 16S rRNA genes, and functional profiles of the corresponding microbiomes determined by shotgun metagenomic sequencing. Our results suggested that the plaque microbial structure is able to classify gingivitis susceptibility and severity in natural human populations, and that the plaque microbial population during NG can predict the population structure during a later episode of experimentally induced gingivitis in the same subject.
Materials and methods
Study design and sample collection
The experimental model of gingivitis was established as a non-invasive model in humans for understanding pathogenesis of gingivitis (Loe et al., 1965; Offenbacher et al., 2009; Grant et al., 2010; Lee et al., 2012). Experiments were conducted at Procter & Gamble (Beijing) Technology Co., Ltd., Oral Care Department, with approval from the P&G Beijing Technical Center (China) Institutional Review Board and in accordance with the World Medical Association Declaration of Helsinki (1996 amendment). The International Conference on Harmonisation guidelines for good clinical practice were followed. Fifty volunteers recruited in this study completed both the oral hygiene phase (days −21–0) and the EG phase (days 0–21). For each subject, supragingival plaque along the gumline within 2 mm depth was collected with Gracey curette by qualified dentists at day −21 (NG), day 0 (baseline) and day −21 (EG). To validate the predictive model of Microbial Indices of Gingivitis, an additional cohort of 41 subjects were recruited and analyzed, who also completed the oral hygiene phase and were sampled at day −21 (NG) and day 0 (baseline).
DNA extraction and sequencing
Genomic DNA was extracted from plaque. Barcoded 16S rRNA amplicons (V1–V3 hypervariable region) of all samples were sequenced on 454 Titanium (Branford, CT, USA). For the 18 microbiota of both baseline and EG from 9 subjects that were selected from the 50-subject cohort, total plaque metagenomic DNA was sequenced on Illumina HiSeq 2000 (San Diego, CA, USA).
Full methods and related references are available in Supplementary Information.
Results
An experimentally tractable model of gingivitis retrogression and progression
On day −21 (the NG state), all 50 subjects (17 males and 33 females) exhibited gingival inflammation. In the 50-host cohort, the gingival bleeding (also described as ‘Bleeding on Probing') values ranged from 5 to 27, and the Mazza Gingival Index (Materials and methods) ranged from 1.18 to 2.24 (Figure 1). These subjects then underwent a rigorous oral hygiene regimen for 3 weeks, which resulted in greatly decreased gingival bleeding and Mazza Gingival Index values (median gingival bleeding and Mazza Gingival Index were 1.00 and 1.02, respectively) on day 0 (the baseline state), which represented a healthy gingival state. Next, these subjects underwent a 3-week program inducing EG, which resulted in significantly increased gingival bleeding (median 23) and Mazza Gingival Index (median 2.11) at day 21 (the EG state) (P<0.01 for gingival bleeding and Mazza Gingival Index).
Figure 1.

Design of longitudinal study simulating gingivitis development in human population. Boxes represent the interquartile range (IQR) and the lines inside represent the median. Whiskers denote the lowest and highest values within 1.5 × IQR. Fifty subjects were recruited for this study over 42 days. At day −21, all subjects exhibited a certain level of gingival inflammation that represented the state of naturally occurring gingivitis (‘NG') with gingival bleeding ranging from 5 to 27 and average Mazza Gingival Index from 1.18 to 2.24. These subjects then underwent rigorous oral hygiene practice for 3 weeks, which resulted in a greatly reduced gingival bleeding and Mazza Gingival Index (median gingival bleeding and Mazza Gingival Index were 1.00 and 1.02, respectively) at 0 day (‘baseline') that represented a healthy gum state. Then, the hosts further underwent an oral hygiene program for gingivitis induction for 3 weeks that resulted in significantly increased gingival bleeding (median 23) and Mazza Gingival Index (median 2.11) representing the state of EG.
At the population level, Mazza Gingival Index (P<0.001) and gingival bleeding (P=0.026) were significantly higher during EG (mean gingival bleeding 26.00±9.59 and Mazza Gingival Index 2.12±0.48) than during NG (mean gingival bleeding 13.5±5.12 and Mazza Gingival Index 1.61±0.24) based on paired t-tests. Furthermore, for individual subjects, clinical parameters between NG and EG were significantly correlated. Parameters that were significantly correlated between the two time points in the same subjects included gingival bleeding (Pearson's correlation: r=0.31, P=0.03) and Mazza Gingival Index (Pearson's correlation: r=0.35, P=0.01).
We have previously shown that plaque microbiota changed more during gingivitis than did the salivary microbiota (Huang et al., 2011). Therefore, to trace the structural and functional dynamics of the bacterial community during gingivitis retrogression and progression, we started by sequencing 16S rRNA gene amplicons from 150 plaque samples (one sample each during NG, baseline and EG for each of the 50 subjects), averaging 7293 sequences per sample (Supplementary Table S1).
The oral microbiota is profoundly altered during the retrogression–progression model
For each of the 150 plaque microbiota, bacterial phyla, genera and species were identified and their relative abundance quantified via taxonomic assignment against reference databases. At the phylum level, nearly all sequences were from 13 bacterial phyla, including 6 predominant bacterial phyla commonly encountered in the oral cavity: Firmicutes, Proteobacteria, Bacteroidetes, Actinobacteria, Fusobacteria and TM7 (each with average relative abundance >1% at least one time point) (Supplementary Figure S1A). Between the gingivitis states (NG and EG) and the healthy gingival state (baseline), significant difference (P<0.05; paired t-test) was found in five predominant phyla: Actinobacteria, Firmicutes, TM7, Bacteroidetes and Fusobacteria. A temporal shift of community structure along the progression from NG to baseline to EG was apparent, characterized by the elevated relative abundance of Actinobacteria and Firmicutes at baseline, and that of TM7, Bacteroidetes and Fusobacteria during NG and EG (Supplementary Figure S1A).
At the genus level, 27 bacterial genera (each with average relative abundance >0.1% at least one time point) were differentially distributed (P<0.05, paired t-test; false discovery rate q<0.2) between baseline and gingivitis (both NG and EG). Among them, 5 (Streptococcus, Rothia, Actinomyces, Haemophilus and Lautropia) showed elevated abundance at baseline, while 22 (Leptotrichia, Prevotella, Fusobacterium, TM7 genus, Porphyromonas, Tannerella, Selenomonas, uncultured Lachnospiraceae, unclassified Comamonadaceae, Peptococcus, Aggregatibacter, Catonella, Treponema, SR1 genus, Campylobacter, Eubacterium, Peptostreptococcus, unclassified Bacteroidaceae, Solobacterium, Johnsonella, Oribacterium, and unclassified Veillonellaceae) were enriched in both NG and EG (Supplementary Figure S1B). During the retrogression–progression model, different bacterial species within the same genus usually exhibited identical patterns of relative-abundance change, except for several species of Capnocytophaga, Actinomyces and Streptococcus (Supplementary Figure S1C).
Structural and functional features of gingivitis-associated microbiota
To identify features of the microbiota associated with gingivitis, all 150 healthy and diseased microbiota were clustered via principal component analysis (PCA) based on the relative abundance of genus-level taxa (Figure 2a). We tested whether procedures previously used to attempt to describe enterotype clustering in the human gut would identify natural clusters in our oral data. Partitioning Around Medoids clustering analysis (natural clustering of the 150 microbiota based on their structure; Materials and methods) did not support the presence of 2 clusters in the 150 microbiota (Silhouette value=0.31; no cluster formation was observed within the 100 diseased microbiota either; Figure 2b; Koren et al., 2013). However, the healthy and diseased microbiota were largely concentrated along a boundary separating baseline samples from both NG and EG (Figure 2a), suggesting that microbiota structure is connected to disease state and can classify individuals according to disease state. Procrustes analysis revealed that, between healthy gums (baseline; Mazza Gingival Index <1.10) and gingivitis-active gums (NG and EG; Mazza Gingival Index >1.15), microbiota structures were not statistically significantly associated by subject, that is, the relative orientations of samples from the same subject in the two groups of points (NG to baseline and baseline to EG) were not associated (Figure 2a; P=0.07 for NG versus baseline; P=0.21 for baseline versus EG; 10 000 Monte Carlo label permutations per experiment). However, despite the higher Mazza Gingival Index and gingival bleeding during EG, within-subject structures between NG and EG were largely consistent (P<0.001 for NG versus EG by 10 000 Monte Carlo label permutations; Figure 2a; Materials and methods), suggesting that microbial community perturbations associated with gingivitis recur the same way in the same subjects and therefore that the community configuration during the earlier episode of gingivitis can predict relapse to broadly the same community during the later episode. These results were also supported by principal coordinates analysis based on UniFrac (Hamady et al., 2010) and ThetaYC distances (Supplementary Figure S2). Consequently, each subject may have a personalized disease-associated configuration of the microbiota that recurs over time.
Figure 2.

Structural features of healthy and gingivitis microbiota. (a) Distinction in organismal structure between healthy (red) and gingivitis-associated plaque microbiota (blue and green). Microbiota from the same host were connected by solid lines between NG (blue) and EG (green). Those selected for functional analysis using whole-metagenome sequencing were labeled (black circled points). Triangle and dots indicated samples from the two putative clusters based on the Partitioning Around Medoids (PAM) clustering. (b) PAM clustering method using Jensen-Shannon distance argued against the presence of two or more clusters in all microbiota or in the diseased microbiota. (The x axis shows cluster number; the y axis shows CH index, a measure of cluster separation.) All samples were plotted on the first two principal components of the genus profile. Host and microbial features of each of the 50 human individuals were shown in the same plot as (a): gradients of Mazza Gingival Index (c) and abundance of all 15 driver genera identified (d) are colored from low value/abundance (blue) to high value/abundance (red).
The current clinical practice of separating hosts into diseased and healthy groups was based on the arbitrary Mazza Gingival Index threshold of 1.10–1.12. However, such a bimodal definition of health and disease does not match the observed characteristics of hosts and microbiota. In fact, the distribution of clinical parameters (for example, Mazza Gingival Index, Materials and methods) both within individual hosts and in human populations was continuous (Figure 1). PCA suggested that the transition of the microbiota between NG, baseline and EG was not a discrete process, but rather gradient-like (Figures 2a and c). Therefore, a new clinical model is required that considers the distribution of both disease phenotype and microbiota structure along a gradient, which should also be useful for providing a more objective measure of disease states and allowing more appropriate statistical tests of links between the microbiota and the disease.
The projected coordinate of a given microbiota on the first principal component (PC1) appeared to capture the gradient-like heterogeneity and development of microbiota structure along disease retrogression and progression, because changes in PC1 within subjects and across cohorts were largely consistent with the structural segregation between healthy and diseased microbiota (Figure 2a). Moreover, the relative order of microbiota along PC1 defined using all 150 samples (Figure 2a) was similar to those defined using only healthy, only NG or only EG microbiota alone (Spearman correlation; all versus healthy-only: rho=0.95, P<0.001; all versus NG: rho=0.97, P<0.001; all versus EG: rho=0.97, P<0.001, Materials and methods). Therefore, PC1 appeared to be the primary descriptor and a good proxy for quantitatively measuring the development of the microbiota during both transitions (NG to baseline and baseline to EG).
For the 50 hosts considered at all three time points, 15 bacterial genera were found to be the drivers of microbiota heterogeneity along PC1, as their gradients in abundance were significantly correlated with the coordinates of their corresponding samples on PC1 (Figure 2d; Spearman rho>0.7, false discovery rate q<0.2). These drivers included Rothia, Haemophilus, Prevotella, Leptotrichia, Fusobacterium, Selenomonas, uncultured Lachnospiraceae, TM7 genus, Tannerella, Peptococcus, Peptostreptococcus, Catonella, Treponema, Solobacterium and unclassified Bacteroidaceae. Two of the fifteen genera, Rothia and Haemophilus, decreased in relative abundance along PC1 (‘negative drivers'), while the other thirteen increased along PC1 (‘positive drivers' Figure 2d).
To test the functional features of gingivitis microbiota, the genomic DNA from 18 of the plaques (from 9 of the subjects, each of whom was sampled during both baseline and EG) was extracted and shotgun sequenced respectively at a depth of averagely 3.94 Gb per sample (Table 1; Materials and methods). These nine subjects were picked to maximize the phylogenetic diversity of microbiota sampled (their relative coordinates shown on the PCA plot of all 150 samples in Figure 2a). Functional genes encoded in the microbiota were analyzed based on Clusters of Orthologous Groups (COGs) database (Tatusov et al., 2001) and compared based on the relative frequencies of the assigned COGs (Materials and methods). Interestingly, Procrustes analysis (Muegge et al., 2011) indicated that, among the 18 samples, the agreement between phylogenetic and functional measurements based on COGs was excellent (P<0.001 using 10 000 Monte Carlo label permutations; Figure 3a). Furthermore, clustering of the 18 microbiota based on encoded functional genes, nearly identical to that based on the organismal structure, suggested that microbiota differed in functional gene structure between healthy subjects and those with gingivitis (Figure 3b). In total, 1205 COGs involving 24 functional categories (out of 4873 COGs in 25 categories) were either positively or negatively gingivitis associated (P<0.01) (Supplementary Table S2). For example, in Functional Category N (cell motility), 33 COGs mostly related to flagellar biosynthesis pathways were enriched in gingivitis, while merely 3 COGs (all related to pilus assembly protein) were enriched in healthy hosts (Figure 3c). On the other hand, in Functional Category P (inorganic ion transport and metabolism), 32 COGs were enriched in healthy samples while only 19 were depleted. Thus, gingivitis microbiomes were distinct from healthy ones in both structure and function.
Table 1. Features of metagenome shotgun sequences produced for the 18 plaque microbiota.
| Host ID | Age | Sex | Baseline | EG (experimentally induced gingivitis) | ||||||||
|---|---|---|---|---|---|---|---|---|---|---|---|---|
| |
|
|
Sample ID |
Mazza GI |
Bleeding sites number |
Metagenome sample size (Gb) |
Metagenome reads |
Sample ID |
Mazza GI |
Bleeding sites number |
Metagenome sample size (Gb) |
Metagenome reads |
| 9066 | 32 | F | 9066B | 1.00 | 0 | 3.92 | 26 110 020 | 9066E | 1.93 | 26 | 4.05 | 26 999 772 |
| 9174 | 36 | F | 9174B | 1.05 | 2 | 3.75 | 25 005 760 | 9174E | 2.63 | 39 | 4.14 | 27 567 214 |
| 9183 | 26 | M | 9183B | 1.02 | 1 | 4.15 | 27 644 386 | 9183E | 1.77 | 19 | 3.91 | 26 036 894 |
| 9439 | 27 | F | 9439B | 1.00 | 0 | 3.73 | 24 860 734 | 9439E | 1.68 | 19 | 4.08 | 27 193 368 |
| 9445 | 27 | M | 9445B | 1.05 | 2 | 3.25 | 21 661 610 | 9445E | 1.98 | 26 | 4.08 | 27 186 152 |
| 9147 | 28 | M | 9147B | 1.04 | 2 | 3.99 | 26 585 026 | 9147E | 2.34 | 29 | 3.96 | 26 410 660 |
| 9148 | 41 | F | 9148B | 1.07 | 2 | 4.02 | 26 815 920 | 9148E | 3.13 | 41 | 3.27 | 21 798 906 |
| 9307 | 34 | F | 9307B | 1.04 | 2 | 4.14 | 27 567 214 | 9307E | 2.33 | 32 | 4.21 | 28 041 294 |
| 9325 | 32 | F | 9325B | 1.00 | 0 | 4.14 | 27 590 228 | 9325E | 2.52 | 36 | 4.09 | 27 281 026 |
Abbreviation: Mazza GI: Mazza Gingival Index.
Figure 3.

Functional features of gingivitis-associated microbiota. (a) Procrustes analysis of 16S rRNA gene sequences (PCA) against COGs. Each point represented a plaque microbiota and was colored according to the clinical status. The arrow end of each line connected to the 16S rRNA data for the sample, whereas the other end connected to the functional annotation. The fit of each Procrustes transformation over the first four dimensions was reported as the P-value by 10 000 Monte Carlo label permutations. (b) Functional distinctions between healthy and gingivitis microbiota. PCA showed that disease state significantly affected the microbial functional structure. The effects of disease state on the microbial functions appeared to be well separated by the first axis. (c) The 33 gingivitis-enriched orthologous groups that encode components of the flagellar biosynthesis pathway. The schematic was adapted from KEGG, with gene names of the corresponding KO (KEGG Ortholog) highlighted in red.
Link between PC1 and disease phenotype
The classification of healthy and diseased microbiota using the PCA based on the 16S rRNA gene taxonomy was identical to that using the PCA based on functional genes, suggesting that the value of each sample along the PC1 axis is a useful descriptor for both structural and functional features of gingivitis microbiota.
The value of PC1 appeared to harbor clinically useful information. During NG (and also during EG), there was a significant correlation between Mazza Gingival Index and PC1 values among the 50 subjects (Table 2; Spearman correlation NG: rho=0.37, P<0.01; EG: rho= 0.48, P<0.001). Moreover, between NG and baseline (and also between baseline and EG), the PC1 values of the 100 microbiota were positively correlated with Mazza Gingival Index (Spearman correlation; all: rho=0.74, P<0.001; NG to baseline: rho=0.77, P<0.001; baseline to EG: rho=0.79, P<0.001).
Table 2. Correlation between alteration in microbiota structure (ΔPC1) and change in MGI (ΔMGI) for the 50-host cohort at NG-baseline, baseline-EG and NG-EG.
| Spearman correlation (rho) |
NG to baseline |
Baseline to EG |
NG to EG |
|||||||||
|---|---|---|---|---|---|---|---|---|---|---|---|---|
| NG.PC1 | ΔPC1 | NG.MGI | ΔMGI | B.PC1 | ΔPC1 | B.MGI | ΔMGI | EG.PC1 | ΔPC1 | EG.MGI | ΔMGI | |
| NG to baseline | ||||||||||||
| NG.PC1 | NA | — | — | — | — | — | — | — | — | — | — | — |
| ΔPC1 | −0.86 | NA | — | — | — | — | — | — | — | — | — | — |
| NG.MGI | 0.37 | −0.42 | NA | — | — | — | — | — | — | — | — | — |
| ΔMGI | −0.36 | 0.4 | −0.98 | NA | — | — | — | — | — | — | — | — |
| Baseline to EG | ||||||||||||
| B.PC1 | NA | — | — | — | — | — | — | — | ||||
| ΔPC1 | 0.28 | −0.51 | NA | — | — | — | — | — | — | |||
| B.MGI | NA | — | — | — | — | — | ||||||
| ΔMGI | 0.39 | −0.38 | 0.53 | NA | — | — | — | — | ||||
| NG to EG | ||||||||||||
| EG.PC1 | 0.4 | −0.44 | 0.89 | 0.48 | NA | — | — | — | ||||
| ΔPC1 | −0.56 | 0.43 | 0.49 | 0.43 | 0.43 | NA | — | — | ||||
| EG.MGI | 0.39 | −0.37 | 0.53 | 1 | 0.48 | 0.43 | NA | — | ||||
| ΔMGI | 0.44 | 0.86 | 0.41 | 0.56 | 0.86 | NA | ||||||
Abbreviations: EG, experimental gingivitis; MGI, Mazza Gingival Index; NG, natural gingivitis; PC1, first principal component.
Only the rho values with its corresponding P<0.05 (that is, significant correlation) were shown. Significant within-phase ΔPC1-ΔMGI correlations were labeled in italic. Significant inter-phase ΔPC1-ΔPC1 or ΔMGI-ΔMGI correlations were labeled in bold.
Change in PC1 was also clinically relevant. Among the 50 hosts, in each of the 2 segments within the retrogression–progression model (NG to baseline and baseline to EG), the within-subject changes in PC1 and Mazza Gingival Index were significantly correlated (Table 2; labeled in italic), as were the correlations between the changes in PC1 between the two segments, the changes in Mazza Gingival Index between the two segments (Table 2; labeled in bold). Moreover, the within-subject change in PC1 was significantly correlated with the within-subject change in Mazza Gingival Index between NG and EG (Table 2; Spearman correlation rho=0.56, P=0). Interestingly, for the 10 bottom-quintile subjects with little change in Mazza Gingival Index between NG and EG, the change in PC1 was not significantly correlated with the change in Mazza Gingival Index (Spearman correlation rho=0.25, P=0.48). However, for the 10 top-quintile subjects where the Mazza Gingival Index changed the most between NG and EG, the change in Mazza Gingival Index was significantly correlated with the change in PC1 (Spearman correlation rho=0.64, P=0.05), suggesting that the change in PC1 quantitatively reflects the degree of change in gingivitis symptoms.
Two types of hosts with distinct sensitivity to gingivitis
Among the 50 subjects, most hosts exhibited a largely consistent microbiota structure during the disease progression from NG to EG (Figure 2a). Although changes in PC1 associated with the transition from NG to baseline (or baseline to EG) varied considerably among the 50-host cohort, the rate of microbiota change from NG to baseline and that from baseline to EG was largely similar within each subject (Table 2; Figure 4a). The rate of Mazza Gingival Index change followed a similar pattern (Table 2; Figure 4a). Furthermore, the gingivitis severity (that is, Mazza Gingival Index) during EG was highly correlated with that during NG, as was microbiota structure (that is, PC1) (Table 2). The persistence of disease outcome as well as microbiota structure for majority of the hosts during EG (as compared with NG) suggested the presence of host-dependent (and likely personal) factors in determining the susceptibility to gingivitis reoccurrence in natural human populations.
Figure 4.

Heterogeneity of gingivitis sensitivity in human hosts. (a) The patterns of microbiota structural (that is, PC1 values) change and Mazza Gingival Index change during the retrogression–progression model. The two colors indicated type-I (blue) and type-II (red) hosts. (b) All hosts in the 50-member cohort were plotted on the first two principle components of the PCA based on the change profiles of microbiota and Mazza Gingival Index. The histogram and the kernel density plot (green line) describing distribution of the 50 hosts along the principle component of the PCA were shown. The vertical dash line divided the 50 hosts into type I (blue) and type II (red). The four variables as main contributors to these clusters were determined and plotted by their loadings in these two principal components. (c) Difference in gingivitis sensitivity between type-I and type-II hosts. The within-subject ΔPC1 and Δ Mazza Gingival Index were compared. Boxes represented the interquartile range (IQR) and the lines inside represent the median. Whiskers denoted the lowest and highest values within 1.5 × IQR. (d) Bacterial genera associated with type I and type II of hosts with distinct disease sensitivity. Green: type I enriched; Red: type I depleted.
To test whether disease susceptibility differed among the 50 subjects, we performed a PCA using as input variables the change along PC1 from NG to baseline and from baseline to EG, and the change in Mazza Gingival Index in each of these two segments, for each subject (Figure 4b). The distribution pattern of the 50 hosts suggested a bimodal distribution (P=0.74 for the hypothesis of non-bimodal distribution based on Hartigans' dip test for unimodality), where a discriminating line can be drawn to divide the hosts into two types (Figure 4b), which we designated as type I (17 individuals) and type II (33 individuals). Type-II hosts were characterized by more acute changes in both microbiota structure and Mazza Gingival Index than type-I hosts (Figure 4c). For an average type-II host, the rate of change in PC1 was 0.33 per day, and the rate of change in the Mazza Gingival Index 0.05 per day, which were respectively 2.21-fold and 1.89-fold of an average type-I host (Figure 4c).
During both NG and EG, there were significant relationships between these types of host sensitivity to gingivitis and the relative abundance of certain taxa (P<0.05, Wilcoxon rank-sum test). These taxa included Abiotrophia, Selenomonas, uncultured Lachnospiraceae, Peptococcus, unclassified Bacteroidaceae, Peptostreptococcus, Oribacterium and unclassified Veillonellaceae; all were enriched in type-II hosts as compared with type-I hosts, except Abiotrophia which was enriched in type I (Figure 4d). Most (five) of these type-II hosts associated genera were among the fifteen drivers of PC1.
Interestingly, compared with type-I hosts, those genera enriched in type-II hosts at NG and EG were also higher in relative abundance in type-II hosts at baseline. Thus, the heterogeneity of plaque microbiota among hosts may explain at least partially, either as a cause or as a consequence, the interhost phenotypic variations of gingivitis sensitivity and possibly susceptibility to disease reoccurrence in human populations.
Microbial Indices of Gingivitis
The strong correlation between PC1 and disease symptom (Mazza Gingival Index) both between subjects and within subjects thus suggested that PC1 could potentially model disease progression, and classify subjects according to their disease state. To test this hypothesis, the 50-host cohort was used as a training set for model construction, and an additional 41 human subjects with naturally occurring gingivitis were recruited and then each sampled during both NG and baseline (thus 82 additional microbiota samples were sequenced) for model validation.
(1) MiG27: We derived a ‘microbial index of gingivitis' (MiG) based on the relative abundance of the 27 bacterial markers that distinguish between the baseline stage and the gingivitis stages (NG and EG) in the 50-host cohort (MiG27; Supplementary Figure S1B; Table 3):
Table 3. Predictive models of human gingivitis based on plaque microbiota.
| Error rate | MiG27 (%) | MiG15 (%) | MiG-S (%) |
|---|---|---|---|
| Clinical status | |||
| Health versus gingivitis | 6.10 | 6.10 | — |
| Categorized status of gingivitis | |||
| Based on MGI | 41.50 | 41.50 | — |
| Based on PC1 | 24.40 | 24.40 | — |
| Gingivitis sensitivity of the host | |||
| Based on change pattern of PC1 and MGI | — | — | 26.00 |
Abbreviations: MGI, Mazza Gingival Index; MiG-S, microbial index of gingivitis sensitivity; MiG, microbial index of gingivitis; PC1, first principal component.
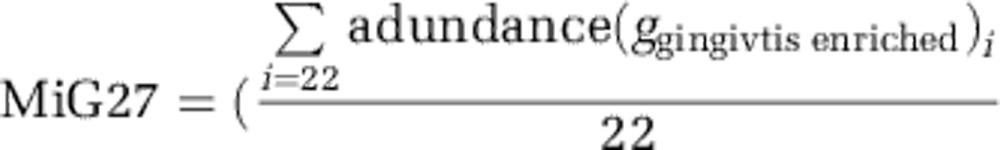 |
In the 50-host cohort, MiG27 was highly correlated with Mazza Gingival Index during the transition both from NG to baseline (P<0.001, Student's t-test) and from baseline to EG (P<0.001, Student's t-test): the area under the receiver operating characteristic curve was 99.52% (95% confidence interval (CI): 98.77−100%) for the NG to baseline transition, and 99.84% (95% CI: 99.53−100%) for the baseline to EG transition (Supplementary Figure S3A). The predictive power of MiG27 was tested by predicting the gingivitis status of the 41 hosts in the 41-host cohort using their NG microbiota. The MiG27 between NG (Mazza Gingival Index >1.18) and baseline (Mazza Gingival Index <1.12) was significantly different (P<0.001, paired t-test), for example, the top 27 samples with the highest MiG27 were all correctly classified as gingivitis (Supplementary Figure S3B). The overall accuracy of classification (based on Linear Discriminant Analysis) for diseased state versus healthy state is 94% (that is, an error rate of 6.1%) (Table 3). Thus, MiG27 might be valuable for screening for gingivitis in clinical settings.
(2) MiG15: Although MiG27 distinguishes between health and gingivitis with high accuracy, a classifier system for disease severity in gingivitis population would be useful. Thus, we derived MiG15, which was based on the relative abundance of 15 bacterial genera that drive the structural heterogeneity of microbiota along PC1 (Table 2):
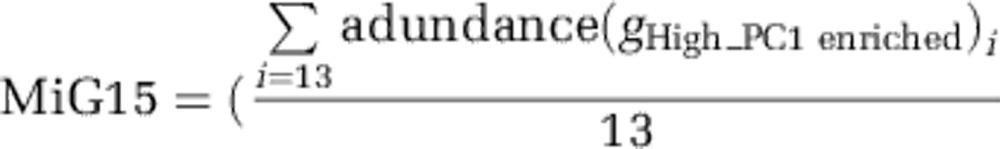 |
The MiG15 could differentiate gingivitis and health for 41 validation subjects with high accuracy as MiG27 (Figure 5a; Table 3). We then regressed the relative PC1 values (Y: the development of gingivitis) on MiG15 (X) using linear regression. The regression formula is Y=−0.97–4.62X. This revised model accounted for 60% of variance in PC1 location in the 50-host cohort. The predictive power of this model on disease severity was tested based on the microbiota during NG in the 41-host cohort. Categorization of both inferred values and test values (of PC1) into three tertiles revealed an error rate at 24.4% (Figure 5b), suggesting ∼75% classification accuracy of gingivitis severity in natural human hosts (Table 3).
Figure 5.

Trial prediction of disease outcome using Microbial Indices of gingivitis (MiGs). (a) The MiG15 indices of an additional cohort of 41 hosts. Boxes represented the interquartile range (IQR) and the lines inside represent the median. Whiskers denoted the lowest and highest values within 1.5 × IQR. The heatmap indicated the ability of MiG15 to discriminate healthy and gingivitis status of hosts. (b) Accuracy of MiG15-based prediction of disease severity in the additional cohort of 41 hosts. All samples in the test cohort were plotted on the first two principal components of the genus profile (point shape of individuals determined to have the same time point: circle: baseline; diamond: NG). Categorization of the actual and predicted PC1 values into three quantiles (blue: 1st quantile; green: 2nd quantile; brown: 3rd quantile) revealed an error rate of prediction at 24.4%. Color of each point showed its predicted PC1 value (that is, nth quantile), while color of the line connected to the point indicates its actual PC1 level (nth quantile). (c) Use of MiG-S to predict the gingivitis-sensitivity type for each host in the 50-member cohort during NG. The accuracy of MiG-S was measured by AUC, which was the area under the receiver operating characteristic (ROC) curve of plaque microbiota-based (that is, MiG-S-based) gingivitis-sensitive host-type classification. The black bars denoted the 95% CI and the blue area between the two outside curves represented the 95% CI shape. The MiG-S index was computed for each host.
(3) MiG Sensitivity (MiG-S): Furthermore, we derived a ‘microbial index of gingivitis sensitivity' (MiG-S) based on the relative abundance of the eight bacterial markers that distinguish between the type-I and type-II hosts in the 50-host cohort during NG (MiG-S; Figure 5c; Table 3):
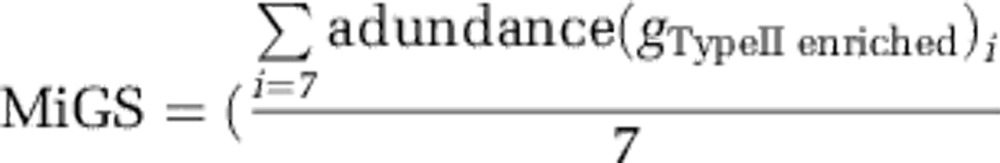 |
In the 50-host cohort, MiG-S was highly correlated with types (P<0.05, Wilcoxon rank-sum test): the area under the receiver operating characteristic curve was 74.0% (95% CI: 60.2–87.8%) (Figure 5c), suggesting a 74.0% accuracy for classifying gingivitis-sensitivity host types.
Discussion
Our retrogression–progression model of gingivitis revealed source of the heterogeneity of gingival microbiota both within subject and in natural populations. In neither case is there a clear boundary between health and disease in host or microbial attributes: their distribution, as well as retrogressive or progressive succession, was not a discrete but rather a gradient-like process. The developmental program between the healthier and the more diseased states was primarily driven by 15 bacterial genera, most of which increased in relative abundance (except two which decreased) along the development. The taxonomic shift of microbiota was accompanied by a functional shift: the observed gingivitis-enriched functions such as flagellar biosynthesis might be traced to bacterial oral mobility, as the flagellar can assist invading host tissues and escaping phagocytosis (Siqueira and Rocas, 2007). For example, Treponema, Selenomonas and Campylobacter, which were among the gingivitis biomarkers in our MiG model, were among the major donors of flagellar biosynthesis pathways in the plaque microbiota of periodontal disease (Wang et al., 2013); in fact, many species in these genera are equipped with flagella (Ruby et al., 1997; Ihara et al., 2003; Liu et al., 2010; Haya et al., 2011).
Our study also unraveled a microbial basis for the heterogeneity of disease outcome in human population. Two host types (type I and type II) with distinct sensitivity/susceptibility to gingivitis were present, with type-II hosts featuring averagely over two times more acute disease development than type-I hosts. Moreover, gingivitis recurrence appeared personalized, as the gingivitis severity (for example, Mazza Gingival Index) during EG was highly correlated with that during NG, while the disease progression rate (baseline to EG) was highly correlated with the disease retrogression rate (NG to baseline). We have identified a microbial link to the two host types, with eight bacterial taxa specifically associated (seven enriched and one depleted) with type-II hosts during each of NG, baseline and EG. However, because such association between taxa and host types actually persisted even at baseline (that is, ‘healthy' state), microbial factors likely have prominent roles in host-type formation, and it is possible that type-II hosts were predisposed to gingivitis reoccurrence due to their residential microbiota during NG. Testing whether bacterial markers during baseline might predict susceptibility to future gingivitis remains an intriguing possibility for future follow-up studies.
Uncovering these major sources of variation in gingival microbiota might have implications for the diagnosis and treatment of periodontal disease. Gingivitis can advance to periodontitis, which is a major cause of tooth loss in adults (Williams, 1990). However, the role of gingivitis in periodontitis pathogenesis remains controversial: an etiological connection between them has been postulated but not yet proved. One confounding factor has been that not all gingivitis cases proceed into periodontitis: epidemiological studies showed that ∼50% of adults have gingivitis around more than six teeth (Oliver et al., 1998), while only 15% of adults suffer from periodontitis (Oliver et al., 1991). In our identified ‘gingivitis-driver' genera, several species (for example, Tannerella forsythia, Peptostreptococcus micros (Parvimonas micra), Fusobacterium nucleatum subsp., Haemophilus paraphrophilus and Capnocytophaga sp. oral clone CZ006 et al.) were reportedly associated with periodontitis (Griffen et al., 2012; Tanner et al., 1998; Tanner et al., 2006). In addition, those potential markers of severe gingivitis we identified (for example, Tannerella, Treponema species and the TM7 phylum) were reportedly enriched in periodontitis (Griffen et al., 2012). Moreover, several potential markers of type-II hosts (for example, Selenomonas, Peptostreptococcus, unclassified Lachnospiraceae, unclassified Veillonellaceae and Oribacterium), who exhibited higher disease acuteness and susceptibility to recurrence, were also found to be enriched in periodontitis (Griffen et al., 2012). Furthermore, a recent study reported a functional link in oral microbiota between gingivitis and periodonititis patients (Wang et al., 2013).Therefore, the collective evidence supported a link between severe gingivitis and periodontitis, and also provided a possible explanation of the variation of periodontitis susceptibility in human populations.
Finally, the microbial drivers of gingivitis development and susceptibility identified here might provide novel opportunities to improve clinical practice. In gingivitis, the gingival tissue exhibited color change, contour alteration, increased sulcular exudates and bleeding upon provocation (Mariotti, 1999). On the basis of one or more of such host symptoms, current gingival indices proposed or practiced can be subjective and heavily dependent upon the human examiner's visual observation and individual judgment, leading to poor reproducibility among examiners. Moreover, because symptom of gingivitis can vary greatly among different teeth (and even probing points), manually testing two probing sites for each of the 28 teeth for each patient can be time and labor intensive. These drawbacks have collectively confounded cross-examiner and cross-patient analysis of gingivitis. In this study, we have developed and validated an alternative and likely complementary measure for gingivitis that was based on quantitative analysis of plaque microbiota. Our proposed MiG-based predictive models were able to predict diseased microbiota at 95% accuracy, distinguish different disease stages with 75% accuracy, and potentially predict disease sensitivity. With the development of sequencing technology, microbiome analysis could serve as an objective, sensitive and cost-efficient measure of gum health and gingivitis susceptibility and thus contribute to the diagnosis, prognosis and intervention of gum diseases.
The potential of human microbiota as venues in tracking and diagnosing host conditions (diseases, diets and so on) is dependent on, and limited by, the degree of heterogeneity in microbiota-condition link at the population level. In the gut, differences in the structure of the microbiota structure between hosts appear to be larger than variation associated with clinical conditions (for example, the same subjects during weight loss, or switched between a normal or high-fat diet, tend to resemble themselves over time rather than clustering with others of the same clinical state) (Turnbaugh et al., 2009; Caporaso et al., 2011; Wu et al., 2011). However, our results here revealed that the opposite appears to be true for oral microbiota: differences between healthy and diseased oral microbiota within a subject are larger than interpersonal differences, so that the same person's samples do not resemble themselves over time but instead cluster with samples from other people with the same clinical state. Although the mechanism for this difference in response sizes in microbial communities within different body habitats is unknown, our findings suggest that oral microbiota might offer advantages in providing biomarkers for oral diseases (or even systematic diseases; Koren et al., 2011).
Acknowledgments
We thank Bob Leboeuf, Jim Thompson, Duane Charbonneau, Frank Gerberick, Trevor Darcy, Rowan Grayling, Lily Sun and Yuli Song's support for this work. We thank Xiaoyan Jing and Lele Yang for technical assistance with sequencing. We appreciate Jinghua Zhang and Yiyan Yang's help on clinical parameter monitoring and sampling across the whole study. This work was funded by a Joint Research Program between Chinese Academy of Sciences and Procter & Gamble Inc., by Grants 2009AA02Z310 from Ministry of Science and Technology of China and INFO-115-D01-Z006 from Chinese Academy of Sciences, and by the Howard Hughes Medical Institute.
The authors declare no conflict of interest.
Footnotes
Supplementary Information accompanies this paper on The ISME Journal website (http://www.nature.com/ismej)
Supplementary Material
References
- Caporaso JG, Lauber CL, Costello EK, Berg-Lyons D, Gonzalez A, Stombaugh J, et al. Moving pictures of the human microbiome. Genome Biol. 2011;12:R50. doi: 10.1186/gb-2011-12-5-r50. [DOI] [PMC free article] [PubMed] [Google Scholar]
- Eick S, Pietkiewicz M, Sculean A. Oral microbiota in Swiss adolescents. Clin Oral Investig. 2013;17:79–86. doi: 10.1007/s00784-012-0696-2. [DOI] [PubMed] [Google Scholar]
- Faith JJ, McNulty NP, Rey FE, Gordon JI. Predicting a human gut microbiota's response to diet in gnotobiotic mice. Science. 2011;333:101–104. doi: 10.1126/science.1206025. [DOI] [PMC free article] [PubMed] [Google Scholar]
- Filoche S, Wong L, Sissons CH. Oral biofilms: emerging concepts in microbial ecology. J Dent Res. 2010;89:8–18. doi: 10.1177/0022034509351812. [DOI] [PubMed] [Google Scholar]
- Grant MM, Creese AJ, Barr G, Ling MR, Scott AE, Matthews JB, et al. Proteomic analysis of a noninvasive human model of acute inflammation and its resolution: the twenty-one day gingivitis model. J Proteome Res. 2010;9:4732–4744. doi: 10.1021/pr100446f. [DOI] [PMC free article] [PubMed] [Google Scholar]
- Griffen AL, Beall CJ, Campbell JH, Firestone ND, Kumar PS, Yang ZK, et al. Distinct and complex bacterial profiles in human periodontitis and health revealed by 16S pyrosequencing. ISME J. 2012;6:1176–1185. doi: 10.1038/ismej.2011.191. [DOI] [PMC free article] [PubMed] [Google Scholar]
- Haffajee AD, Socransky SS, Patel MR, Song X. Microbial complexes in supragingival plaque. Oral Microbiol Immunol. 2008;23:196–205. doi: 10.1111/j.1399-302X.2007.00411.x. [DOI] [PubMed] [Google Scholar]
- Hamady M, Lozupone C, Knight R. Fast UniFrac: facilitating high-throughput phylogenetic analyses of microbial communities including analysis of pyrosequencing and PhyloChip data. ISME J. 2010;4:17–27. doi: 10.1038/ismej.2009.97. [DOI] [PMC free article] [PubMed] [Google Scholar]
- Handfield M, Baker HV, Lamont RJ. Beyond good and evil in the oral cavity: Insights into host-microbe relationships derived from transcriptional profiling of gingival cells. J Dent Res. 2008;87:203–223. doi: 10.1177/154405910808700302. [DOI] [PMC free article] [PubMed] [Google Scholar]
- Haya S, Tokumaru Y, Abe N, Kaneko J, Aizawa S. Characterization of lateral flagella of Selenomonas ruminantium. Appl Environ Microbiol. 2011;77:2799–2802. doi: 10.1128/AEM.00286-11. [DOI] [PMC free article] [PubMed] [Google Scholar]
- Huang S, Yang F, Zeng X, Chen J, Li R, Wen T, et al. Preliminary characterization of the oral microbiota of Chinese adults with and without gingivitis. BMC Oral Health. 2011;11:33. doi: 10.1186/1472-6831-11-33. [DOI] [PMC free article] [PubMed] [Google Scholar]
- Igic M, Kesic L, Lekovic V, Apostolovic M, Mihailovic D, Kostadinovic L, et al. Chronic gingivitis: the prevalence of periodontopathogens and therapy efficiency. Eur J Clin Microbiol Infect Dis. 2012;31:1911–1915. doi: 10.1007/s10096-011-1520-7. [DOI] [PubMed] [Google Scholar]
- Ihara H, Miura T, Kato T, Ishihara K, Nakagawa T, Yamada S, et al. Detection of Campylobacter rectus in periodontitis sites by monoclonal antibodies. J Periodontal Res. 2003;38:64–72. doi: 10.1034/j.1600-0765.2003.01627.x. [DOI] [PubMed] [Google Scholar]
- Jin LJ, Armitage GC, Klinge B, Lang NP, Tonetti M, Williams RC. Global oral health inequalities: task group–periodontal disease. Adv Dent Res. 2011;23:221–226. doi: 10.1177/0022034511402080. [DOI] [PubMed] [Google Scholar]
- Kistler JO, Booth V, Bradshaw DJ, Wade WG. Bacterial community development in experimental gingivitis. PLoS One. 2013;8:e71227. doi: 10.1371/journal.pone.0071227. [DOI] [PMC free article] [PubMed] [Google Scholar]
- Knights D, Parfrey LW, Zaneveld J, Lozupone C, Knight R. Human-associated microbial signatures: examining their predictive value. Cell Host Microbe. 2011;10:292–296. doi: 10.1016/j.chom.2011.09.003. [DOI] [PMC free article] [PubMed] [Google Scholar]
- Koren O, Spor A, Felin J, Fak F, Stombaugh J, Tremaroli V, et al. Human oral, gut, and plaque microbiota in patients with atherosclerosis. Proc Natl Acad Sci USA. 2011;108 (Suppl 1:4592–4598. doi: 10.1073/pnas.1011383107. [DOI] [PMC free article] [PubMed] [Google Scholar]
- Koren O, Knights D, Gonzalez A, Waldron L, Segata N, Knight R, et al. A guide to enterotypes across the human body: meta-analysis of microbial community structures in human microbiome datasets. PLoS Comput Biol. 2013;9:e1002863. doi: 10.1371/journal.pcbi.1002863. [DOI] [PMC free article] [PubMed] [Google Scholar]
- Kornman KS. Mapping the pathogenesis of periodontitis: a new look. J Periodontol. 2008;79:1560–1568. doi: 10.1902/jop.2008.080213. [DOI] [PubMed] [Google Scholar]
- Lee A, Ghaname CB, Braun TM, Sugai JV, Teles RP, Loesche WJ, et al. Bacterial and salivary biomarkers predict the gingival inflammatory profile. J Periodontol. 2012;83:79–89. doi: 10.1902/jop.2011.110060. [DOI] [PubMed] [Google Scholar]
- Liu J, Howell JK, Bradley SD, Zheng YS, Zhou ZH, Norris SJ. Cellular architecture of treponema pallidum: novel flagellum, periplasmic cone, and cell envelope as revealed by cryo electron tomography. J Mol Biol. 2010;403:546–561. doi: 10.1016/j.jmb.2010.09.020. [DOI] [PMC free article] [PubMed] [Google Scholar]
- Loe H, Theilade E, Jensen SB. Experimental gingivitis in man. J Periodontol. 1965;36:177–187. doi: 10.1902/jop.1965.36.3.177. [DOI] [PubMed] [Google Scholar]
- Loesche W.2007Dental caries and periodontitis: contrasting two infections that have medical implications Infect Dis Clin North Am 21471–502.vii. [DOI] [PubMed] [Google Scholar]
- Lozupone CA, Stombaugh JI, Gordon JI, Jansson JK, Knight R. Diversity, stability and resilience of the human gut microbiota. Nature. 2012;489:220–230. doi: 10.1038/nature11550. [DOI] [PMC free article] [PubMed] [Google Scholar]
- Mariotti A. Dental plaque-induced gingival diseases. Ann Periodontol. 1999;4:7–19. doi: 10.1902/annals.1999.4.1.7. [DOI] [PubMed] [Google Scholar]
- Moore LVH, Moore WEC, Cato EP, Smibert RM, Burmeister JA, Best AM, et al. Bacteriology of human gingivitis. J Dent Res. 1987;66:989–995. doi: 10.1177/00220345870660052401. [DOI] [PubMed] [Google Scholar]
- Muegge BD, Kuczynski J, Knights D, Clemente JC, Gonzalez A, Fontana L, et al. Diet drives convergence in gut microbiome functions across mammalian phylogeny and within humans. Science. 2011;332:970–974. doi: 10.1126/science.1198719. [DOI] [PMC free article] [PubMed] [Google Scholar]
- Offenbacher S, Barros SP, Paquette DW, Winston JL, Biesbrock AR, Thomason RG, et al. Gingival transcriptome patterns during induction and resolution of experimental gingivitis in humans. J Periodontol. 2009;80:1963–1982. doi: 10.1902/jop.2009.080645. [DOI] [PubMed] [Google Scholar]
- Oliver RC, Brown LJ, Loe H. Variations in the prevalence and extent of periodontitis. J Am Dent Assoc. 1991;122:43–48. doi: 10.1016/s0002-8177(91)26016-x. [DOI] [PubMed] [Google Scholar]
- Oliver RC, Brown LJ, Loe H. Periodontal diseases in the United States population. J Periodontol. 1998;69:269–278. doi: 10.1902/jop.1998.69.2.269. [DOI] [PubMed] [Google Scholar]
- Petersen PE, Bourgeois D, Ogawa H, Estupinan-Day S, Ndiaye C. The global burden of oral diseases and risks to oral health. Bull World Health Organ. 2005;83:661–669. [PMC free article] [PubMed] [Google Scholar]
- Qin J, Li Y, Cai Z, Li S, Zhu J, Zhang F, et al. A metagenome-wide association study of gut microbiota in type 2 diabetes. Nature. 2012;490:55–60. doi: 10.1038/nature11450. [DOI] [PubMed] [Google Scholar]
- Ramseier CA, Kinney JS, Herr AE, Braun T, Sugai JV, Shelburne CA, et al. Identification of pathogen and host-response markers correlated with periodontal disease. J Periodontol. 2009;80:436–446. doi: 10.1902/jop.2009.080480. [DOI] [PMC free article] [PubMed] [Google Scholar]
- Ruby JD, Li H, Kuramitsu H, Norris SJ, Goldstein SF, Buttle KF, et al. Relationship of Treponema denticola periplasmic flagella to irregular cell morphology. J Bacteriol. 1997;179:1628–1635. doi: 10.1128/jb.179.5.1628-1635.1997. [DOI] [PMC free article] [PubMed] [Google Scholar]
- Savitt ED, Socransky SS. Distribution of certain subgingival microbial species in selected periodontal conditions. J Periodontal Res. 1984;19:111–123. doi: 10.1111/j.1600-0765.1984.tb00800.x. [DOI] [PubMed] [Google Scholar]
- Sharma N, Charles CH, Lynch MC, Qaqish J, McGuire JA, Galustians JG, et al. Adjunctive benefit of an essential oil-containing mouthrinse in reducing plaque and gingivitis in patients who brush and floss regularly: a six-month study. J Am Dent Assoc. 2004;135:496–504. doi: 10.14219/jada.archive.2004.0217. [DOI] [PubMed] [Google Scholar]
- Sheiham A. Is the chemical prevention of gingivitis necessary to prevent severe periodontitis. Periodontol 2000. 1997;15:15–24. doi: 10.1111/j.1600-0757.1997.tb00100.x. [DOI] [PubMed] [Google Scholar]
- Siqueira JF, Jr, Rocas IN. Bacterial pathogenesis and mediators in apical periodontitis. Braz Dent J. 2007;18:267–280. doi: 10.1590/s0103-64402007000400001. [DOI] [PubMed] [Google Scholar]
- Socransky SS, Haffajee AD, Cugini MA, Smith C, Kent RL., Jr Microbial complexes in subgingival plaque. J Clin Periodontol. 1998;25:134–144. doi: 10.1111/j.1600-051x.1998.tb02419.x. [DOI] [PubMed] [Google Scholar]
- Tanner A, Maiden MF, Macuch PJ, Murray LL, Kent RL., Jr Microbiota of health, gingivitis, and initial periodontitis. J Clin Periodontol. 1998;25:85–98. doi: 10.1111/j.1600-051x.1998.tb02414.x. [DOI] [PubMed] [Google Scholar]
- Tanner AC, Paster BJ, Lu SC, Kanasi E, Kent R, Jr, Van Dyke T, et al. Subgingival and tongue microbiota during early periodontitis. J Dent Res. 2006;85:318–323. doi: 10.1177/154405910608500407. [DOI] [PMC free article] [PubMed] [Google Scholar]
- Tatakis DN, Trombelli L. Modulation of clinical expression of plaque-induced gingivitis. I. Background review and rationale. J Clin Periodontol. 2004;31:229–238. doi: 10.1111/j.1600-051x.2004.00477.x. [DOI] [PubMed] [Google Scholar]
- Tatusov RL, Natale DA, Garkavtsev IV, Tatusova TA, Shankavaram UT, Rao BS, et al. The COG database: new developments in phylogenetic classification of proteins from complete genomes. Nucleic Acids Res. 2001;29:22–28. doi: 10.1093/nar/29.1.22. [DOI] [PMC free article] [PubMed] [Google Scholar]
- Turnbaugh PJ, Hamady M, Yatsunenko T, Cantarel BL, Duncan A, Ley RE, et al. A core gut microbiome in obese and lean twins. Nature. 2009;457:480–484. doi: 10.1038/nature07540. [DOI] [PMC free article] [PubMed] [Google Scholar]
- van der Weijden GA, Timmerman MF, Piscaer M, Snoek I, van der Velden U, Galgut PN. Effectiveness of an electrically active brush in the removal of overnight plaque and treatment of gingivitis. J Clin Periodontol. 2002;29:699–704. doi: 10.1034/j.1600-051x.2002.290806.x. [DOI] [PubMed] [Google Scholar]
- Wang JF, Qi J, Zhao H, He S, Zhang YF, Wei SC, et al. Metagenomic sequencing reveals microbiota and its functional potential associated with periodontal disease. Sci Rep. 2013;3:1843. doi: 10.1038/srep01843. [DOI] [PMC free article] [PubMed] [Google Scholar]
- Williams RC. Periodontal disease. N Engl J Med. 1990;322:373–382. doi: 10.1056/NEJM199002083220606. [DOI] [PubMed] [Google Scholar]
- Wu GD, Chen J, Hoffmann C, Bittinger K, Chen YY, Keilbaugh SA, et al. Linking long-term dietary patterns with gut microbial enterotypes. Science. 2011;334:105–108. doi: 10.1126/science.1208344. [DOI] [PMC free article] [PubMed] [Google Scholar]
Associated Data
This section collects any data citations, data availability statements, or supplementary materials included in this article.