Abstract
Background and Objectives:
The study was undertaken with the objective to provide data on the ABO and Rh(D) blood group distribution and gene frequency across India.
Materials and Methods:
A total of 10,000 healthy blood donors donating in blood banks situated in five different geographical regions of the country (North, South, East and Center) were included in the study. ABO and Rh (D) grouping was performed on all these samples. Data on the frequency of ABO and Rh(D) blood groups was reported in simple numbers and percentages.
Results:
The study showed that O was the most common blood group (37.12%) in the country closely followed by B at 32.26%, followed by A at 22.88% while AB was the least prevalent group at 7.74%. 94.61% of the donor population was Rh positive and the rest were Rh negative. Regional variations were observed in the distribution. Using the maximum likelihood method, the frequencies of the IA, IB and IO alleles were calculated and tested according to the Hardy Weinberg law of Equilibrium. The calculated gene frequencies are 0.1653 for IA (p), 0.2254 for IB (q) and 0.6093 for IO (r). In Indian Population, O (r) records the highest value followed by B (q) and A (p); O > B > A.
Conclusion:
The study provides information about the relative distribution of various alleles in the Indian population both on a pan-India basis as well as region-wise. This vital information may be helpful in planning for future health challenges, particularly planning with regards to blood transfusion services.
Keywords: ABO, blood group, rhesus
Introduction
The ABO and Rh blood group system is the most important system in transfusion and organ transplants.[1] The ABO system derives its importance from the fact that A and B are strongly antigenic and anti A and anti B occur naturally in the plasma of persons lacking the corresponding antigen. These antibodies are capable of producing hemolysis in vivo. From the point of view of transfusion, rhesus blood group system is the second most important blood group.[2]
Apart from their importance in blood transfusion practice, ABO and Rh blood groups are useful in population genetic studies, researching population migration patterns as well as resolving certain medico-legal issues, particularly disputed parentage. The knowledge of the distribution of ABO and Rh blood groups is also essential for effective management of blood banks inventory. It is therefore important to have information on the distribution of these blood groups in any population.
Although, many studies have been conducted in various parts of India to determine the local ABO and Rh distribution, no pan-Indian study has so far been conducted to determine the country wide ABO and Rh distribution. Present study seeks to provide data on ABO and Rh-D blood group distribution across India by compiling data from five regions of the country-North, South, East, West and Center.
Materials and Methods
Coordinating center and participating center
The study was conducted at the largest blood bank and Regional Blood Transfusion Center of Uttrakhand, located at Dehradun, which was the coordinating center and represented the northern region. The other participating blood banks were from Kolkata representing the eastern region, Chennai representing the southern region, Mumbai representing the western region and Nagpur representing the central region of the country.
For the purpose of the study, the centers were selected based on the following methodology [Table 1].
Table 1.
Study centre selection

Subjects
For the purpose of the study, a total sample of 10,000 healthy blood donors donating blood to five different blood banks between July 2009 and June 2011 were randomly included in the study situated in different geographical regions of the country. Each subject was interviewed before screening for his/her particulars such as address, age and sex. Information regarding medical history including a history of previous transfusion was also obtained.
This sample was selected on the basis of the proportion of concerned zone's population to the total population of the country [Table 2].
Table 2.
Sample selection

Collection of blood samples
A total of 2 ml of blood sample was collected post donation in ethylene diamine tetra acetic acid (EDTA) vial. This vial was marked with the unique donor identification number as being used by the specific blood bank. The protocol included centrifuging this sample and separating the plasma in another EDTA tube; both carrying the same identification number. This was carried out to minimize the effect of hemolysis on grouping results that may occur during the transportation of samples. Samples at the coordinating center were not separated into red cells and plasma as they were tested on the same day and did not require transportation.
Shipping of blood samples
After ensuring proper labeling, the samples were packed with coolants and sent across in insulated thermocol boxes. The samples were sent from each blood bank in varying batches at random intervals. Each blood bank was also required to send a duly filled sample information form (SIF) mentioning all relevant details regarding the donor. The details included:
Unique ID of donor
Age
Sex
Voluntary/replacement
First time/repeat donor
ABO group
Rh group
Determination of blood groups
ABO and Rh grouping was performed for each sample on micro plates using standard procedure described in Dacie and Lewis.[3] The grouping was carried out on an automated blood grouping machine (MITIS II, Ortho Clinical Diagnostics, Rochester, US). The reagents used were anti-A, anti-B, anti-AB, anti D1, anti D2 manufactured by J. Mitra and A cells, B cells and O cells prepared in house. All anti-sera used were monoclonal reagents (the ABO monoclonal reagents are in vitro culture supernatants of hybridized immunoglobulin secreting mouse cell-lines) with a minimum titer of 1:256. Anti-D1 and anti D2 were anti-D reagents from two different manufacturers, i.e., Ortho Clinical Diagnostics and J. Mitra prepared from different antibody producing human B-lymphocyte cell lines. All reagents were subjected to quality control test including titer and avidity for each new lot used. Besides checking for appearance, test for specificity and pH of normal saline was carried out on each day of use. Cells used for reverse grouping were pooled from three different known donor samples. These were prepared on each day of use. Known samples were run as control on each day of use. All entries were double-checked by one of the authors. Data on the frequency of ABO and Rh-D blood groups was reported in simple numbers and percentages.
Allelic frequencies
Allelic frequencies were calculated under the standard assumption of Hardy Weinberg equilibrium with Ceppilini correction. This iterative method yields maximum likelihood estimates. It was assumed that:
The ABO system is determined by three alleles of a single gene, call them A, B and O.
A and B are co-dominant and both are dominant over O.
This gene is in accordance to Hardy-Weinberg frequencies in the population.
The data were a random sample from the population.
Static allele frequencies in a population across generations assume: No mutation (the alleles don’t change), no migration or emigration (no exchange of alleles between populations), infinite population size and no selective pressure for or against any genotypes.
Chi-square test for goodness of fit of observed and expected (using estimated values) phenotype numbers was also calculated.[1]
Results
Demographics
A total of 10,000 donor samples were received from the five different geographical regions of the country. Samples excluded from the study: Hemolyzed, insufficient quantity, not labeled legibly/accompanied with an inadequately filled and/absent SIF.
A total of 9686 samples were evaluated. Of these, 8697 were males and 989 were females with an average age of 27.81 years. Majority of them were voluntary donors and rest were replacement donors. 81.08 % were first time donors while 18.91% were repeat donors [Table 3].
Table 3.
Demographic profile of blood donors

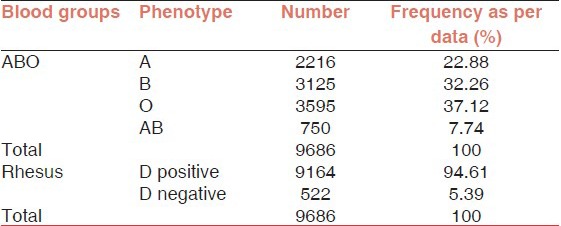
The study revealed that blood group O was the commonest (37.12%) closely followed by B at 32.26%, followed by A at 22.88% and AB was the least prevalent group at 7.74%. Out of the total donor population, 94.61% were Rh (D) positive and rest 5.39%, were Rh (D) negative [Table 4].
Table 4.
ABO and Rh (D) blood group distribution
Region wise ABO and Rh (D) group distribution
As depicted in [Figure 1] among five regions studied, O was the most prevalent group in all the regions of the country except north where B was the predominant group. The numbers and percentages for donors in various regions are given in the Table 5. Table 5 also shows that Rh (D) negative population in the five regions of the country was in the range of 4.76-7.02% and in all these regions while Rh (D) positive was in the range of 92.97-96.23%.
Figure 1.

ABO blood group distribution region wise
Table 5.
ABO and Rh (D) distribution region-wise

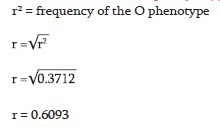
Calculation of O allele frequency IO(r)
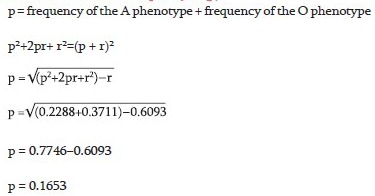
Calculation of A allele frequency IA (p)
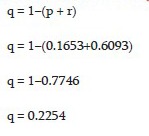
Calculation of B allele frequency IB (q)
Calculation of D allele frequency Id (u)

Calculation of D allele frequency ID (v)

Calculation of genotypic frequency
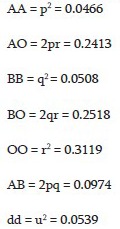
Distribution of ABO and Rh (D) allele frequency in India
Using the maximum likelihood method, the frequencies of the IA, IB and IO alleles were calculated and tested according to the Hardy Weinberg law of Equilibrium. The calculated gene frequencies are 0.1653 for IA (p), 0.2254 for IB (q) and 0.6093 for IO (r). In Indian Population, O (r) records the highest value followed by B (q) and A (p); O > B > A.
The Chi-square test for goodness of fit between the observed and expected phenotypes in case of ABO group was not found to be statistically significant (P > 0.0001) as evident from Table 6.
Table 6.
Distribution of ABO and Rh (D) Allele frequency in India
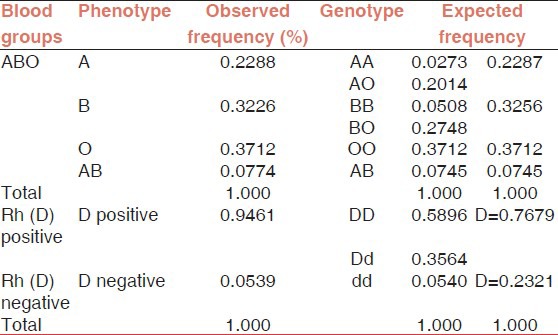
In case of Rh (D) group, the calculated gene frequencies for ID (v) = 0.7679 and for Id (v) = 0.2321. The observed Rhesus phenotype frequencies deviated significantly from the predicted frequencies of maximum-likelihood calculation (P < 0.0001) as shown in Table 6.
Discussion
ABO and Rh genes and phenotypes vary widely across races and geographical boundaries despite the fact that antigens involved are stable throughout the life. The resultant polymorphism remains important in population studies, estimating the availability of compatible blood, evaluating the probability of hemolytic disease of new born, resolving disputes of paternity, etc.
Few studies of ABO and Rh blood group prevalence amongst Indian population have been carried out, but majority of these only deal with individual communities/tribal population or are confined to a particular region of the country. The present study has representation of donors from different regions of India and hence provides a better perspective of the ABO and Rh (D) prevalence in the country. Compared to most of the other studies, which were retrospective, present study was conducted prospectively and is therefore scientifically more relevant. The present study shows O group donors to be most prevalent at 37.12%, followed by B at 32.26%, A at 22.88% and AB being lowest at 7.74%. The findings were therefore similar to that expected under the Asiatic trend of O > B > A > AB.[4]
A comparison of the findings from various studies conducted in the country is given in the Table 7.
Table 7.
Frequency of ABO group in different sub-Indian populations

The study by Nanu and Thapliyal[5] in North Indian population reports that group B was predominant. This was also reported by a study conducted in neighboring Pakistan.[9] These findings were similar to the findings in the present study when the North Indian blood donor population is referred to the study by Das et al. Studies from South India show that group O was the predominant one, followed by group B and group A, which is in agreement with the present study. The finding regarding Rh prevalence is almost similar to that reported in this study.[10] Other Indian studies conducted on the population of Chittoor District of Andhra Pradesh and National Institute of Mental Health and Neuroscience, Bengaluru showed similar pattern of distribution of blood groups.[4,11]
The study conducted by Naidu and Veeraju shows predominance of A group in Brahmin community and B group in Kammas Community of Coastal Andhra Pradesh.[12] Datta et al. observed the high incidence of group A among Lodhas tribe of West Bengal. Their findings are different from those reported in this study and the difference is because these studies were limited to individual communities/tribal population and the population under study might belong to the Proto-Australoid group, anthropologically.[13]
Bernard W investigated different native ethnic groups of Hindu Kush region of Pakistan and Afghanistan for distribution of ABO group, which revealed a relatively high frequency of blood group gene A and extremely low frequencies of gene B and O.[14] This distribution differs appreciably from that of rest of Indian subcontinent (as reported in this study).
The prevalence of Rh (D) reported in the study is very similar to that reported by Periyavan et al.[4] and Falusi et al.[15]
If the data reported from countries across the world is compared, there is an almost equal predominance of both O and B group in India and neighboring countries such as Bangladesh and Pakistan, in contrast to dominance of O and A groups in the European and African populations. The least reported group, in all these populations, has been AB [Table 8]. This comparison suggests that the heterogeneity in blood groups observed in the different populations is due to genetic and environmental factors.
Table 8.
Frequency of ABO group in different world population

The study also estimates the gene frequency of ABO and Rh (D) genes under the standard assumption of Hardy Weinberg equilibrium. It was found that while the distribution of ABO blood groups did not differ significantly from those expected under the Hardy Weinberg equilibrium, it differed significantly in case of Rhesus group. These findings were very similar to those reported by Wagner et al.[21]
In case of the Rhesus group, gene frequency has been determined only for D and d antigen, but not for other Rh group antigens (C, c, E, e). This is most likely the reason why Rh group distribution differs significantly from that expected under Hardy Weinberg equilibrium. It is therefore suggested that further study be undertaken to determine gene frequency of other Rh group antigens [Table 9].
Table 9.
Frequency of Rh (D) group in different world population

Conclusion
It is possibly the only multicentric prospective study of the country providing information about the ABO and Rh (D) group frequency distribution on a national as well as regional basis. This vital information promises help in planning for blood transfusion related future health challenges.
This study could be further extended to include other blood group antigens and would help in developing India-specific reagent cell-panels for antibody screening and identification, which would further aid in the improvement of transfusion services in the country.
Limitations of the study
Sampling was purposive as per center willingness to participate in the study.
Zone wise blood donation data was not available; sample distribution was decided according to population of particular zone with respect to total population of the country.
Footnotes
Source of Support: Nil
Conflicting Interest: None declared
References
- 1.Roback JD, editor. 17th ed. USA: American Association of Blood Banks; 2011. Technical Manual. [Google Scholar]
- 2.Mollison PL. 6th ed. Oxford, UK: Blackwell Scientific Publication; 1979. Blood Transfusion in Clinical Medicine; pp. 239–666. [Google Scholar]
- 3.Lewis SM, Bain JB, Imelda B. 9th ed. Livingstone: Churchill; 2001. Dacie and Lewis Practical Haematology; pp. 483–503. [Google Scholar]
- 4.Periyavan S, Sangeetha SK, Marimuthu P, Manjunath BK, Seema DM. Distribution of ABO and Rhesus-D blood groups in and around Bangalore. Asian J Transfus Sci. 2010;4:41. doi: 10.4103/0973-6247.59391. [DOI] [PMC free article] [PubMed] [Google Scholar]
- 5.Nanu A, Thapliyal RM. Blood group gene frequency in a selected north Indian population. Indian J Med Res. 1997;106:242–6. [PubMed] [Google Scholar]
- 6.Latoo JA, Masoodi NA, Bhat NA, Khan GQ, Kadla SA. The ABO and Rh blood groups in Kashmiri population. Indian J for the Practicing Doctor. 2005;3(2) 2006-5-2006-6. [Google Scholar]
- 7.Chavhan, Aravind Allelic Frequency of ABO And Rh D Blood Group Among The Banjara Caste Population of Akola District, Maharashtra, India. 2011. Available from Nature Precedings http://dx.doi.org/10.1038/npre.2011.5771.1 .
- 8.Abhishek B, Maya devi S, Meena D, Usha KC. Distribution of ABO and Rhesus-D blood groups in and around Thiruvnthapuram. Kerala Med J. 2011;1:28–9. [Google Scholar]
- 9.Afzal M, Ziaur-Rehman, Hussain F, Siddiqi R. A survey of blood groups. J Pak Med Assoc. 1977;27:426–8. [PubMed] [Google Scholar]
- 10.Das PK, Nair SC, Harris VK, Rose D, Mammen JJ, Bose YN, et al. Distribution of ABO and Rh-D blood groups among blood donors in a tertiary care centre in South India. Trop Doct. 2001;31:47–8. doi: 10.1177/004947550103100121. [DOI] [PubMed] [Google Scholar]
- 11.Reddy KS, Sudha G. ABO and Rh blood groups among the Desuri Reddis of Chittur district, Andhra Pradesh. Anthropol. 2009;11:237–8. [Google Scholar]
- 12.Naidu JM, Veerraju P. Blood groups among Brahmin and Kamma caste populations of Coastal Andhra Pradesh. Am J Phys Anthropol. 1982;58:197–9. doi: 10.1002/ajpa.1330580212. [DOI] [PubMed] [Google Scholar]
- 13.Datta UK, Mondal S, Mukherjee S. A study of the distribution of ABO and Rh(D) blood groups amongst Lodha tribe in Midnapore district of West Bengal. J Indian Med Assoc. 1997;95:497–8. 506. [PubMed] [Google Scholar]
- 14.Bernhard W. Distribution of ABO blood groups and incidence of Rh factor (D) in various ethnic groups in the Hindu Kush region (Kafirs, Kalash Chitrali) Anthropol Anz. 1980;37:251–65. [PubMed] [Google Scholar]
- 15.Falusi AG, Ademowo OG, Latunji CA, Okeke AC, Olatunji PO, Onyekwere TO, et al. Distribution of ABO and RH genes in Nigeria. Afr J Med Med Sci. 2000;29:23–6. [PubMed] [Google Scholar]
- 16.Boyd WC, Boyd LG. The blood groups and types of the Ramah Navaho. Am J Phys Anthropol. 1949;7:569–74. doi: 10.1002/ajpa.1330070411. [DOI] [PubMed] [Google Scholar]
- 17.Beinab MA, Talib RA, Lulu A, Al-Nuaim A, Mohsen AF, El-Hazini A, et al. Blood groups in saudi obstetric patients. Saudi Med J. 1998;19(3) [PubMed] [Google Scholar]
- 18.Anees M, Jawad A, Hashmi I. Distribution of ABO and rh blood group alleles in Mandi Bahauddin district of Punjab, Pakistan Proc. Pakistan Acad Sci. 2007;44:289–94. [Google Scholar]
- 19.Lyko J, Gaertner H, Kaviti JN, Kariithi MW, Akoto B. Blood-group systems ABO and RH in the Kenyan population. Folia Med Cracov. 1992;33:85–92. [PubMed] [Google Scholar]
- 20.Tauszik T. Heterogeneity in the distribution of ABO blood groups in Hungary. Gene Geogr. 1995;9:169–76. [PubMed] [Google Scholar]
- 21.Wagner FF, Kasulke D, Kerowgan M, Flegel WA. Frequencies of the blood groups ABO, Rhesus, D category VI, Kell, and of clinically relevant high-frequency antigens in south-western Germany. Infusionsther Transfusionsmed. 1995;22:285–90. doi: 10.1159/000223144. [DOI] [PubMed] [Google Scholar]


