Abstract
Identifying disease genes is one of the most important topics in biomedicine and may facilitate studies on the mechanisms underlying disease. Age-related macular degeneration (AMD) is a serious eye disease; it typically affects older adults and results in a loss of vision due to retina damage. In this study, we attempt to develop an effective method for distinguishing AMD-related genes. Gene ontology and KEGG enrichment analyses of known AMD-related genes were performed, and a classification system was established. In detail, each gene was encoded into a vector by extracting enrichment scores of the gene set, including it and its direct neighbors in STRING, and gene ontology terms or KEGG pathways. Then certain feature-selection methods, including minimum redundancy maximum relevance and incremental feature selection, were adopted to extract key features for the classification system. As a result, 720 GO terms and 11 KEGG pathways were deemed the most important factors for predicting AMD-related genes.
1. Introduction
Age-related macular degeneration (AMD or ARMD) is a chronic, progressive eye disorder that primarily occurs in elders (>50 years) and has become a major cause of blindness and visual impairment in developed countries as well as the third major cause globally [1, 2]. In an Asian population aged 40–79 years, the morbidities of early and late AMD were 6.8% and 0.56%, respectively [3]. Further, AMD is likely to increase with a longer life expectancy. Due to retina damage, AMD typically results in vision loss, which can render daily activities difficult, such as reading, watching TV, and recognizing faces [4]. There are two typical types of AMD: dry AMD and wet AMD. Dry AMD is the major type of AMD and accounts for approximately 80% of cases; no efficient surgical or medical treatments are available. It typically causes mild vision loss, which develops slowly. However, it can cause vision loss through retinal pigment epithelial layer atrophy, which results in photoreceptor loss (rods and cones) in the central portion of the eye. Wet AMD is caused by choroidal neovascularization (CNV), wherein new blood vessels grow in choriocapillaries through the Bruch's membrane. Leaking and bleeding of these vessels can damage the rods and cones, which lead to rapidly deteriorating vision. Thus, wet AMD accounts for 90% of AMD cases with severe visual impairment.
The AMD etiology is complex. AMD results from both genetic and environmental factors; however, the underlying mechanisms are unclear. Moreover, previous studies have demonstrated strong correlations between AMD and multiple environmental factors. In addition to age, many risk factors are correlated with AMD, such as cigarette smoking [5], oxidative stress [6–8], hypertension, previous cataract surgery, higher body mass index, a history of cardiovascular disease, and higher plasma fibrinogen [9].
AMD is characterized by complex traits. Moreover, mutant protein expression may begin early in AMD patients, and symptoms associated with AMD do not manifest until a long time thereafter. Often only clinical information for a single generation is available for studies; thus, it is difficult to detect AMD phenotypic heterogeneity and determine the underlying mechanisms. Initially, through early linkage studies on small families, several genetic loci at chromosomes 9p24, 10q26, and 15q21 [10] and 1q31, 10q26, and 17q25 [11] were identified and verified. A GWAS study greatly increased our understanding of AMD risk loci. Subsequently, more AMD-related genes have been identified, such as C2 [12], CFH [13], CFI [14], LIPC [15], CETP, TIMP3 [16], and TNFRSF10A [17]. Recently a large-scale GWAS analysis of more than 17,000 AMD cases indicated 19 other AMD loci, in which 7 loci were novel and near the genes IER3-DDR1, COL8A1-FILIP1L, SLC16A8, TGFBR1, ADAMTS9, RAD51B, and B3GALTL [18]. Several studies have evaluated the impact of susceptibility genes on AMD onset and progression. For instance, CFH gene mutations yield a high risk of AMD. Compared with the normal homozygous genotype, individuals with heterozygotic and homozygotic CFH exhibited a 4.6-fold or 7.4-fold increased AMD risk, respectively [19].
AMD is a disease with complex inheritance patterns, and it may be difficult to discover individual susceptibility genes due to multiple genetic and environmental effects and interactions. Identifying several genetic loci revealed that several important biological pathways are involved in AMD pathogenesis, such as the cholesterol, lipid metabolism pathway, complement pathway, extracellular matrix pathway, oxidative stress pathway, and angiogenesis signaling pathway in [20–22], which provides a foundation for systematically analyzing the biological processes underlying AMD. Gene ontology (GO) is a major bioinformatics tool that standardizes representation and the product attributes of genes across species [23]. The Kyoto Encyclopedia of Genes and Genomes (KEGG) [24, 25] pathway database is a collection of manually drawn diagrams and comprehensive inferences for pathway mapping. Based on the gene ontology and KEGG pathway materials, we analyzed the GO and KEGG enrichments for known AMD-related genes, which were retrieved from the Retina International website (http://www.retina-international.org/files/sci-news/remacdy.htm) or the published literature. To extract the distinctive features of these genes, certain genes, which were not reported as AMD-related genes, were randomly selected from Ensemble. Each investigated gene was encoded into numeric vectors consisting of enrichment scores of the gene set, including it and its direct neighbors in STRING, and the GO terms or KEGG pathways. Based on certain feature-selection methods and SMO as the prediction engine, certain important GO terms and KEGG pathways were discovered that were deemed important for identifying AMD-related genes. Analyses suggest that certain such genes relate directly or indirectly to AMD formation or development.
2. Materials and Methods
2.1. Dataset
The known AMD-related genes were retrieved from the Retina International website (http://www.retina-international.org/files/sci-news/remacdy.htm, recent update from March 24, 2010) and the literature. Specifically, 16 genes are from Retina International; three genes for the complement system proteins factor H (CFH), factor 3 (C3), and factor B (CFB), which are strongly related with a person's risk for developing AMD, are employed; HTRA1 is from [26, 27]; ABCR is from [28]; 2 genes are from [29, 30]; and 23 genes are from [18]. Finally, 39 known AMD-related genes were collected; these genes are referred to as “positive genes” and compose the gene set S p. To analyze the differences between the positive genes and other genes, we randomly selected 1,950 genes (50 times the number of positive genes) from Ensemble that were not in S p; these 1,950 genes are referred to as “negative genes” and compose the set S n. The Ensemble IDs for the positive and negative genes are in Supplementary Material I available online at http://dx.doi.org/10.1155/2014/450386.
The negative genes outnumbered the positive genes; thus, we confronted an imbalanced dataset. Encouraged by certain studies that have managed this type of data [31, 32], the following strategy was adopted. The negative genes were equally and randomly split into 10 portions S n 1, S n 2,…, S n 10 (i.e., S n = S n 1 ∪ S n 2 ∪ ⋯∪S n 10 and S n i∩S n j = ϕ for i ≠ j). For each S n i, we combined the genes in S p and S n i to comprise the ith datasets D i (i.e., D i = S n i ∪ S p).
2.2. Feature Construction
To analyze the differences between the positive and negative genes, each gene must be represented by certain features that can then be processed by certain computer programs. Here, we adopted gene ontology (GO) and KEGG enrichment to compute numerical values that represent each gene.
GO enrichment indicates the relationship between genes and GO terms. For each gene g and each GO term GOj, a score is generated, which is typically referred to as the gene ontology enrichment score and defined as the −log10 of the hypergeometric test P value [33–35] for a gene set G consisting of g's direct neighbors in STRING and the GO term GOj that can be computed as follows:
| (1) |
where N denotes the overall number of proteins in humans, M denotes the number of proteins annotated in the gene ontology term GOj, n denotes the number of proteins in G, and m denotes the number of proteins in G that are annotated in the gene ontology term GOj. If the score is large for one gene and one GO term, the gene and GO term likely have a strong relationship; there were 12,877 gene ontology enrichment scores.
Similarly, for each gene g and each KEGG pathway P j, the KEGG enrichment score is defined as the −log10 of the hypergeometric test P value [35, 36] for a gene set G that consists of g's direct neighbors in STRING and the KEGG pathway P j, which can be calculated as follows:
| (2) |
where N denotes the overall number of proteins in humans, M denotes the number of proteins annotated in the KEGG pathway P j, n denotes the number of proteins in G, and m denotes the number of proteins in G that are annotated in the KEGG pathway P j. Additionally, a higher KEGG enrichment score between g and P j indicates a stronger relationship; 239 features were KEGG enrichment scores.
Accordingly, each gene g can be represented by 12,877 gene ontology enrichment scores and 239 KEGG enrichment scores, which can be formulated as follows:
| (3) |
2.3. Prediction Method and Accuracy Measurement
Weka [37] is a collection of many state-of-the-art machine-learning algorithms and has been used to solve various biological problems [38–42]. One classifier, which is referred to as SMO, was adopted herein as the classification method; it implements John Platt's sequential minimal optimization algorithm to solve the optimization problem that should be settled during training of a support vector classifier. The kernel function can be polynomial or Gaussian [43, 44].
The predicted results for a two-class classification problem can be represented by a confusion matrix consisting of four entries: a true positive (TP), a true negative (TN), false positives (FP), and a false negative (FN) [45, 46]. Accordingly, the prediction accuracy (ACC), specificity (SP), and sensitivity (SN) can be computed as follows:
| (4) |
However, in each dataset D i, the number of negative genes was 5 times as many as the number of positive genes, which is still imbalanced. Thus, an additional measurement, Matthews's correlation coefficient (MCC) [47], was employed to solve the problem; the coefficient can be computed as follows:
| (5) |
2.4. 10-Fold Cross Validation
Ten-fold cross validation is often used to examine the performance of various classification models [48]. In 10-fold cross validation, the dataset is equally and randomly divided into ten portions. Each portion is used as testing data, and the samples in the remaining nine portions compose the training dataset. Each sample is tested once because each portion is tested once. Compared with the Jackknife test [49, 50], a 10-fold cross-validation test is more efficient and provides similar results for a given dataset. Thus, it was adopted herein to examine the classification model.
2.5. Feature Selection
As described in Section 2.2, each gene is represented by 12,877 + 239 = 13,116 enrichment scores. To analyze these features and extract key features that contribute the most to the positive and negative gene classification, certain feature-selection methods were employed. This procedure included two stages: (1) using Cramer's coefficient [51, 52] to exclude nonsignificant features and (2) using the minimum redundancy maximum relevance (mRMR) method as well as incremental feature selection (IFS) [53] for additional selection.
Cramer's coefficient [51, 52] is a statistical measure of two variables that was derived from the Pearson Chi-square test [54]; it ranges from 0 to 1. A high Cramer's coefficient for two variables indicates a strong association. Here, for each feature and samples' class labels, Cramer's coefficient was calculated, and features with a Cramer's coefficient lower than 0.1 were excluded.
The remaining features were further refined using the minimum redundancy maximum relevance (mRMR) method and incremental feature selection (IFS), which are feature selection methods that have been widely used in recent years [34, 55–58]. By evaluating a classification model, key features can be extracted from a complicated biological system. The mRMR method has two criteria: max-relevance and min-redundancy. Accordingly, two feature lists can be generated using this method: (1) the MaxRel feature list and (2) the mRMR feature list. Specifically, the former list sorts features according to their contributions to the classification (i.e., only considering the criterion of max-relevance), while the latter list sorts features by considering both the max-relevance and min-redundancy criteria. The MaxRel and mRMR features lists were formulated as follows:
| (6) |
where N denotes the total number of features. A detailed description of the mRMR method can be found in Peng et al.'s paper [53].
Only the mRMR features list was used to extract key features. The extraction procedure is described as follows.
For the mRMR features list F m, construct N feature set, say F m 1, F m 2,…, F m N, such that F m i = [f 1 m, f 2 m,…, f i m] (1 ≤ i ≤ N) (i.e., F m i contained the first i features in F m).
The classifier SMO was evaluated through 10-fold cross validation using features in F m i. As described in Section 2.3, ACC, SP, SN and MCC can be obtained.
The feature set with the maximum MCC is deemed the optimal feature set. For ease in observation, an IFS-curve can be plotted with MCC values as the y-axis and the superscript i of F m i as the x-axis.
3. Results and Discussion
3.1. Results of the First Stage of Feature Selection
For each of the 10 datasets D 1, D 2,…, D 10, Cramer's coefficients of the features and samples' class labels were calculated. Accordingly, features with Cramer's coefficients less than 0.1 were excluded, while the remaining features were processed further. The number of remaining features in each dataset is listed in Table 1.
Table 1.
The number of remaining features for each dataset after the first stage of feature selection.
| Dataset | Number of remaining features |
|---|---|
| D 1 | 4,288 |
| D 2 | 3,919 |
| D 3 | 4,549 |
| D 4 | 4,663 |
| D 5 | 4,371 |
| D 6 | 5,012 |
| D 7 | 4,877 |
| D 8 | 3,787 |
| D 9 | 4,701 |
| D 10 | 4,473 |
3.2. Results of the Second Stage of Feature Selection
For each dataset D i, the mRMR, IFS, and SMO methods were used to process the remaining features. The mRMR program was retrieved from http://research.janelia.org/peng/proj/mRMR/ and was executed with its default parameters. As a result, we generated two feature lists: the MaxRel and mRMR features lists. To reduce the computation time, only the first 500 features in each of the two feature lists were obtained, and they are available in Supplementary Material II.
The IFS and SMO methods were used in accordance with the mRMR features list for each dataset D i evaluated using 10-fold cross validation. The SNs, SPs, ACCs, and MCCs obtained for each dataset D i are available in Supplementary Material III. For clarity, we plotted an IFS-curve for each dataset D i, which is referred to as IFS-curve-D i. The five IFS-curves for D 1, D 2, D 3, D 4, and D 5 are shown in Figure 1(a), while the other five IFS-curves for D 6, D 7, D 8, D 9, and D 10 are shown in Figure 1(b); the ten IFS-curves that are plotted in separate coordinates are available in Supplementary Material IV. Generating the maximum MCC for each dataset from Supplementary Material III and IV (listed in column 3 of Table 2) was a straightforward process. Clearly, most MCCs are in the range 0.7 to 0.8, and the mean value was 0.76139. As mentioned in Section 2.5, the features used to obtain the maximum MCC compose the optimal feature set. The number of features in the optimal feature set for each dataset is listed in column 2 of Table 2. The results for dataset D 1 are described as follows. The maximum MCC for the dataset D 1 is 0.712699 (listed in row 2 and column 3 of Table 2) using the first 344 (listed in row 2 and column 2 of Table 2) features in the mRMR features list of dataset D 1 (see Supplementary Material II).
Figure 1.
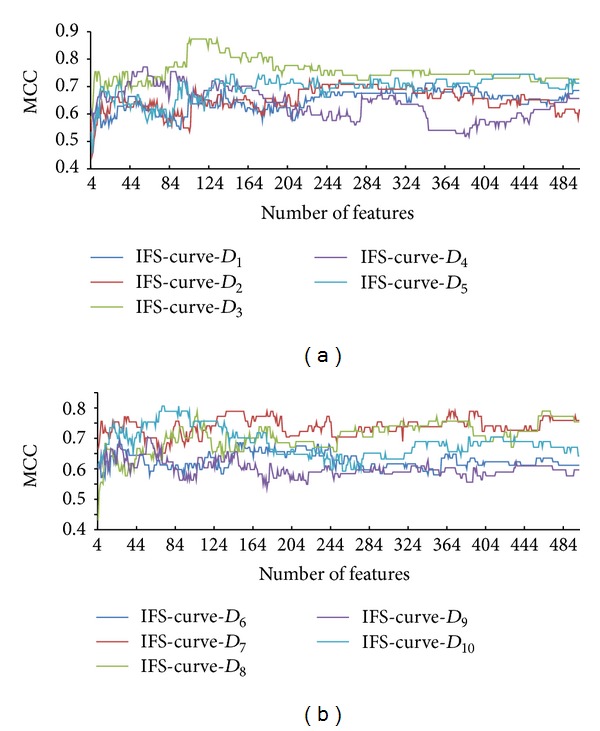
IFS-curve for each dataset. Specifically, (a) shows the IFS-curves for the datasets D 1, D 2, D 3, D 4, and D 5, while (b) shows the IFS-curves for the datasets D 6, D 7, D 8, D 9, and D 10. The y-axis represents Matthews's correlation coefficient (MCC), and the x-axis represents the number of features involved in the classification model.
Table 2.
The number of features in the optimal feature set for each dataset and the MCC value obtained using these features.
| Dataset | Number of features in the optimal feature set | Maximum MCC value |
|---|---|---|
| D 1 | 344 | 0.712699 |
| D 2 | 226 | 0.723116 |
| D 3 | 104 | 0.873086 |
| D 4 | 57 | 0.77142 |
| D 5 | 146 | 0.744851 |
| D 6 | 26 | 0.699118 |
| D 7 | 136 | 0.788893 |
| D 8 | 462 | 0.789865 |
| D 9 | 55 | 0.704687 |
| D 10 | 70 | 0.806162 |
|
| ||
| Mean | 0.76139 | |
3.3. Analysis of the Optimal Feature Set
As mentioned in Section 3.2, we generated an optimal feature set for each dataset, thereby obtaining 10 optimal feature sets. We combined these optimal feature sets to compose the final optimal feature set, which includes 720 GO terms and 11 KEGG pathways that are available in Supplementary Material V. To discern the distribution of these 731 optimal features, we counted the number of optimal feature sets containing each of 731 features. Figure 2 shows the number of features against the number of optimal feature sets, from which we can see that 400 features were exactly contained in one optimal feature set, 131 features were exactly contained in two optimal feature sets, while others were contained in at least three optimal feature sets. Accordingly, 45.28% (331/731) features were contained in at least two optimal feature sets, indicating that different datasets may induce some common features. It also suggested that some important features for distinguishing AMD-related genes were contained in the final optimal feature set. In the following sections, features in the final optimal feature set were discussed.
Figure 2.
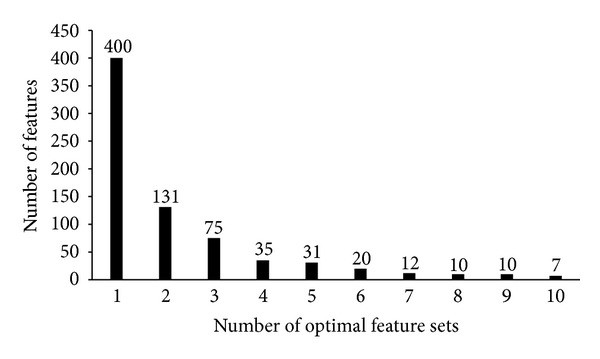
The number of features against the number of optimal feature sets.
3.3.1. GO Number and Percentage
It is known that GO terms can be divided into the following three types: (1) biological process (BP) GO term, (2) cellular component (CC) GO term, and (3) molecular function (MF) GO term. To efficiently discern the biological meanings and characterize the functional essentiality of the GO terms in the final optimal feature set, we considered the children terms of the aforementioned three types. For clarity, let S o be the 720 GO terms in the final optimal feature set and S be the children terms of any children term of BP GO term, CC GO term, or MF GO term. To display the distribution of the GO terms in S o, we calculated the frequency and percentage for each children term of BP GO term, CC GO term, or MF GO term which were defined as |S o∩S| and |S o∩S|/|S|, respectively. Figures 3–8 display the frequency and percentage of children terms of BP GO term, CC GO term, or MF GO term in the final optimal feature set.
Figure 3.
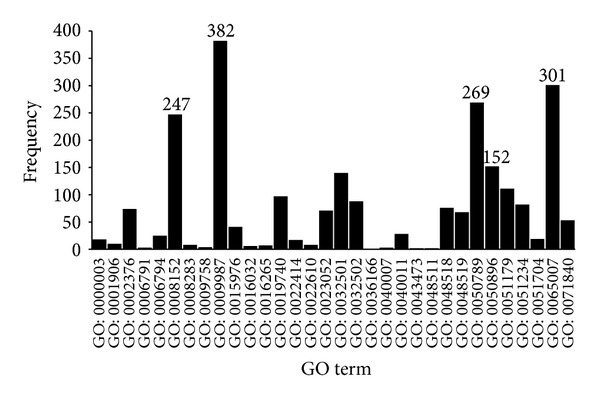
Frequency of children terms of biological process GO terms in the final optimal feature set.
Figure 8.
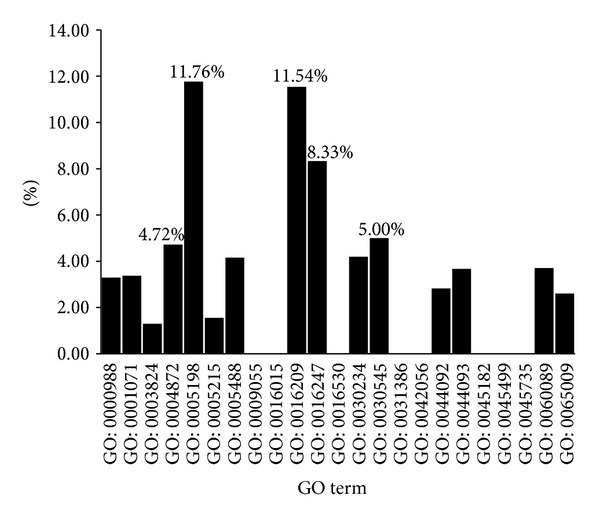
Percentage of children terms of molecular function GO terms in the final optimal feature set.
(1) BP GO Terms. In Figure 3, based on the BP term frequencies, the top five biological process terms are (I) GO: 0009987: cellular process (382); (II) GO: 0065007: biological regulation (301); (III) GO: 0050789: regulation of biological process (269); (IV) GO: 0008152: metabolic process (247); and (V) GO: 0050896: response to stimulus (152).
The top four BP terms may indicate that these biological processes are necessary to maintain normal cellular functions and may lead to AMD due to aberrant behavior in relevant cells.
“Response to stimulus” refers to any process that results from a stimulus, which leads to a change in a state or activity, such as movement and secretion.
For the BP term percentages, as shown in Figure 4, the top five biological process terms are (I) GO: 0001906: cell killing (7.25%); (II) GO: 0040011: locomotion (4.00%); (III) GO: 0002376: immune system process (3.99%); (IV) GO: 0022610: biological adhesion (3.88%), and (V) GO: 0048518: positive regulation of a biological process (2.72%).
Figure 4.
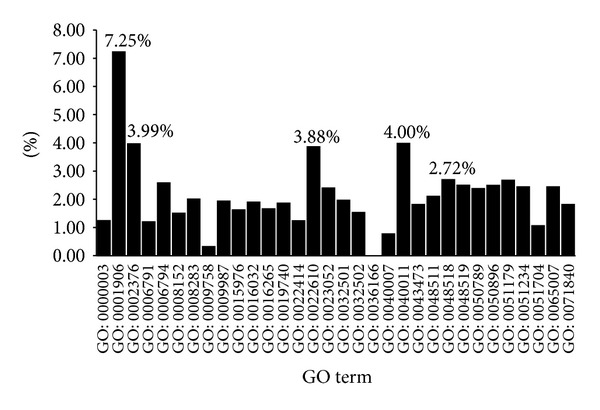
Percentage of children terms of biological process GO terms in the final optimal feature set.
Biological adhesion between substrate and cells modulates several critical cellular processes, such as cell locomotion and gene expression [59]. Biological adhesion- and locomotion-related gene dysfunction may result in AMD. Previous research has shown that the immune system, particularly the complement system, is relevant to AMD. Genetic studies also indicate that several complement-related genes, including CFH, complement component 2, complement component 3, CFHR1, and CFHR3, are highly associated with AMD [60]. Further, complement can enhance the generation of VEGF (vascular endothelial growth factor), which may strongly facilitate AMD development [61]. Histological studies show the presence of macrophages, lymphocytes, mast cells, and fibroblasts in both atrophic lesions and with retinal neovascularization [61].
(2) CC GO Terms. In Figure 5, for the cellular component GO term frequency, the top five CC terms are (I) GO: 0005623: cell (80); (II) GO: 0044464: cell part (64); (III) GO: 0032991: macromolecular complex (27); (IV) GO: 0043226: organelle (24); and (V) GO: 0005576: extracellular region (18). Cell, cell part, organelle, and macromolecular complex inclusion may be attributed to large base numbers of these GO terms.
Figure 5.
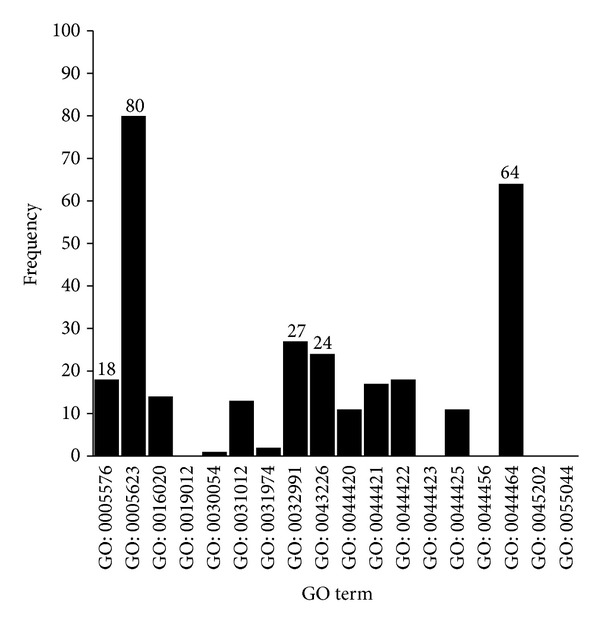
Frequency of children terms of cellular component GO terms in the final optimal feature set.
For the percentage of cellular component terms, as shown in Figure 6, the top five CC terms include (I) GO: 0044420: extracellular matrix part (14.29%); (II) GO: 0031012: extracellular matrix (13.13%); (III) GO: 0044421: extracellular region part (6.94%); (IV) GO: 0005576: extracellular region (6.74%); and (V) GO: 0005623: cell (1.96%).
Figure 6.
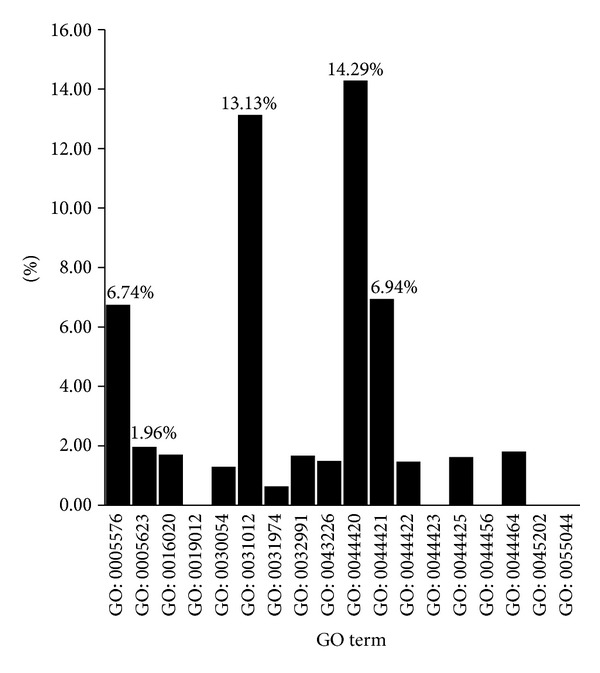
Percentage of children terms of cellular component GO terms in the final optimal feature set.
From the distribution of CC terms, except for the cell term (GO: 0005623), the top four CC terms are associated with the extracellular matrix. Moreover, the extracellular region is relevant to cell adhesion and locomotion, which were mentioned in the biological process GO terms.
The results are also consistent with a recent GWAS study, which identified several new loci with enrichment for genes involved in the extracellular matrix and other activities [18]. Structural damage of extracellular matrix in retinal cells may lead to break point of AMD [62]. Matrix metalloproteinases result in extracellular matrix degradation and are highly related to AMD pathogenesis [63]. Therefore, taken together, these facts suggest that the extracellular matrix plays an important role in AMD.
(3) MF GO Terms. In Figure 7, based on the frequency of molecular function terms, the top five MF terms are (I) GO: 0003824: catalytic activity (89); (II) GO: 0005488: binding (72); (III) GO: 0000988: protein binding transcription factor activity (34); (IV) GO: 0004872: receptor activity (34); and (V) GO: 0060089: molecular transducer activity (26).
Figure 7.
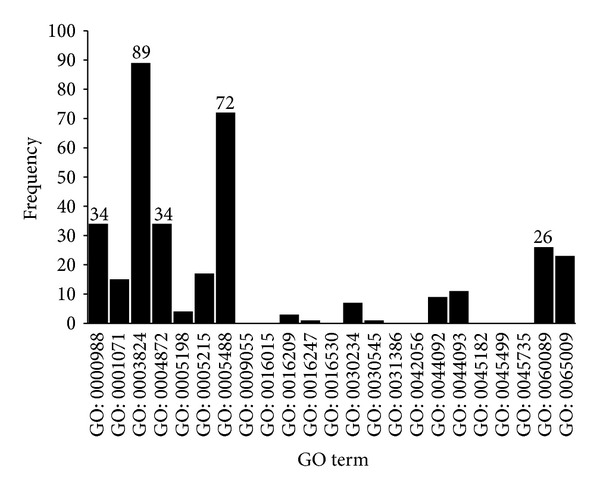
Frequency of children terms of molecular function GO terms in the final optimal feature set.
MF terms related to catalytic activity and binding were highlighted partly due to the large base numbers of these terms. However, this finding may suggest that genes assigned to these two terms are essential to maintain normal function. For example, matrix metalloproteinases, which can degrade extracellular matrix proteins, play an important role in AMD [63]. In addition, highlighting receptor activity and molecular transducer activity indicates that abnormal cellular signal pathway behaviors are involved in AMD patients. For example, the Aryl hydrocarbon receptor, which is responsible for clearing cellular debris and for toxin metabolism, is essential to maintaining normal function in RPE cells, and deficiency of this receptor causes AMD in mice [64].
For the percentage of molecular function terms, as shown in Figure 8, the top five MF terms are (I) GO: 0005198: structural molecule activity (11.76%); (II) GO: 0016209: antioxidant activity (11.54%); (III) GO: 0016247: channel regulator activity (8.33%); (IV) GO: 0030545: receptor regulator activity (5.00%); and (V) GO: 0004872: receptor activity (4.72%). To our surprise, receptor activity was highlighted in both the frequency and percentage of molecular function terms, which is further evidence of the important role that receptor activity plays in AMD. Antioxidant activity is also highlighted, and oxidative stress [6] is a risk factor correlated with AMD. Channel regulator activity and structural molecule activity may also be involved in AMD.
3.3.2. The KEGG Pathways in the Final Optimal Set
Based on the final optimal set, we obtained 11 KEGG pathways, which are (I) hsa00290 (valine, leucine, and isoleucine biosynthesis); (II) has00450 (selenocompound metabolism); (III) hsa00512 (mucin-type O-glycan biosynthesis); (IV) hsa03013 (RNA transport); (V) hsa04145 (phagosome); (VI) hsa04610 (complement and coagulation cascades); (VII) hsa04962 (vasopressin-regulated water reabsorption); (VIII) hsa05133 (pertussis); (IX) hsa05146 (viral myocarditis); and (X) hsa05150 (Staphylococcus aureus infection); and (XI) hsa05416 (viral myocarditis).
Valine, leucine, and isoleucine biosynthesis (hsa00290) and selenocompound metabolism (hsa00450) are related to amino acid metabolism. Mucin-type O-glycan biosynthesis is associated with modifications of serine or threonine residues of certain proteins. RNA transport from nucleus to cytoplasm is also essential for gene expression. These terms may not be the key factors in AMD, but they may give us suggestions about the AMD development. Phagosome (hsa04145) is also associated with AMD. There are various forms of cell death and phagocytosis in the retina [65]. But failure of retinal pigment epithelial cells and macrophages to phagocytize dying retinal pigment epithelial cells may result in drusen formation and development of AMD [66]. The underlying mechanism of AMD is still unclear, but many studies have highlighted the essential role of the immune system in the development and progression of AMD [67]. Previous studies have revealed a strong association between complement pathway and AMD [20]. Several complement genes including complement 2 (C2) and complement 3 (C3) have been strongly associated with AMD [12, 68]. Except vasopressin-regulated water reabsorption, viral myocarditis (hsa05146) and Staphylococcus aureus infection (hsa05150) are all correlated with immunity, which further emphasizes the effect of immunity in AMD.
4. Conclusions
In this study, we performed GO and KEGG enrichment analyses of AMD-related genes. The results suggest that 720 GO terms and 11 KEGG pathways are important factors that contribute to identifying AMD-related genes.
Supplementary Material
The Supplementary Material contains five files. In detail, Supplementary Material I lists 39 known AMD related genes and 1,950 randomly selected genes; Supplementary Material II lists the output of mRMR program on each dataset; Supplementary Material III lists the accuracies obtained by IFS and SMO on each dataset; Supplementary Material IV lists the IFS curve on each dataset; Supplementary Material V lists the features in the final optimal feature set.
Acknowledgments
This paper was supported by the National Basic Research Program of China (2011CB510101), Doctoral Innovation Fund of Shanghai Jiaotong University School of Medicine (BXJ201337 and BXJ201234), and National Natural Science Foundation of China (81100679, 81273424, 31371335, and 61202021).
Conflict of Interests
The authors declare that there is no conflict of interests regarding the publication of this paper.
References
- 1.Pascolini D, Mariotti SP, Pokharel GP, et al. 2002 Global update of available data on visual impairment: a compilation of population-based prevalence studies. Ophthalmic Epidemiology. 2004;11(2):67–115. doi: 10.1076/opep.11.2.67.28158. [DOI] [PubMed] [Google Scholar]
- 2.Mitchell J, Bradley C. Quality of life in age-related macular degeneration: a review of the literature. Health and Quality of Life Outcomes. 2006;4, article 97 doi: 10.1186/1477-7525-4-97. [DOI] [PMC free article] [PubMed] [Google Scholar]
- 3.Kawasaki R, Yasuda M, Song SJ, et al. The prevalence of age-related macular degeneration in Asians: a systematic review and meta-analysis. Ophthalmology. 2010;117(5):921–927. doi: 10.1016/j.ophtha.2009.10.007. [DOI] [PubMed] [Google Scholar]
- 4.Meyer-Ruesenberg B, Richard G. New insights into the underestimated impairment of quality of life in age-related macular degeneration—a review of the literature. Klinische Monatsblatter fur Augenheilkunde. 2010;227(8):646–652. doi: 10.1055/s-0029-1245118. [DOI] [PubMed] [Google Scholar]
- 5.Thornton J, Edwards R, Mitchell P, Harrison RA, Buchan I, Kelly SP. Smoking and age-related macular degeneration: a review of association. Eye. 2005;19(9):935–944. doi: 10.1038/sj.eye.6701978. [DOI] [PubMed] [Google Scholar]
- 6.Hollyfield JG, Bonilha VL, Rayborn ME, et al. Oxidative damage-induced inflammation initiates age-related macular degeneration. Nature Medicine. 2008;14(2):194–198. doi: 10.1038/nm1709. [DOI] [PMC free article] [PubMed] [Google Scholar]
- 7.Beatty S, Koh H, Phil M, Henson D, Boulton M. The role of oxidative stress in the pathogenesis of age-related macular degeneration. Survey of Ophthalmology. 2000;45(2):115–134. doi: 10.1016/s0039-6257(00)00140-5. [DOI] [PubMed] [Google Scholar]
- 8.Shen JK, Dong A, Hackett SF, Bell WR, Green WR, Campochiaro PA. Oxidative damage in age-related macular degeneration. Histology and Histopathology. 2007;22(12):1301–1308. doi: 10.14670/HH-22.1301. [DOI] [PubMed] [Google Scholar]
- 9.Chakravarthy U, Wong TY, Fletcher A, Piault E, Evans C. Clinical risk factors for age-related macular degeneration: a systematic review and meta-analysis. BMC Ophthalmology. 2010;10, article 31 doi: 10.1186/1471-2415-10-31. [DOI] [PMC free article] [PubMed] [Google Scholar]
- 10.Iyengar SK, Song D, Klein BEK, et al. Dissection of genomewide-scan data in extended families reveals a major locus and oligogenic susceptibility for age-related macular degeneration. The American Journal of Human Genetics. 2004;74(1):20–39. doi: 10.1086/380912. [DOI] [PMC free article] [PubMed] [Google Scholar]
- 11.Weeks DE, Conley YP, Tsai H, et al. Age-related maculopathy: A genomewide scan with continued evidence of susceptibility loci within the 1q31, 10q26, and 17q25 regions. The American Journal of Human Genetics. 2004;75(2):174–189. doi: 10.1086/422476. [DOI] [PMC free article] [PubMed] [Google Scholar]
- 12.Gold B, Merriam JE, Zernant J, et al. Variation in factor B (BF) and complement component 2 (C2) genes is associated with age-related macular degeneration. Nature Genetics. 2006;38(4):458–462. doi: 10.1038/ng1750. [DOI] [PMC free article] [PubMed] [Google Scholar]
- 13.Edwards AO, Ritter R, III, Abel KJ, Manning A, Panhuysen C, Farrer LA. Complement factor H polymorphism and age-related macular degeneration. Science. 2005;308(5720):421–424. doi: 10.1126/science.1110189. [DOI] [PubMed] [Google Scholar]
- 14.Fagerness JA, Maller JB, Neale BM, Reynolds RC, Daly MJ, Seddon JM. Variation near complement factor I is associated with risk of advanced AMD. European Journal of Human Genetics. 2009;17(1):100–104. doi: 10.1038/ejhg.2008.140. [DOI] [PMC free article] [PubMed] [Google Scholar]
- 15.Neale BM, Fagerness J, Reynolds R, et al. Genome-wide association study of advanced age-related macular degeneration identifies a role of the hepatic lipase gene (LIPC) Proceedings of the National Academy of Sciences of the United States of America. 2010;107(16):7395–7400. doi: 10.1073/pnas.0912019107. [DOI] [PMC free article] [PubMed] [Google Scholar]
- 16.Chen W, Stambolian D, Edwards AO, et al. Genetic variants near TIMP3 and high-density lipoprotein-associated loci influence susceptibility to age-related macular degeneration. Proceedings of the National Academy of Sciences of the United States of America. 2010;107(16):7401–7406. doi: 10.1073/pnas.0912702107. [DOI] [PMC free article] [PubMed] [Google Scholar]
- 17.Arakawa S, Takahashi A, Ashikawa K, et al. Genome-wide association study identifies two susceptibility loci for exudative age-related macular degeneration in the Japanese population. Nature Genetics. 2011;43(10):1001–1004. doi: 10.1038/ng.938. [DOI] [PubMed] [Google Scholar]
- 18.Fritsche LG, Chen W, Schu M, et al. Seven new loci associated with age-related macular degeneration. Nature Genetics. 2013;45:433–439. doi: 10.1038/ng.2578. [DOI] [PMC free article] [PubMed] [Google Scholar]
- 19.Klein RJ, Zeiss C, Chew EY, et al. Complement factor H polymorphism in age-related macular degeneration. Science. 2005;308(5720):385–389. doi: 10.1126/science.1109557. [DOI] [PMC free article] [PubMed] [Google Scholar]
- 20.Swaroop A, Chew EY, Rickman CB, Abecasis GR. Unraveling a multifactorial late-onset disease: from genetic susceptibility to disease mechanisms for age-related macular degeneration. Annual Review of Genomics and Human Genetics. 2009;10:19–43. doi: 10.1146/annurev.genom.9.081307.164350. [DOI] [PMC free article] [PubMed] [Google Scholar]
- 21.Gorin MB. Genetic insights into age-related macular degeneration: controversies addressing risk, causality, and therapeutics. Molecular Aspects of Medicine. 2012;33(4):467–486. doi: 10.1016/j.mam.2012.04.004. [DOI] [PMC free article] [PubMed] [Google Scholar]
- 22.Priya RR, Chew EY, Swaroop A. Genetic studies of age-related macular degeneration: lessons, challenges, and opportunities for disease management. Ophthalmology. 2012;119(12):2526–2536. doi: 10.1016/j.ophtha.2012.06.042. [DOI] [PMC free article] [PubMed] [Google Scholar]
- 23.Consortium GO. The gene ontology (GO) project in 2006. Nucleic Acids Research. 2006;34:D322–D326. doi: 10.1093/nar/gkj021. [DOI] [PMC free article] [PubMed] [Google Scholar]
- 24.Kanehisa M, Goto S. KEGG: kyoto encyclopedia of genes and genomes. Nucleic Acids Research. 2000;28(1):27–30. doi: 10.1093/nar/28.1.27. [DOI] [PMC free article] [PubMed] [Google Scholar]
- 25.Ogata H, Goto S, Sato K, Fujibuchi W, Bono H, Kanehisa M. KEGG: kyoto encyclopedia of genes and genomes. Nucleic Acids Research. 1999;27(1):29–34. doi: 10.1093/nar/27.1.29. [DOI] [PMC free article] [PubMed] [Google Scholar]
- 26.Yang Z, Camp NJ, Sun H, et al. A variant of the HTRA1 gene increases susceptibility to age-related macular degeneration. Science. 2006;314(5801):992–993. doi: 10.1126/science.1133811. [DOI] [PubMed] [Google Scholar]
- 27.DeWan A, Liu M, Hartman S, et al. HTRA1 promoter polymorphism in wet age-related macular degeneration. Science. 2006;314(5801):989–992. doi: 10.1126/science.1133807. [DOI] [PubMed] [Google Scholar]
- 28.Dryja TP, Briggs CE, Berson EL, Rosenfeld PJ, Abitbol M. ABCR gene and age-related macular degeneration. Science. 1998;279, article 1107 [Google Scholar]
- 29.Hughes AE, Orr N, Esfandiary H, Diaz-Torres M, Goodship T, Chakravarthy U. A common CFH haplotype, with deletion of CFHR1 and CFHR3, is associated with lower risk of age-related macular degeneration. Nature Genetics. 2006;38(10):1173–1177. doi: 10.1038/ng1890. [DOI] [PubMed] [Google Scholar]
- 30.Fritsche LG, Lauer N, Hartmann A, et al. An imbalance of human complement regulatory proteins CFHR1, CFHR3 and factor H influences risk for age-related macular degeneration (AMD) Human Molecular Genetics. 2010;19(23):4694–4704. doi: 10.1093/hmg/ddq399. [DOI] [PubMed] [Google Scholar]
- 31.He Z, Huang T, Shi X, et al. Computational analysis of protein tyrosine nitration. Proceedings of the 4th International Conference on Computational Systems Biology (ISB '10); 2010; pp. 35–42. [Google Scholar]
- 32.Chen L, Qian Z, Fen K, Cai Y. Prediction of interactiveness between small molecules and enzymes by combining gene ontology and compound similarity. Journal of Computational Chemistry. 2010;31(8):1766–1776. doi: 10.1002/jcc.21467. [DOI] [PubMed] [Google Scholar]
- 33.Carmona-Saez P, Chagoyen M, Tirado F, Carazo JM, Pascual-Montano A. GENECODIS: a web-based tool for finding significant concurrent annotations in gene lists. Genome Biology. 2007;8(1, article R3) doi: 10.1186/gb-2007-8-1-r3. [DOI] [PMC free article] [PubMed] [Google Scholar]
- 34.Huang T, Chen L, Cai Y, Chou K. Classification and analysis of regulatory pathways using graph property, biochemical and physicochemical property, and functional property. PLoS ONE. 2011;6(9) doi: 10.1371/journal.pone.0025297.e25297 [DOI] [PMC free article] [PubMed] [Google Scholar]
- 35.Huang T, Zhang J, Xu Z, et al. Deciphering the effects of gene deletion on yeast longevity using network and machine learning approaches. Biochimie. 2012;94(4):1017–1025. doi: 10.1016/j.biochi.2011.12.024. [DOI] [PubMed] [Google Scholar]
- 36.Chen L, Li B-Q, Feng K-Y. Predicting biological functions of protein complexes using graphic and functional features. Current Bioinformatics. 2013;8:545–551. [Google Scholar]
- 37.Witten IH, Frank E. Data Mining: Practical Machine Learning Tools and Techniques. Morgan Kaufmann; 2005. [Google Scholar]
- 38.Chen L, Lu L, Feng K, et al. Multiple classifier integration for the prediction of protein structural classes. Journal of Computational Chemistry. 2009;30(14):2248–2254. doi: 10.1002/jcc.21230. [DOI] [PubMed] [Google Scholar]
- 39.Li B, Feng K, Chen L, Huang T, Cai Y. Prediction of protein-protein interaction sites by random forest algorithm with mRMR and IFS. PLoS ONE. 2012;7(8) doi: 10.1371/journal.pone.0043927.e43927 [DOI] [PMC free article] [PubMed] [Google Scholar]
- 40.Shugay M, de Mendibil IO, Vizmanos JL, Novo FJ. Oncofuse: a computational framework for the prediction of the oncogenic potential of gene fusions. Bioinformatics. 2013;29:2539–2546. doi: 10.1093/bioinformatics/btt445. [DOI] [PubMed] [Google Scholar]
- 41.Holzinger A, Zupan M. KNODWAT: a scientific framework application for testing knowledge discovery methods for the biomedical domain. BMC Bioinformatics. 2013;14(1, article 91) doi: 10.1186/1471-2105-14-191. [DOI] [PMC free article] [PubMed] [Google Scholar]
- 42.Yan C, Dobbs D, Honavar V. A two-stage classifier for identification of protein-protein interface residues. Bioinformatics. 2004;20(1):i371–i378. doi: 10.1093/bioinformatics/bth920. [DOI] [PubMed] [Google Scholar]
- 43.Platt J, editor. Fast Training of Support Vector Machines Using Sequential Minimal Optimization. Cambridge, Mass, USA: MIT Press; 1998. [Google Scholar]
- 44.Keerthi SS, Shevade SK, Bhattacharyya C, Murthy KRK. Improvements to Platt's SMO algorithm for SVM classifier design. Neural Computation. 2001;13(3):637–649. [Google Scholar]
- 45.Chen L, Feng K, Cai Y, Chou K, Li H. Predicting the network of substrate-enzyme-product triads by combining compound similarity and functional domain composition. BMC Bioinformatics. 2010;11, article 293 doi: 10.1186/1471-2105-11-293. [DOI] [PMC free article] [PubMed] [Google Scholar]
- 46.Baldi P , Brunak S, Chauvin Y, Andersen C, Nielsen H. Assessing the accuracy of prediction algorithms for classification: an overview. Bioinformatics. 2000;16:412–424. doi: 10.1093/bioinformatics/16.5.412. [DOI] [PubMed] [Google Scholar]
- 47.Matthews BW. Comparison of the predicted and observed secondary structure of T4 phage lysozyme. Biochimica et Biophysica Acta (BBA)-Protein Structure. 1975;405(2):442–451. doi: 10.1016/0005-2795(75)90109-9. [DOI] [PubMed] [Google Scholar]
- 48.Kohavi R. A study of cross-validation and bootstrap for accuracy estimation and model selection. Proceedings of the 14th international joint conference on Artificial intelligence (IJCAI '95) ; San Mateo, Calif, USA. pp. 1137–1143. [Google Scholar]
- 49.Chen L, Zeng W, Cai Y, Feng K, Chou K. Predicting anatomical therapeutic chemical (ATC) classification of drugs by integrating chemical-chemical interactions and similarities. PLoS ONE. 2012;7(4) doi: 10.1371/journal.pone.0035254.e35254 [DOI] [PMC free article] [PubMed] [Google Scholar]
- 50.Chen L, Lu J, Zhang N, Huang T, Cai Y-D. A hybrid method for prediction and repositioning of drug Anatomical Therapeutic Chemical classes. Molecular BioSystems. 2014;10:868–877. doi: 10.1039/c3mb70490d. [DOI] [PubMed] [Google Scholar]
- 51.Cramér H. Mathematical Methods of Statistics. Princeton University Press; 1946. [Google Scholar]
- 52.Kendall MG, Stuart A. The Advanced Theory of Statistics. Vol. 2. New York, NY, USA: Macmillan; 1973. (Inference and Relationship). [Google Scholar]
- 53.Peng H, Long F, Ding C. Feature selection based on mutual information: criteria of max-dependency, max-relevance, and min-redundanc. IEEE Transactions on Pattern Analysis and Machine Intelligence. 2005;27(8):1226–1238. doi: 10.1109/TPAMI.2005.159. [DOI] [PubMed] [Google Scholar]
- 54.Harrison KM, Kajese T, Hall HI, Song R. Risk factor redistribution of the national HIV/AIDS surveillance data: an alternative approach. Public Health Reports. 2008;123(5):618–627. doi: 10.1177/003335490812300512. [DOI] [PMC free article] [PubMed] [Google Scholar]
- 55.Chen L, Zeng W, Cai Y, Huang T. Prediction of metabolic pathway using graph property, chemical functional group and chemical structural set. Current Bioinformatics. 2013;8(2):200–207. [Google Scholar]
- 56.Zhang Y, Ding C, Li T. Gene selection algorithm by combining reliefF and mRMR. BMC Genomics. 2008;9(2, article S27) doi: 10.1186/1471-2164-9-S2-S27. [DOI] [PMC free article] [PubMed] [Google Scholar]
- 57.Zhou X, Dai Z, Zou X. Classification of G-protein coupled receptors based on support vector machine with maximum relevance minimum redundancy and genetic algorithm. BMC Bioinformatics. 2010;11, article 325 doi: 10.1186/1471-2105-11-325. [DOI] [PMC free article] [PubMed] [Google Scholar]
- 58.Lu L, Shi X, Li S, et al. Protein sumoylation sites prediction based on two-stage feature selection. Molecular Diversity. 2010;14(1):81–86. doi: 10.1007/s11030-009-9149-5. [DOI] [PubMed] [Google Scholar]
- 59.Juliano RL, Haskill S. Signal transduction from the extracellular matrix. Journal of Cell Biology. 1993;120(3):577–585. doi: 10.1083/jcb.120.3.577. [DOI] [PMC free article] [PubMed] [Google Scholar]
- 60.Anderson DH, Radeke MJ, Gallo NB, et al. The pivotal role of the complement system in aging and age-related macular degeneration: Hypothesis re-visited. Progress in Retinal and Eye Research. 2010;29(2):95–112. doi: 10.1016/j.preteyeres.2009.11.003. [DOI] [PMC free article] [PubMed] [Google Scholar]
- 61.Whitcup SM, Sodhi A, Atkinson JP, et al. The role of the immune response in age-related macular degeneration. International Journal of Inflammation. 2013;2013:10 pages. doi: 10.1155/2013/348092.348092 [DOI] [PMC free article] [PubMed] [Google Scholar]
- 62.Al-Ubaidi MR, Naash MI, Conley SM. A perspective on the role of the extracellular matrix in progressive retinal degenerative disorders. Investigative Ophthalmology & Visual Science. 2013;54:8119–8124. doi: 10.1167/iovs.13-13536. [DOI] [PMC free article] [PubMed] [Google Scholar]
- 63.Liutkeviciene R, Lesauskaite V, Sinkunaite-Marsalkiene G, et al. The role of matrix metalloproteinases polymorphisms in age-related macular degeneration. Ophthalmic Genetics. 2013 doi: 10.3109/13816810.2013.838274. [DOI] [PubMed] [Google Scholar]
- 64.Hu P, Herrmann R, Bednar A, Saloupis P, Dwyer MA. Aryl hydrocarbon receptor deficiency causes dysregulated cellular matrix metabolism and age-related macular degeneration-like pathology. Proceedings of the National Academy of Sciences. 2013;110:E4069–E4078. doi: 10.1073/pnas.1307574110. [DOI] [PMC free article] [PubMed] [Google Scholar]
- 65.Green WR, Enger C. Age-related macular degeneration histopathologic studies: the 1992 Lorenz E. Zimmerman Lecture. 1992. Retina (Philadelphia, Pa.) 2005;25(5):1519–1535. doi: 10.1097/00006982-200507001-00015. [DOI] [PubMed] [Google Scholar]
- 66.Forrester JV. Macrophages eyed in macular degeneration. Nature Medicine. 2003;9(11):1350–1351. doi: 10.1038/nm1103-1350. [DOI] [PubMed] [Google Scholar]
- 67.Ambati J, Atkinson JP, Gelfand BD. Immunology of age-related macular degeneration. Nature Reviews Immunology. 2013;13(6):438–451. doi: 10.1038/nri3459. [DOI] [PMC free article] [PubMed] [Google Scholar]
- 68.Yates JRW, Sepp T, Matharu BK, et al. Complement C3 variant and the risk of age-related macular degeneration. The New England Journal of Medicine. 2007;357(6):553–561. doi: 10.1056/NEJMoa072618. [DOI] [PubMed] [Google Scholar]
Associated Data
This section collects any data citations, data availability statements, or supplementary materials included in this article.
Supplementary Materials
The Supplementary Material contains five files. In detail, Supplementary Material I lists 39 known AMD related genes and 1,950 randomly selected genes; Supplementary Material II lists the output of mRMR program on each dataset; Supplementary Material III lists the accuracies obtained by IFS and SMO on each dataset; Supplementary Material IV lists the IFS curve on each dataset; Supplementary Material V lists the features in the final optimal feature set.


