

Background: Adipose tissue must expand in response to excess caloric intake.
Results: Insulin-like growth factor-binding protein 4 (IGFbp4) expression negatively correlates with adipose tissue growth. Insulin and IGF-1 stimulate and IGFbp4 suppresses adipose tissue expansion in an ex vivo explant model.
Conclusion: IGF-1/IGFbp4 signaling controls post-developmental adipose tissue expansion.
Significance: IGFbp4 may contribute to metabolic diseases associated with obesity.
Keywords: Adipocyte, Angiogenesis, Endothelial Cell, Insulin, Insulin-like Growth Factor (IGF), Obesity, Vascular Biology
Abstract
Adipose tissue expansion requires growth and proliferation of adipocytes and the concomitant expansion of their stromovascular network. We have used an ex vivo angiogenesis assay to study the mechanisms involved in adipose tissue expansion. In this assay, adipose tissue fragments placed under pro-angiogenic conditions form sprouts composed of endothelial, perivascular, and other proliferative cells. We find that sprouting was directly stimulated by insulin and was enhanced by prior treatment of mice with the insulin sensitizer rosiglitazone. Moreover, basal and insulin-stimulated sprouting increased progressively over 30 weeks of high fat diet feeding, correlating with tissue expansion during this period. cDNA microarrays analyzed to identify genes correlating with insulin-stimulated sprouting surprisingly revealed only four positively correlating (Fads3, Tmsb10, Depdc6, and Rasl12) and four negatively correlating (Asph, IGFbp4, Ppm1b, and Adcyap1r1) genes. Among the proteins encoded by these genes, IGFbp4, which suppresses IGF-1 signaling, has been previously implicated in angiogenesis, suggesting a role for IGF-1 in adipose tissue expandability. Indeed, IGF-1 potently stimulated sprouting, and the presence of activated IGF-1 receptors in the vasculature was revealed by immunostaining. Recombinant IGFbp4 blocked the effects of insulin and IGF-1 on mouse adipose tissue sprouting and also suppressed sprouting from human subcutaneous adipose tissue. These results reveal an important role of IGF-1/IGFbp4 signaling in post-developmental adipose tissue expansion.
Introduction
The ability of white adipose tissue to expand in response to excess calorie consumption is of great evolutionary advantage, allowing survival in times of food scarcity. Adipose tissue can reach 40% of body mass through hypertrophy of pre-existing adipocytes and through hyperplasia, which involves recruitment and differentiation of adipocyte precursors (1, 2). To support the enlarged and expanded adipocyte pool, an appropriate stromovascular network must form in parallel (3–5). It is possible that expansion of the vascular network may actually precede adipocyte growth, as is known to occur during embryonic development, when the formation of the adipose tissue vascular network precedes the emergence of adipocytes (6). Indeed, in adult mice, expansion of adipose tissue is accompanied by formation of angiogenic foci (7).
The mechanisms by which the differentiation and growth of adipocytes are coordinated with expansion of the capillary network during adulthood are largely unknown. These mechanisms, however, appear to be crucial in achieving a functional, expanded adipose tissue, as decreased capillary density in obese human adults is associated with metabolic disease (8, 9). One mechanism by which capillary growth may be stimulated is in response to local hypoxia resulting from adipocyte growth (10). Hypoxia-induced pro-angiogenic factors such as VEGF would then stimulate angiogenesis, thus enhancing blood and oxygen supply and reducing hypoxia in the expanded tissue. This possibility is supported by the finding that adipocytes can secrete numerous potent pro-angiogenic factors, some in response to hypoxia (11), and that VEGF-A expression can mitigate the development of metabolic dysfunction in response to a high fat diet (HFD)2 (12, 13). However, recent studies suggest that hypoxia of adipose tissue may not reach levels sufficient to elicit a pro-angiogenic response (14) and that expression of HIF-1α in adipocytes results in fibrosis rather than angiogenesis (15).
Alternatively, angiogenesis may also be elicited through other changes that accompany adipose tissue expansion, including infiltration by macrophages (16–18), which have been implicated in tumor angiogenesis (19, 20). Another alternative possibility is that the vasculature of adipose tissue could expand in response to metabolic signals that accompany excess caloric intake. Vascular expansion could thus precede the emergence and growth of new adipocytes, recapitulating the process of adipose tissue growth during development (6). Findings consistent with this possibility are that adipose tissue capillary walls are a niche for adipocyte progenitors (21), which share structural features with endothelial cells and pericytes (22), and undergo differentiation into adipocytes in response to peroxisome proliferator-activated receptor γ activation (23).
Studying the growth of adipose tissue under ex vivo culture conditions permits identification of signaling pathways and factors that regulate adipose tissue expansion. In this study, we have used this approach to elucidate molecular mechanisms that modulate vascular and adipocyte expansions in response to HFD.
EXPERIMENTAL PROCEDURES
Animals
Male C57BL/6J mice (The Jackson Laboratory) were housed (n = 4/cage) under 12:12-h light/dark cycles, with ad libitum access to food and water. At 5 weeks of age, they were randomly distributed into (ND) or HFD groups (Harlan Laboratories, 15 and 45% kcal from fat, respectively) and maintained on these diets for up to 30 weeks. For rosiglitazone treatment, diets were supplemented with 5 mg·kg−1·day−1 of Avandia RSG maleate (SmithKline Beecham Pharmaceuticals) for a period of 2 weeks (weeks 28–30). The University of Massachusetts Medical School Institutional Animal Care and Use Committee approved all procedures.
Human Adipose Tissue
Human adipose tissue samples were obtained from volunteers with body mass index ranging from 25 to 36. Volunteers were nondiabetic, as demonstrated by glucose tolerance test, and in good health, as shown by physical examination and standard blood work. Adipose tissue was collected from lower abdominal area by needle aspiration with a 14-g needle. Because the inner diameter of this needle is 1.6 mm, ∼1-mm fragments could be obtained without disrupting tissue architecture. Collected adipose tissue fragments were used to perform adipose tissue angiogenesis assay, as described below (9). Informed consents were required and signed before inclusion into the study, and the University of Massachusetts Medical School Institutional Review Board approved all protocols. For the analysis of IGFbp4 effects, unidentified adipose tissue that would be otherwise discarded after panniculectomy, and thus was exempted from Institutional Review Board approval, was utilized.
Ex Vivo Angiogenesis Assay of Adipose Tissue
Explants from freshly harvested mouse epididymal fat pads or human subcutaneous adipose tissue were prepared and embedded as described (24). In brief, after removal of fibrotic tissue and obvious vasculature, the tissue was cut into ∼1-mm3 pieces, which were embedded in the individual wells of standard 96-well cell culture plates containing 40 μl of growth factor-depleted Matrigel (Discovery Labware). Matrigel was allowed to polymerize at 37 °C for 30 min, after which wells were filled with 200 μl of EBM-2 media supplemented with microvascular endothelial growth factors (EGM-2 MV) (Lonza), and half of the media was replaced every 2nd day. In some experiments human recombinant IGFbp4 (RD Systems; 0.5 μg/ml) was added to the medium. Approximately 30 explant pieces from each mouse or human subject were embedded for each treatment condition and averaged for the analysis. The number of explants displaying any degree of sprouting was recorded, and the number of branches (defined as a minimum of three cells forming a branch structure) sprouting around the periphery of explants was counted at day 14 in culture, at ×100 magnification, by two independent investigators. In experiments comparing insulin, IGF-1 and IGF-2 action, three-dimensional images of each well were captured using an automated microscopy system as described (24), and the area of growth surrounding each explant was quantified using automated image analysis protocols. IGF-1 and IGF-2 were obtained from Creative BioMart and used at concentrations indicated in Fig. 8A.
FIGURE 8.

Effect of IGF-1 on sprout formation. A, effects of insulin, IGF-1 and IGF-2, and of IGFbp4 on the percent of explants displaying capillary sprouts after 14 days in culture. Statistical significance of the difference from no treatment was calculated by one-way analysis of variance corrected for multiple comparisons (Holm-Sidak). **, p < 0.005; ****, p < 0.0001. B, Western blotting for IGF-1 receptor (top panel) and insulin receptor (bottom panel) β subunits in tissue from 8-week ND- and HFD-fed mice. a indicates lane with extract from isolated adipocytes. C, whole mount staining of adipose tissue after 24 h of incubation in the absence (top panels) or presence (bottom panels) of 150 nm insulin. Arrows highlight regions of coincidence between phosphorylated receptors and IB4 staining. Arrowhead points to cell outside the vascular wall. D, model for interaction between high fat diet, insulin, and IGFbp4 to enhance adipose tissue growth.
Analysis of Adipocyte Size and Adipose Tissue Capillary Density
Adipose tissue samples were fixed in zinc fixative (Ted Pella, Inc.), embedded in paraffin, cut into 4-μm sections, mounted on Superfrost Plus microscope slides (Fisher), and stained with rat anti-mouse CD31 antibody (Pharmingen, 1:100) using indirect immunoperoxidase method (LSABTM+/HRP kit; Dako). Sections were processed simultaneously with isotype controls. The numbers of positive capillary lumens per area were counted in at least two independent sections, with at least five fields per section for each adipose tissue sample by two independent investigators who were blinded to the origin of the samples. Adipocyte size was measured using the particle counting feature in ImageJ, following background subtraction and binary thresholding. Results were verified by visual inspection and manual measurements of a sample of the total image set.
Whole Mount Tissue Staining
Fragments of adipose tissue fixed in 4% formaldehyde and extensively washed were incubated for 1 h in the presence of Alexa 568-conjugated Griffonia simplicifolia isolectin B4 (IB4) (Invitrogen, 1:1000) and Bodipy FL C12 (Invitrogen, 1:2000) or Alexa 488-conjugated IB4 (Invitrogen, 1:1000) and Alexa 568-conjugated rat anti-mouse antibodies to F4/80 (AbD Serotec, 1:50). For analysis of IGF-1 and insulin receptors, samples were incubated for 48 h at 4 °C with rabbit anti-phospho-IGF-I receptor β (Tyr-1131)/insulin receptor β (Tyr-1146) (Cell Signaling Technology catalog no. 3021, 1:100), followed by an hour of incubation with Alexa Fluor 488-conjugated goat anti-rabbit IgG (H+L) (Invitrogen, 1:500) and Alexa 568-conjugated IB4.
Western Blotting
Equal amounts of protein (20 μg) were loaded on 8% (for IR and IGF receptor analysis) or 15% (for IGFbp4 analysis) polyacrylamide gels and transferred into nitrocellulose membranes (PerkinElmer Life Sciences) according to a standard procedure. The membranes were blocked with 5% dry nonfat milk for 1 h at room temperature and blotted with the following antibodies: rabbit polyclonal anti-IGFbp4 (Millipore, 1:1000), rabbit anti-IGF1R β (Cell Signaling Technology catalog no. 9750, 1:1000), rabbit anti-insulin receptor β (Cell Signaling Technology catalog no. 3025), or rat anti-mouse actin antibodies (Sigma, 1:10,000) overnight at 4 °C. Secondary antibodies used were anti-rabbit IgG and anti-rat IgG horseradish peroxidase-conjugated (Promega). Blots were developed using Western Lightning chemiluminescent reagent (PerkinElmer Life Sciences).
Affymetrix Microarray Analysis
Total RNA from isolated adipocytes was isolated using TRIzol (Invitrogen). Affymetrix protocols were followed for the preparation of cDNA from total RNA, which was hybridized to Affymetrix MOE430-2 GeneChip arrays. Raw expression data collected from an Affymetrix HP GeneArray Scanner was normalized across all 12 (three biological replicates per condition) data sets using the RMA algorithm. A linear model approach (25) was used to determine differentially expressed genes. Derived p values were adjusted for multiple testing using the Benjamini and Hochberg method (26). Statistical significance was defined as being differentially expressed with an adjusted p value of less than 0.05. A bioconductor implementation of the MAS 5.0 algorithm (Affymetrix) was used.
Quantitative RT-PCR
Total RNA was extracted by using TRIzol reagent (Invitrogen). For quantitative mRNA analysis, 2 μg of the total RNA was reverse-transcribed by using an iScript cDNA synthesis kit (Bio-Rad). 10% of each RT reaction was subjected to quantitative real time PCR analysis using an iQ SYBR Green supermix kit and real time PCR detection system following the manufacturer's instructions (MyiQ, Bio-Rad). Ferritin heavy chain and β-actin were used as internal housekeeping genes. Relative gene expression was calculated by the 2−ΔΔCT method.
IGF-1 Measurement
Supernatants from 24 wells per condition were collected at days 1 and 3 of culture, pooled into duplicate batches, and assayed for IGF-1 using the mouse/rat IGF-1 Quantikine ELISA kit (R&D Systems). The mean of four independent experiments is shown.
RESULTS
5-Week-old C57BL/6J mice were placed on standard mouse chow (ND) or HFD (15 or 45% calories from fat, respectively). As expected, mice on HFD gained more weight than those on ND (Fig. 1A), with differences being statistically significant after 3 weeks of diet initiation and progressively increasing until the end of the study (30 weeks). This difference was paralleled by increased weight of the epididymal fat pads of mice on HFD relative to those on ND (Fig. 1B); however, after ∼15 weeks the epididymal fat pads of mice on HFD did not continue to increase. Thus, as has been noted by others (27), the continued increase in body weight seen after 15 weeks of HFD is likely due to expansion of other adipose depots, such as the inguinal and mesenteric depots. The increased weight of the epididymal fat pads was paralleled by changes in adipocyte size (Fig. 1C), suggesting that adipocyte hypertrophy could account for the observed weight gain. Analysis of the size distribution of adipocytes revealed a nonsynchronous behavior after 7 weeks of HFD, i.e. rather than a shift in the distribution to a larger mean cell size, it was characterized by the appearance peaks at small and large cell sizes (Fig. 1, D–G). This suggests that this point marks the activation of adipocyte hyperplasia, resulting in the formation of new small adipocytes in parallel to the expansion of the pre-existing ones. By 15 weeks, adipocyte hypertrophy in HFD animals reached a plateau (Fig. 1C), at double the diameter of adipocytes from ND-fed mice. It is interesting to note that a doubling of cell diameter translates into an 8-fold increase in adipocyte volume, which would predict a much larger difference in fat pad weight between ND- and HFD-fed animals than the 2–2.5-fold difference seen at this time point (Fig. 1B). This discrepancy is consistent with the finding that the total number of adipocytes composing the epididymal fat pad decreases as the fat pad expands (27), possibly due to a combination of necrosis and apoptosis of overgrown, metabolically stressed adipocytes (28, 29).
FIGURE 1.

Time course of epididymal fat pad expansion in response to ND or HFD feeding. Body weight (A), epididymal fat pad weight (B), and mean adipocyte size (C) are given at the indicated time points after initiation of diets in 5-week-old mice. Points represent the mean and S.E. of eight mice per condition. Statistical significance was assessed by two-tailed paired t tests for each group. *, p < 0.05; **, p < 0.01; ***, p < 0.001; ****, p < 0.0001. Comparison of the size distribution of adipocytes at 3 weeks (D), 7 weeks (E), and 11 weeks (F) of HFD feeding compared with ND is shown. G, size distribution of adipocytes at 3, 7, and 11 weeks of ND or HFD feeding. Arrows point to appearance of peaks in lower and higher size bins after 11 weeks of HFD.
Among the possible mechanisms that could influence adipose tissue growth are systemic factors such as insulin, which increases in proportion to caloric intake. To test whether insulin might have a direct effect on adipose tissue expandability, we measured its effects on the formation of sprouts from tissue explants ex vivo (Fig. 2A). This approach is advantageous in that factors that strongly influence angiogenic growth, such as oxygen tension and key pro-angiogenic growth factors such as VEGF, are normalized, thus exposing the role of other factors, as well as adipose tissue-intrinsic mechanisms that regulate expandability. Both the percent of explants out of the total number embedded displaying any sprouting activity (Fig. 2B) and the mean number of sprouts per explant (Fig. 2C) were quantified. Insulin caused a significant increase in the percent of explants from ND-fed mice displaying any degree of sprouting (Fig. 2B). In addition, the number of sprouts emerging from each explant was stimulated by insulin (Fig. 2C).
FIGURE 2.

Effect of insulin on sprouting from adipose tissue of ND-fed mice. A, representative images of adipose tissue explants embedded in Matrigel and incubated in the absence (top) and in the presence (bottom) of insulin, visualized at day 14 post-embedding. B, effect of insulin on the percent of explants displaying capillary sprouts after 14 days in culture. C, effects of insulin on the average number of capillary sprouts formed by explants that displayed sprouting. The value assigned to no added insulin was 5 nm, which is contributed by 10% FBS in the growth medium. Statistical significance of the difference between no added insulin and insulin was assessed by two-tailed paired t tests. *, p < 0.05; **, p < 0.01, n = 4. Effects of 2-week rosiglitazone (Rosi) treatment initiated at 28 weeks of ND on the percent of explants displaying capillary sprouts (D) and the number of sprouts per explant (E). *, p < 0.05; **, p < 0.01 compared with no added insulin; #, p < 0.05 versus no rosiglitazone, n = 3.
To determine whether the effect of insulin in vitro is influenced by changes in insulin sensitivity in vivo, 28-week-old mice were treated with the insulin-sensitizer rosiglitazone for 14 days prior to sacrifice. Although the mechanisms by which rosiglitazone increases in vivo insulin sensitivity are not entirely clear, one possibility is that, by promoting adipose tissue expansion, it could mitigate lipotoxicity (30). Rosiglitazone treatment in vivo enhanced the effects of insulin ex vivo to increase the percentage of explants sprouting (Fig. 2D) and the number of sprouts per explant (Fig. 2E). Thus, these results further validate the ex vivo sprouting assay as a surrogate for in vivo adipose tissue growth and support the hypothesis that insulin can directly stimulate expansion of the adipose tissue stromovascular network.
Elevated circulating insulin can be detected almost immediately after initiation of HFD (31). If insulin indeed can stimulate adipose tissue expandability, HFD feeding would be expected to result in enhanced sprouting. Indeed, a progressive increase in the percentage of explants developing sprouts (Fig. 3B), as well as the number of sprouts per explant (Fig. 3C), was seen in response to HFD, even in the absence of insulin. By 30 weeks of HFD, around 80% of explants displayed sprouting in the absence of insulin and virtually 100% in its presence, and the number of sprouts per explant was still significantly increased by insulin. As seen in mice on ND, rosiglitazone treatment for the 14 days preceding sacrifice led to a significant enhancement of the effects of insulin; the percentage of explants sprouting reached a maximal possible level at 30 weeks (Fig. 3D); and the number of sprouts per explant was increased in tissue from rosiglitazone-treated animals (Fig. 3E). These results indicate that a strong pro-angiogenic environment is generated in adipose tissue during HFD feeding, which is enhanced by insulin sensitization, consistent with a direct effect of insulin on adipose tissue stromovascular expansion.
FIGURE 3.

Effect of HFD and rosiglitazone treatment on basal and insulin-stimulated sprout formation. A, representative images of adipose tissue explants from mice fed HFD for 18 weeks, embedded in Matrigel, and incubated in the absence (top) and presence (bottom) of 170 nm insulin, visualized at day 14 post-embedding. B, effect of insulin and HFD on the percent of explants displaying capillary sprouts after 14 days in culture. C, effects of insulin on the average number of capillary sprouts formed by explants that displayed sprouting. *, p < 0.05; **, p < 0.01; ***, p < 0.001; ****, p < 0.0001 compared with no added insulin. #, p < 0.05; ##, p < 0.01; ####, p < 0.0001 compared with 3-week value. Effects of 2-week rosiglitazone (Rosi) treatment initiated at 28 weeks of HFD on the percent of explants displaying capillary sprouts (D) and the number of sprouts per explant (E). *, p < 0.05; ****, p < 0.0001 compared with no insulin; #, p < 0.05 compared with no rosiglitazone. Data represent the means and S.E. from four mice. Statistical significance was assessed by two-tailed paired t tests.
Paradoxically, the pro-angiogenic response seen ex vivo did not seem to translate into enhanced vascularization of the tissue, as immunohistochemistry of epididymal fat pads using the endothelial cell marker CD31 (Fig. 4A) revealed a net decrease in the number of capillary lumens detected per adipocyte at 25–30 weeks of HFD (Fig. 4B). To further understand this discrepancy, we analyzed tissue fragments using whole mount staining, which allows a more comprehensive analysis of capillary network organization. A continuous and dense network of capillaries labeled with IB4 was observed in tissue fragments from ND-fed mice at all ages (Fig. 5A, top panels). In contrast, after only 5 weeks of HFD, a striking qualitative change in the capillary network was detected, where capillaries appeared thinner and fragmented (Fig. 5A, bottom panels). These changes in capillary length and thickness were unrelated to the size of adipocytes, as the capillaries in tissue from 25-week-old ND-fed mice, which contained adipocytes comparable in size to those in 5–15-week-old HFD-fed mice, appeared normal (Fig. 5B). The decreased thickness and fragmentation of the vascular network may explain the apparent decrease in capillary density seen by immunohistochemistry, where small diameter vessels may be poorly detected. In addition to the marked fragmentation of the vascular network, free IB4-stained cells could be seen in tissue from HFD-fed mice. These correspond to macrophages, as established by double staining with F4/80 (Fig. 5C). This finding is consistent with reports of activated macrophage reactivity to IB4 (32) and of macrophage infiltration into adipose tissue of HFD-fed mice (33). These results suggest that the pro-angiogenic effect of HFD, clearly revealed ex vivo, may be undermined by pathological responses to HFD, which disrupt capillary integrity, causing hypoxia and inflammation (34, 35).
FIGURE 4.
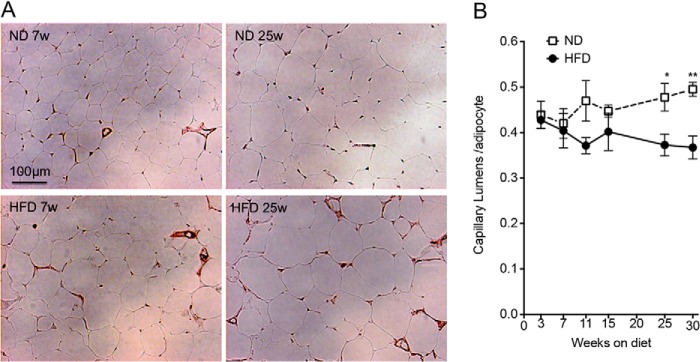
Time course of changes in capillary density in response to HFD. A, representative images of anti-CD31 immunohistochemistry of epididymal adipose tissue from ND- (top) or HFD (bottom)-fed mice at 7 (left panels) or 25 (right panels) weeks after diet initiation. B, mean and S.E. of capillary lumens per adipocyte assessed by immunohistochemistry. Values were derived from analysis of five fields per section, from two independent sections per mouse derived from four independent mice. Statistical significance was assessed by two-tailed paired t tests. *, p < 0.05; **, p < 0.01.
FIGURE 5.

Effect of HFD on adipose tissue capillary network integrity. A, maximal intensity projections of 25 image stacks acquired at 10-μm intervals (250-μm thickness) of IB4-stained fragments of adipose tissue from mice fed ND or HFD (top or bottom panels, respectively) for 5, 15-, or 30 weeks (left, middle, and right panels, respectively). B, superimposition of images in A over corresponding Bodipy-stained images. C, optical section through a fragment of adipose tissue from 18-week HFD-fed mouse double-stained with IB4 (left panel) and antibody to F4/80 (middle panel). Right panel is the overlap of IB4 and F4/80. Arrows point to examples of a single cells positive for both IB4 and F4/80.
To further explore molecular mechanisms involved in adipose tissue expandability, and in particular those stimulated by insulin, we generated cDNA databases from mice fed ND or HFD for 23 weeks, and treated or not with rosiglitazone for 2 weeks before sacrifice. All arrays were conducted using triplicate samples from three independent mice. Signals lower than 50 in all sets were eliminated. Significant differences in gene expression between conditions were identified as described under “Experimental Procedures.” Databases were then queried for genes matching the pattern of insulin-stimulated capillary outgrowth as seen in Fig. 6, where sprouting potential was expressed as the product of the number of sprouts per explant and the percent of explants sprouting, i.e. we searched for genes that would be progressively increased or decreased relative to ND levels by rosiglitazone, HFD, and HFD plus rosiglitazone. Of all the hybridizing probe sets detected in samples from ND-fed mice (Table 1, 1st line), less than 10% was found to be expressed at a higher (Table 1, 2nd line) or lower (Table 1, 5th line) level in samples from rosiglitazone-treated ND-fed mice. Of these, 10–20% were expressed at a higher (Table 1, 3rd line) or lower (Table 1, 6th line) level in samples from HFD-fed mice. Strikingly, of the probe sets concordantly affected by rosiglitazone and HFD, only very few (Table 1, 4th and 7th lines) were further increased or decreased in samples from HFD-fed mice treated with rosiglitazone. This finding is consistent with the finding that many of the gene expression changes associated with HFD are related to increased inflammation and insulin resistance, both of which are reversed by rosiglitazone (data not shown). Thus, very few genes are regulated in a manner correlated with observed ex vivo sprouting. Table 2 depicts the identity of the genes identified by the probes within this set and their expression levels under each condition.
FIGURE 6.
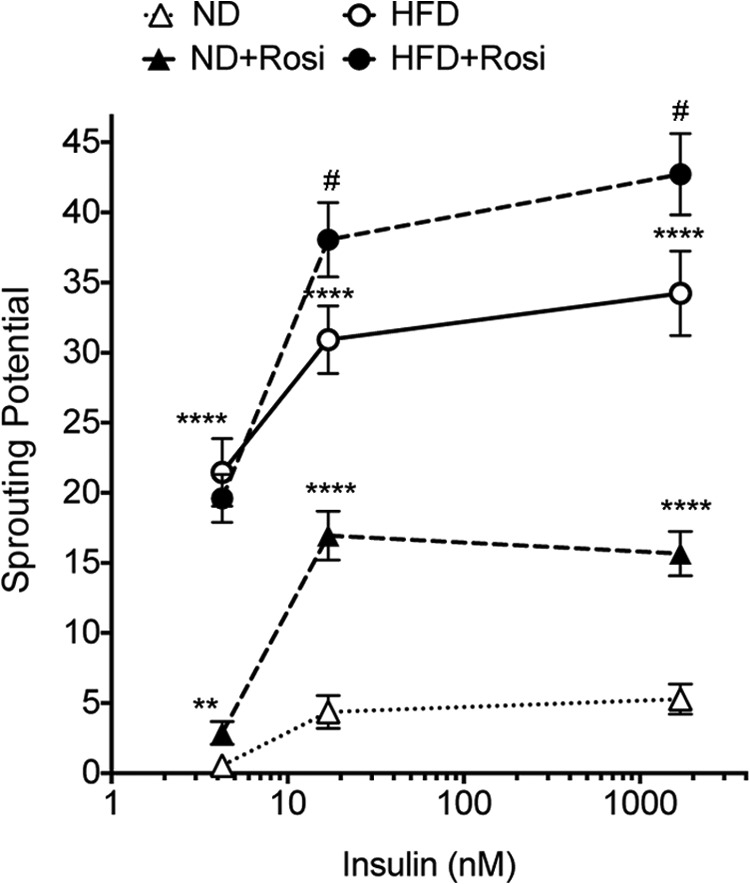
Effects of HFD and rosiglitazone on insulin-stimulated sprout formation. Sprouting potential ((number of sprouts/explant)(% of explants sprouting)) of explants derived from mice fed ND or HFD for 30 weeks and treated without or with rosiglitazone (Rosi) for 2 weeks starting at 28 weeks of diet feeding. Statistical significance was assessed by two-tailed paired t tests. **, p < 0.01; ****, p < 0.0001 compared with ND; #, p < 0.05 compared with HFD.
TABLE 1.
Number of probes changing concordantly with ex-vivo sprouting
R indicates rosiglitazone.
| Condition | No. of probes |
|---|---|
| All | 17,953 |
| ND < ND +R | 1072 |
| ND < ND + R < HFD | 110 |
| ND < ND +R < HFD < HFD+R | 6 |
| ND > ND + R | 1499 |
| ND > ND + R > HFD | 345 |
| ND > ND +R > HFD > HFD +R | 5 |
TABLE 2.
Identity and expression levels of genes correlated with sprouting
ROSI is rosiglitazone.
| Gene name | Gene symbol | ND | ND + ROSI | HFD | HFD + ROSI |
|---|---|---|---|---|---|
| Fatty acid desaturase 3 | Fads3 | 4160 | 6146 | 7540 | 8191 |
| Thymosin, β10 | Tmsb10 | 1292 | 1579 | 2161 | 2839 |
| mTOR-binding protein | Depdc6 | 580 | 870 | 1553 | 2403 |
| RAS-like, family 12 | Rasl12 | 65 | 156 | 330 | 420 |
| Aspartate-β-hydroxylase | Asph | 1761 | 1333 | 1165 | 854 |
| IGF-binding protein 4 | Igfbp4 | 899 | 522 | 333 | 234 |
| Protein phosphatase 1B | Ppm1b | 571 | 443 | 399 | 333 |
| Adenylate cyclase-activating polypeptide 1 receptor 1 | Adcyap1r1 | 398 | 251 | 100 | 84 |
Of the genes identified by this analysis, IGFbp4 has been directly implicated in angiogenesis, specifically involved in the regulation of tumor vascularization (36). Thus, the role of this protein in adipose tissue expandability was further investigated. Quantitative RT-PCR analysis to determine IGFbp4 mRNA expression levels was conducted on whole adipose tissue from an independent cohort of mice fed ND or HFD for 8, 15, and 25 weeks. A significant decrease in expression was seen at 15 weeks of HFD, and levels remained decreased relative to ND at 25 weeks (Fig. 7A). In contrast, macrophage infiltration, estimated from the expression levels of Emr-1 and CD68, was increased by HFD (Fig. 7, B and C). To determine whether mRNA levels correlated with the protein levels of IGFbp4, we analyzed whole tissue extracts by Western blotting. IGFbp4 protein levels were significantly decreased as early as 5 weeks of HFD compared with ND (Fig. 7, D and E). Moreover, the levels of IGFbp4 decreased with the age of the mouse, paralleling the trend seen in message levels.
FIGURE 7.

Expression levels and effects of IGFbp4 on sprout formation. Expression levels of IGFbp4 (A), Emr-1 (B), and CD68 (C) mRNAs in adipose tissue from mice maintained on ND or HFD for the indicated length of time. Statistical significance of the difference between ND and HFD was assessed by two-tailed paired t tests **, p < 0.01; ***, p < 0.005. D, representative Western blots from whole tissue extracts from mice on ND or HFD for the weeks indicated probed with antibodies to IGFbp4 or actin. E, quantification of data in D, showing mean and S.E. of four independent experiments. F, sprouting potential ((number of sprouts/explant)(% of explants sprouting)) of explants derived from mice maintained on ND or HFD for 25 weeks and cultured in the presence or absence of insulin and 0.5 μg/ml IGFbp4 as indicated. Statistical significance was assessed by two-tailed paired t tests as indicated. *, p < 0.05; **, p < 0.01; ***, p < 0.005; ****, p < 0.0001. G, production of IGF-1 by explants. The supernatant from 20 wells per experiment from four independent experiments was pooled and analyzed for IGF-1 content. Statistical significance was assessed by one-way analysis of variance and the Krustal-Wallis test with Dunn's correction for multiple comparisons *, p < 0.05; ***, p < 0.005.
To determine whether IGFbp4 directly influences sprouting, we examined the effect of recombinant protein. At 0.5 μg/ml, which corresponds to average levels detected in serum (37), IGFbp4 completely suppressed the effect of insulin to stimulate sprouting in tissue from HFD-fed mice and significantly mitigated the effect of the HFD itself (Fig. 7F). These results suggest that IGF-1 plays an important role in stimulating stromovascular expansion in response to insulin. To test this hypothesis, the level of IGF-1 in the culture media was measured at day 1 (media in contact with explants from time 0 to 24 h post-embedding) and day 3 (in contact with explants from 48 to 72 h after embedding). Insulin caused a dose-dependent increase in the concentration of IGF-1 in the media (Fig. 7G).
To further define the contribution of IGF-1, we analyzed the effects of IGF-1 or IGF-2 to stimulate sprouting (Fig. 8A). Explants from mice maintained for 8 weeks on HFD were exposed to increasing concentrations of the growth factors. Increased sprouting in response to both IGF-1 and insulin was seen starting at concentrations of ∼15 nm, but the effect of IGF-2 was not consistently seen. Moreover, IGFbp4 suppressed the effects of both insulin and IGF-1.
To begin to understand the mechanism by which IGF-1 stimulates sprouting, we analyzed the levels of IGF-1 and insulin receptors present in the tissue (Fig. 8B). Western blotting revealed the presence of both insulin and IGF-1 receptors in the explanted tissue, but IGF-1 receptors were not detected in isolated adipocytes, suggesting they are predominantly localized to the stromovascular fraction. Staining of tissue explants with antibodies that detect phosphorylated IGF1 and insulin receptors resulted in labeling of cells along the vasculature, identified by concomitant IB4 staining (Fig. 8C). In some fields, strongly stained cells displaying long projections residing outside the vasculature were also detected. We could not detect differences in the staining pattern after insulin stimulation, but the qualitative nature of these experiments cannot rule out possible quantitative differences in levels of phosphorylation or the number of phosphorylated receptors in response to stimulation. Together, these results are consistent with the hypothesis that, through increased circulating levels of insulin, stimulated production of IGF-1, and reduced tissue levels of IGFbp4, high calorie feeding could result in rapid IGF-1-mediated expansion of adipose tissue vasculature (Fig. 8D).
To determine whether similar mechanisms operate in humans, we examined the effects of IGFbp4 on human subcutaneous adipose tissue explants. For reasons that remain unclear, sprouting from human explants was much higher than that seen in explants from mouse tissue (Fig. 9A, compare with Fig. 2A). Nevertheless, there was a good correlation between capillary outgrowth from human subcutaneous adipose tissue and fasting insulin levels (Fig. 9B) and circulating triglycerides (Fig. 9C), suggesting that, as in mice, the effects of high caloric intake persist and are reflected under ex vivo culture conditions. Sprouting from human adipose tissue was suppressed by recombinant IGFbp4 (Fig. 9D), consistent with a similar role for this protein in human and mouse adipose tissue expandability.
FIGURE 9.

Effect of IGFbp4 on human adipose tissue sprout formation. A, explant from human subcutaneous adipose tissue embedded in Matrigel and visualized after 5 (left) and 10 (right) days in culture. Average number of sprouts per explant from subcutaneous human adipose tissue explants plotted as a function of donor's fasting serum insulin (B) or circulating triglyceride concentration (C). D, effect of IGFbp4 on the average number of capillaries formed per explant. In each case, ∼30 explants were cultured in the presence or absence of IGFbp4, and sprouting was assessed after 14 days. ***, p < 0.001. A p value of 0.037 was obtained in a one-tailed, paired Student's t test comparing the mean of three individuals without or with IGFbp4.
DISCUSSION
Healthy expansion of adipose tissue requires growth and proliferation of adipocytes and concomitant growth of their stromovascular support network. How these events are coordinated during development and during the onset of obesity remains unclear. Several studies have reported that adipose tissue expansion in response to HFD is accompanied by hypoxia, which could potentially elicit pro-angiogenic signaling and a subsequent expansion of the capillary network (35). However, hypoxia signaling in adipose tissue appears to result in fibrosis, rather than in angiogenesis (15, 38). An alternative possibility is that expansion of the adipose tissue capillary network is triggered by factors that accompany excessive energy consumption. These could include persistently elevated circulating insulin, lipids, or other factors increased by excess caloric intake.
Using an ex vivo assay that measures the formation of adipose tissue stromovascular networks, here we find that insulin directly stimulates adipose tissue sprouting. Moreover, this effect parallels in vivo insulin sensitivity, as it is enhanced by treatment of mice with rosiglitazone, and the elevated circulating insulin elicited by HFD. These results are consistent with a mechanism by which expansion of the adipose tissue capillary network is triggered by metabolic factors. This mechanism would allow the expansion of the stromovascular network to occur in parallel with adipocyte growth, preventing the development of hypoxia, and subsequent compromised adipose tissue function. Insufficiency of this mechanism could enhance the risk of hypoxia, fibrosis, and metabolic disease.
In addition to insulin, HFD feeding also resulted in a marked increase in sprouting. This effect may be due to the hyperinsulinemic conditions that are elicited by HFD. Another possibility considered was the effect of macrophages, which invade adipose tissue of HFD-fed mice and have been reported to play a pro-angiogenic role (7, 39). However, treatment of HFD-fed mice with rosiglitazone decreases macrophage infiltration and yet enhances capillary sprouting. Thus, a direct correlation between macrophage content and sprouting is not found.
To discern possible mechanisms underlying the effects of insulin and HFD to stimulate adipose tissue expandability, we turned to global gene expression analysis. This analysis was facilitated by the unusual pattern of insulin responsiveness seen in ex vivo sprouting, which is enhanced both by rosiglitazone and HFD. This unusual pattern greatly decreased the number of genes correlated with this response, as rosiglitazone treatment counteracts many of the changes in gene expression induced by HFD, which are dominated by genes associated with inflammation. A much smaller number of genes change concordantly with HFD and rosiglitazone.
This approach identified IGFbp4 as a gene involved in adipose tissue expandability. IGFbp4 is a member of a family of secreted proteins that regulate the bio-availability and signaling of IGF-1. IGFbp4 binds to IGF-1 and prevents its interaction with the IGF-1 receptor, resulting in decreased mitogenic signaling. We find that both mRNA and protein levels of IGFbp4 decrease with age-associated, rosiglitazone-associated, and HFD-induced adipose tissue expansion. This decrease in IGFbp4 levels could lead to enhanced bioavailability of locally produced IGF-1 to stimulate endothelial and stromal cell proliferation.
The possibility that the IGFbp4/IGF-1 signaling axis might mediate the effects of insulin on expandability is supported by the findings that IGF-1 directly stimulate sprouting and that insulin directly stimulated production of IGF-1 by the tissue. An effect of insulin to induce IGF-1 production in liver (40–42) has previously been reported; moreover, trophic effects of insulin have been attributed in some instances to IGF-1 production (43), and insulin has been reported to increase IGF-1 synthesis (44). Further experiments will be necessary to define the cells that are the source of IGF-1 within adipose tissue and the mechanisms by which insulin increases its production.
Several mechanisms could be involved in the effects of insulin and IGF-1 to stimulate the formation of capillary sprouts. Acting through IGF-1 or hybrid IGF1/insulin receptors, insulin and/or IGF-1 could have a direct effect on adipose tissue endothelial cells. Indeed, the effects of insulin to stimulate endothelial cell proliferation (45, 46) and VEGF production (47, 48) have been reported and are consistent with our findings of activated receptors along the adipose tissue vasculature. Alternatively, insulin and IGF-1 could stimulate other cells in the tissue, including adipocytes, to produce pro-angiogenic factors. However, the effect of insulin to stimulate sprouting was enhanced in adipose tissue from mice fed HFD. Because adipocytes from HFD-fed mice are less sensitive to insulin, these results are consistent with an indirect and more complex effect involving the bioavailability of IGF-1, specifically its regulation by IGFbp4.
IGFbp4 has been directly implicated in the control of regional adipose tissue development, being decreased in adipose tissue depots that display enhanced adipogenic growth (49). In other settings, IGFbp4 has been implicated in angiogenesis, as IGF-1-stimulated tumor endothelial cell proliferation was blocked by recombinant IGFbp4 and a protease-resistant form of IGFbp4 impaired tumor growth (36).
Other genes correlating with insulin-stimulated sprouting represent components of signal transduction pathways (Depdc6, Ras112, and Ppm1b), which have mostly not been characterized in the context of adipose tissue expandability. Interestingly, adipose tissue-specific Ppm1B knockout results in enlarged adipocytes and impaired glucose tolerance (50), consistent with a role for this protein in tissue remodeling capacity.
An important question raised by our studies is why the stimulation of adipose tissue capillary expandability in response to HFD, evidenced by ex vivo sprouting, does not translate into healthy adipose tissue expansion in vivo. In fact, HFD feeding results in adipose tissue hypoxia, inflammation, and fibrosis, and whole mount staining reveals extensive damage to capillary integrity as early as 5 weeks after initiation of HFD feeding. These results suggest that in vivo conditions, such as direct effects of HFD components on endothelium (51), counteract favorable pro-angiogenic expandability signals. Further experiments in which ex vivo and in vivo conditions are compared will allow us to better understand the causes of HFD-induced vascular damage.
In summary, the work presented here suggest a model for the coordinate expansion of adipocytes and the adipose tissue stromovascular network that occurs in response to excess caloric intake. In this model, nutritional signals such as insulin regulate the local production of IGF-1 and its binding protein IGFbp4 to mediate capillary expansion. This mechanism can explain how angiogenic expansion of adipose tissue can occur in the absence of hypoxia-driven pro-angiogenic signals. Experiments in human tissue are consistent with those seen in the mouse, suggesting that this mechanism is likely to be conserved between species. Factors that counteract this mechanism are likely to enhance metabolic disease risk.
Acknowledgment
Morphology and Bioinformatics Core Services were supported by the University of Massachusetts Diabetes Center of Excellence.
This work was supported, in whole or in part, by National Institutes of Health Grant DK089101 (to S. C.).
- HFD
- high fat diet
- ND
- normal diet.
REFERENCES
- 1. Arner E., Westermark P. O., Spalding K. L., Britton T., Rydén M., Frisén J., Bernard S., Arner P. (2010) Adipocyte turnover: relevance to human adipose tissue morphology. Diabetes 59, 105–109 [DOI] [PMC free article] [PubMed] [Google Scholar]
- 2. Tchoukalova Y. D., Votruba S. B., Tchkonia T., Giorgadze N., Kirkland J. L., Jensen M. D. (2010) Regional differences in cellular mechanisms of adipose tissue gain with overfeeding. Proc. Natl. Acad. Sci. U.S.A. 107, 18226–18231 [DOI] [PMC free article] [PubMed] [Google Scholar]
- 3. Bouloumie A., Lolmede K., Sengenes C., Galitzky J., Lafontan M. (2002) Angiogenesis in adipose tissue. Ann. Endocrinol. 63, 91–95 [PubMed] [Google Scholar]
- 4. Christiaens V., Lijnen H. R. (2010) Angiogenesis and development of adipose tissue. Mol. Cell. Endocrinol. 318, 2–9 [DOI] [PubMed] [Google Scholar]
- 5. Hausman G. J., Richardson R. L. (2004) Adipose tissue angiogenesis. J. Anim. Sci. 82, 925–934 [DOI] [PubMed] [Google Scholar]
- 6. Han J., Lee J. E., Jin J., Lim J. S., Oh N., Kim K., Chang S. I., Shibuya M., Kim H., Koh G. Y. (2011) The spatiotemporal development of adipose tissue. Development 138, 5027–5037 [DOI] [PubMed] [Google Scholar]
- 7. Nishimura S., Manabe I., Nagasaki M., Hosoya Y., Yamashita H., Fujita H., Ohsugi M., Tobe K., Kadowaki T., Nagai R., Sugiura S. (2007) Adipogenesis in obesity requires close interplay between differentiating adipocytes, stromal cells, and blood vessels. Diabetes 56, 1517–1526 [DOI] [PubMed] [Google Scholar]
- 8. Spencer M., Unal R., Zhu B., Rasouli N., McGehee R. E., Jr., Peterson C. A., Kern P. A. (2011) Adipose tissue extracellular matrix and vascular abnormalities in obesity and insulin resistance. J. Clin. Endocrinol. Metab. 96, E1990–E1998 [DOI] [PMC free article] [PubMed] [Google Scholar]
- 9. Gealekman O., Guseva N., Hartigan C., Apotheker S., Gorgoglione M., Gurav K., Tran K. V., Straubhaar J., Nicoloro S., Czech M. P., Thompson M., Perugini R. A., Corvera S. (2011) Depot-specific differences and insufficient subcutaneous adipose tissue angiogenesis in human obesity. Circulation 123, 186–194 [DOI] [PMC free article] [PubMed] [Google Scholar]
- 10. Pasarica M., Rood J., Ravussin E., Schwarz J. M., Smith S. R., Redman L. M. (2010) Reduced oxygenation in human obese adipose tissue is associated with impaired insulin suppression of lipolysis. J. Clin. Endocrinol. Metab. 95, 4052–4055 [DOI] [PMC free article] [PubMed] [Google Scholar]
- 11. Mazzatti D., Lim F. L., O'Hara A., Wood I. S., Trayhurn P. (2012) A microarray analysis of the hypoxia-induced modulation of gene expression in human adipocytes. Arch. Physiol. Biochem. 118, 112–120 [DOI] [PubMed] [Google Scholar]
- 12. Sun K., Wernstedt Asterholm I., Kusminski C. M., Bueno A. C., Wang Z. V., Pollard J. W., Brekken R. A., Scherer P. E. (2012) Dichotomous effects of VEGF-A on adipose tissue dysfunction. Proc. Natl. Acad. Sci. U.S.A. 109, 5874–5879 [DOI] [PMC free article] [PubMed] [Google Scholar]
- 13. Elias I., Franckhauser S., Ferré T., Vilà L., Tafuro S., Muñoz S., Roca C., Ramos D., Pujol A., Riu E., Ruberte J., Bosch F. (2012) Adipose tissue overexpression of vascular endothelial growth factor protects against diet-induced obesity and insulin resistance. Diabetes 61, 1801–1813 [DOI] [PMC free article] [PubMed] [Google Scholar]
- 14. Goossens G. H., Bizzarri A., Venteclef N., Essers Y., Cleutjens J. P., Konings E., Jocken J. W., Cajlakovic M., Ribitsch V., Clément K., Blaak E. E. (2011) Increased adipose tissue oxygen tension in obese compared with lean men is accompanied by insulin resistance, impaired adipose tissue capillarization, and inflammation. Circulation 124, 67–76 [DOI] [PubMed] [Google Scholar]
- 15. Halberg N., Khan T., Trujillo M. E., Wernstedt-Asterholm I., Attie A. D., Sherwani S., Wang Z. V., Landskroner-Eiger S., Dineen S., Magalang U. J., Brekken R. A., Scherer P. E. (2009) Hypoxia-inducible factor 1α induces fibrosis and insulin resistance in white adipose tissue. Mol. Cell. Biol. 29, 4467–4483 [DOI] [PMC free article] [PubMed] [Google Scholar]
- 16. Wellen K. E., Hotamisligil G. S. (2003) Obesity-induced inflammatory changes in adipose tissue. J. Clin. Invest. 112, 1785–1788 [DOI] [PMC free article] [PubMed] [Google Scholar]
- 17. Xu H., Barnes G. T., Yang Q., Tan G., Yang D., Chou C. J., Sole J., Nichols A., Ross J. S., Tartaglia L. A., Chen H. (2003) Chronic inflammation in fat plays a crucial role in the development of obesity-related insulin resistance. J. Clin. Invest. 112, 1821–1830 [DOI] [PMC free article] [PubMed] [Google Scholar]
- 18. Osborn O., Olefsky J. M. (2012) The cellular and signaling networks linking the immune system and metabolism in disease. Nat. Med. 18, 363–374 [DOI] [PubMed] [Google Scholar]
- 19. Condeelis J., Pollard J. W. (2006) Macrophages: obligate partners for tumor cell migration, invasion, and metastasis. Cell 124, 263–266 [DOI] [PubMed] [Google Scholar]
- 20. Cho C. H., Koh Y. J., Han J., Sung H. K., Jong Lee H., Morisada T., Schwendener R. A., Brekken R. A., Kang G., Oike Y., Choi T. S., Suda T., Yoo O. J., Koh G. Y. (2007) Angiogenic role of LYVE-1-positive macrophages in adipose tissue. Circ. Res. 100, e47–57 [DOI] [PubMed] [Google Scholar]
- 21. Tang W., Zeve D., Suh J. M., Bosnakovski D., Kyba M., Hammer R. E., Tallquist M. D., Graff J. M. (2008) White fat progenitor cells reside in the adipose vasculature. Science 322, 583–586 [DOI] [PMC free article] [PubMed] [Google Scholar]
- 22. Tran K. V., Gealekman O., Frontini A., Zingaretti M. C., Morroni M., Giordano A., Smorlesi A., Perugini J., De Matteis R., Sbarbati A., Corvera S., Cinti S. (2012) The vascular endothelium of the adipose tissue gives rise to both white and brown fat cells. Cell Metab. 15, 222–229 [DOI] [PMC free article] [PubMed] [Google Scholar]
- 23. Tang W., Zeve D., Seo J., Jo A. Y., Graff J. M. (2011) Thiazolidinediones regulate adipose lineage dynamics. Cell Metab. 14, 116–122 [DOI] [PMC free article] [PubMed] [Google Scholar]
- 24. Rojas-Rodriguez R., Gealekman O., Kruse M. E., Rosenthal B., Rao K., Min S., Bellve K. D., Lifshitz L. M., Corvera S. (2014) Adipose tissue angiogenesis assay. Methods Enzymol. 537, 75–91 [DOI] [PMC free article] [PubMed] [Google Scholar]
- 25. Smyth G. K. (2004) Linear models and empirical Bayes methods for assessing differential expression in microarray experiments. Stat. Appl. Genet. Mol. Biol. 3, Article3 [DOI] [PubMed] [Google Scholar]
- 26. Benjamini Y., Hochberg Y. (1995) Controlling the false discovery rate: a practical and powerful approach to multiple testing. J. R. Stat. Soc. Series B 57, 289–300 [Google Scholar]
- 27. Jo J., Guo J., Liu T., Mullen S., Hall K. D., Cushman S. W., Periwal V. (2010) Hypertrophy-driven adipocyte death overwhelms recruitment under prolonged weight gain. Biophys. J. 99, 3535–3544 [DOI] [PMC free article] [PubMed] [Google Scholar]
- 28. Alkhouri N., Gornicka A., Berk M. P., Thapaliya S., Dixon L. J., Kashyap S., Schauer P. R., Feldstein A. E. (2010) Adipocyte apoptosis, a link between obesity, insulin resistance, and hepatic steatosis. J. Biol. Chem. 285, 3428–3438 [DOI] [PMC free article] [PubMed] [Google Scholar]
- 29. Murano I., Barbatelli G., Parisani V., Latini C., Muzzonigro G., Castellucci M., Cinti S. (2008) Dead adipocytes, detected as crown-like structures, are prevalent in visceral fat depots of genetically obese mice. J. Lipid Res. 49, 1562–1568 [DOI] [PubMed] [Google Scholar]
- 30. Prieur X., Mok C. Y., Velagapudi V. R., Núñez V., Fuentes L., Montaner D., Ishikawa K., Camacho A., Barbarroja N., O'Rahilly S., Sethi J. K., Dopazo J., Orešič M., Ricote M., Vidal-Puig A. (2011) Differential lipid partitioning between adipocytes and tissue macrophages modulates macrophage lipotoxicity and M2/M1 polarization in obese mice. Diabetes 60, 797–809 [DOI] [PMC free article] [PubMed] [Google Scholar]
- 31. Winzell M. S., Ahrén B. (2004) The high-fat diet fed mouse. Diabetes 53, S215–S219 [DOI] [PubMed] [Google Scholar]
- 32. Maddox D. E., Shibata S., Goldstein I. J. (1982) Stimulated macrophages express a new glycoprotein receptor reactive with Griffonia simplicifolia I-B4 isolectin. Proc. Natl. Acad. Sci. U.S.A. 79, 166–170 [DOI] [PMC free article] [PubMed] [Google Scholar]
- 33. Dalmas E., Clément K., Guerre-Millo M. (2011) Defining macrophage phenotype and function in adipose tissue. Trends Immunol. 32, 307–314 [DOI] [PubMed] [Google Scholar]
- 34. Hosogai N., Fukuhara A., Oshima K., Miyata Y., Tanaka S., Segawa K., Furukawa S., Tochino Y., Komuro R., Matsuda M., Shimomura I. (2007) Adipose tissue hypoxia in obesity and its impact on adipocytokine dysregulation. Diabetes 56, 901–911 [DOI] [PubMed] [Google Scholar]
- 35. Rausch M. E., Weisberg S., Vardhana P., Tortoriello D. V. (2008) Obesity in C57BL/6J mice is characterized by adipose tissue hypoxia and cytotoxic T-cell infiltration. Int. J. Obes. 32, 451–463 [DOI] [PubMed] [Google Scholar]
- 36. Ryan A. J., Napoletano S., Fitzpatrick P. A., Currid C. A., O'Sullivan N. C., Harmey J. H. (2009) Expression of a protease-resistant insulin-like growth factor-binding protein-4 inhibits tumour growth in a murine model of breast cancer. Br. J. Cancer 101, 278–286 [DOI] [PMC free article] [PubMed] [Google Scholar]
- 37. Jehle P. M., Jehle D. R., Mohan S., Böhm B. O. (1998) Serum levels of insulin-like growth factor system components and relationship to bone metabolism in type 1 and type 2 diabetes mellitus patients. J. Endocrinol. 159, 297–306 [DOI] [PubMed] [Google Scholar]
- 38. Zhang X., Lam K. S., Ye H., Chung S. K., Zhou M., Wang Y., Xu A. (2010) Adipose tissue-specific inhibition of hypoxia-inducible factor 1α induces obesity and glucose intolerance by impeding energy expenditure in mice. J. Biol. Chem. 285, 32869–32877 [DOI] [PMC free article] [PubMed] [Google Scholar]
- 39. Leibovich S. J., Polverini P. J., Shepard H. M., Wiseman D. M., Shively V., Nuseir N. (1987) Macrophage-induced angiogenesis is mediated by tumour necrosis factor-α. Nature 329, 630–632 [DOI] [PubMed] [Google Scholar]
- 40. Clemmons D. R. (2012) Metabolic actions of insulin-like growth factor-I in normal physiology and diabetes. Endocrinol. Metab. Clin. North Am. 41, 425–443 [DOI] [PMC free article] [PubMed] [Google Scholar]
- 41. Scheiwiller E., Guler H. P., Merryweather J., Scandella C., Maerki W., Zapf J., Froesch E. R. (1986) Growth restoration of insulin-deficient diabetic rats by recombinant human insulin-like growth factor I. Nature 323, 169–171 [DOI] [PubMed] [Google Scholar]
- 42. Russell-Jones D. L., Rattray M., Wilson V. J., Jones R. H., Sönksen P. H., Thomas C. R. (1992) Intraperitoneal insulin is more potent than subcutaneous insulin at restoring hepatic insulin-like growth factor-I mRNA levels in the diabetic rat: a functional role for the portal vascular link. J. Mol. Endocrinol. 9, 257–263 [DOI] [PubMed] [Google Scholar]
- 43. Alarid E. T., Schlechter N. L., Russell S. M., Nicoll C. S. (1992) Evidence suggesting that insulin-like growth factor-I is necessary for the trophic effects of insulin on cartilage growth in vivo. Endocrinology 130, 2305–2309 [DOI] [PubMed] [Google Scholar]
- 44. Phillips L. S., Goldstein S., Pao C. I. (1991) Nutrition and somatomedin. XXVI. Molecular regulation of IGF-I by insulin in cultured rat hepatocytes. Diabetes 40, 1525–1530 [DOI] [PubMed] [Google Scholar]
- 45. Gousseva N., Kugathasan K., Chesterman C. N., Khachigian L. M. (2001) Early growth response factor-1 mediates insulin-inducible vascular endothelial cell proliferation and regrowth after injury. J. Cell. Biochem. 81, 523–534 [DOI] [PubMed] [Google Scholar]
- 46. Lassance L., Miedl H., Absenger M., Diaz-Perez F., Lang U., Desoye G., Hiden U. (2013) Hyperinsulinemia stimulates angiogenesis of human fetoplacental endothelial cells: a possible role of insulin in placental hypervascularization in diabetes mellitus. J. Clin. Endocrinol. Metab. 98, E1438–E1447 [DOI] [PubMed] [Google Scholar]
- 47. Qiao J. G., Wu L., Lei D. X., Wang L. (2005) Insulin promotes sinusoidal endothelial cell proliferation mediated by upregulation of vascular endothelial growth factor in regenerating rat liver after partial hepatectomy. World J. Gastroenterol. 11, 5978–5983 [DOI] [PMC free article] [PubMed] [Google Scholar]
- 48. Carnesecchi S., Carpentier J. L., Foti M., Szanto I. (2006) Insulin-induced vascular endothelial growth factor expression is mediated by the NADPH oxidase NOX3. Exp. Cell Res. 312, 3413–3424 [DOI] [PubMed] [Google Scholar]
- 49. Tchoukalova Y. D., Nathanielsz P. W., Conover C. A., Smith S. R., Ravussin E. (2009) Regional variation in adipogenesis and IGF regulatory proteins in the fetal baboon. Biochem. Biophys. Res. Commun. 380, 679–683 [DOI] [PMC free article] [PubMed] [Google Scholar]
- 50. Owen C., Czopek A., Agouni A., Grant L., Judson R., Lees E. K., Mcilroy G. D., Göransson O., Welch A., Bence K. K., Kahn B. B., Neel B. G., Mody N., Delibegovič M. (2012) Adipocyte-specific protein tyrosine phosphatase 1B deletion increases lipogenesis, adipocyte cell size and is a minor regulator of glucose homeostasis. PLoS One 7, e32700. [DOI] [PMC free article] [PubMed] [Google Scholar]
- 51. Kim F., Pham M., Maloney E., Rizzo N. O., Morton G. J., Wisse B. E., Kirk E. A., Chait A., Schwartz M. W. (2008) Vascular inflammation, insulin resistance, and reduced nitric oxide production precede the onset of peripheral insulin resistance. Arterioscler. Thromb. Vasc. Biol. 28, 1982–1988 [DOI] [PMC free article] [PubMed] [Google Scholar]