

Background: The secretion and possible functions of extracellular UDP-sugars in epidermal keratinocytes are not known.
Results: UDP-glucose activates P2Y14 receptor and JAK2, increases STAT3 Tyr705 phosphorylation, and enhances transcription of hyaluronan synthase 2 (HAS2).
Conclusion: UDP-glucose release signals for enhanced HAS2 expression by keratinocytes.
Significance: Stimulation of hyaluronan synthesis is an inherent part of epidermal keratinocyte activation and injury response.
Keywords: Hyaluronate, Janus Kinase (JAK), Keratinocyte, Purinergic Receptor, STAT3, Hyaluronan, P2Y14, UDP-Glc
Abstract
Hyaluronan, a major matrix molecule in epidermis, is often increased by stimuli that enhance keratinocyte proliferation and migration. We found that small amounts of UDP-sugars were released from keratinocytes and that UDP-glucose (UDP-Glc) added into keratinocyte cultures induced a specific, rapid induction of hyaluronan synthase 2 (HAS2), and an increase of hyaluronan synthesis. The up-regulation of HAS2 was associated with JAK2 and ERK1/2 activation, and specific Tyr705 phosphorylation of transcription factor STAT3. Inhibition of JAK2, STAT3, or Gi-coupled receptors blocked the induction of HAS2 expression by UDP-Glc, the latter inhibitor suggesting that the signaling was triggered by the UDP-sugar receptor P2Y14. Chromatin immunoprecipitations demonstrated increased promoter binding of Tyr(P)705-STAT3 at the time of HAS2 induction. Interestingly, at the same time Ser(P)727-STAT3 binding to its response element regions in the HAS2 promoter was unchanged or decreased. UDP-Glc also stimulated keratinocyte migration, proliferation, and IL-8 expression, supporting a notion that UDP-Glc signals for epidermal inflammation, enhanced hyaluronan synthesis as an integral part of it.
Introduction
Hyaluronan is a large, ubiquitous glycosaminoglycan, consisting of alternating N-acetylglucosamine (GlcNAc) and glucuronic acid (GlcUA) repeating units. It occupies the pericellular and extracellular space of many cell types, including basal and spinous cell layers of skin epidermis (1). It acts as a highly hydrated space filler, but also stimulates proliferation and migration through binding to its receptors, like CD44 and RHAMM (2–4). In the epidermis, hyaluronan synthesis has been shown to increase rapidly in tissue activation, for example, due to injury like epidermal wounding (5–8), presumably to help cell growth and movement to cover the wound. Hyaluronan disappears in stratum granulosum before terminal differentiation of the keratinocytes, and reduction of epidermal hyaluronan promotes differentiation (9, 10). Accordingly, stimulation of hyaluronan synthesis and increase of its content associates with compromised epidermal water barrier and morphologically incomplete differentiation (11). Moreover, hyaluronan increases in epidermal hyperproliferation and squamous cell cancer induced by UV irradiation (12).
The three mammalian HAS isoforms are multispan transmembrane proteins. They are active when inserted in the plasma membrane, transferring GlcNAc and GlcUA from the corresponding cytosolic UDP-sugars to the reducing end of the growing hyaluronan chain (13) that is extruded into extracellular space through a pore formed by the enzyme itself (14, 15). Among the three HAS genes HAS2 shows the highest expression in keratinocytes, and is up-regulated by epidermal growth factor (11), keratinocyte growth factor (16), TNFα (17), interferon-γ (18), and all-trans-retinoid acid (19), whereas transforming growth factor β (TGFβ) down-regulates its expression in keratinocytes (11). The regulation of HAS2 expression involves several transcription factors with functional response elements in its promoter. These include retinoic acid receptor, nuclear factor κB (NF-κB), cAMP response element-binding protein 1 (CREB1), specificity protein 1 (SP1), yin-yang 1 (YY1), and STAT (20, 21). For example, EGF receptor activation enhances tyrosine 705-phosphorylated STAT3 binding to the promoter, inducing HAS2 gene expression (21).
The expression of HAS2 is also influenced by cellular supply of its own substrate UDP-GlcNAc, the abundance of which triggers a suppressive feedback loop mediated by transcription factors SP1 and YY1. Their binding to the HAS2 promoter is subject to regulation by their O-GlcNAc modification that is dependent on the cellular concentration of UDP-GlcNAc (22). Cytosolic UDP-GlcNAc has thus a double function; it stimulates hyaluronan synthesis as a crucial substrate of the HAS enzyme, and as a stabilizer of the HAS2 enzyme (23), but inhibits it through transcriptional HAS2 protein suppression of the synthesis.
It has been recently confirmed that UDP-sugars exist also in extracellular fluids (24), released by cellular injury or, as suggested recently, in a regulated fashion (24, 25). The idea of regulated secretion is in line with the finding that increasing UDP-sugar transport into the Golgi apparatus stimulates UDP-sugar release through vesicular transport (24, 25). Interestingly, there is a Gi-protein-coupled purinergic plasma membrane receptor (P2Y14) specific for UDP-sugars (26), suggesting a biological signaling function for extracellular UDP-sugars. Release of UDP-sugars might thus serve as an autocrine or paracrine signaling system. The system may serve as a warning signal after tissue injury, because thrombin has been shown to stimulate the release of UDP-Glc (24), and receptor binding of UDP-Glc induces the expression of IL-8, a mediator of inflammation (27). Most potent agonist of the P2Y14 is UDP-Glc (26).
P2Y14 has a relatively wide distribution in human tissues, with highest expression levels in placenta, adipose tissue, stomach, and intestine, and moderate levels in the brain, spleen, lung, and liver (28). P2Y14 is an important regulator of mesenchymal differentiation, especially adipogenesis (29). Activation of P2Y14 receptor by UDP-Glc promotes MAP kinase signaling (30) and mobilizes intracellular Ca2+ stores (27). Extracellular UDP-Glc promotes IL-8 secretion (27) and stimulates mast cell degranulation (31).
Keratinocytes express several subtypes of P2Y receptors (32), known to regulate their proliferation and differentiation (33). However, nothing is known about the function of the P2Y14 receptor and extracellular UDP-sugars in keratinocytes. In this article we show that extracellular UDP-Glc stimulates HAS2 expression, hyaluronan synthesis, proliferation, and migration of cultured human keratinocytes. The up-regulation of HAS2 is mediated through a Gi-linked P2Y receptor, most likely P2Y14, and phosphorylation of JAK and STAT3, the latter specifically in tyrosine 705, which correlates with its binding to the HAS2 promoter after UDP-Glc treatment.
EXPERIMENTAL PROCEDURES
Cell Culture
The human immortalized epidermal keratinocyte cell line HaCaT (34) was cultured in DMEM (Sigma) supplemented with 10% FBS (Hyclone, Logan, UT), 2 mm l-glutamine (Euroclone, Milan, Italy), 50 units/ml of penicillin, and 50 μg/ml of streptomycin (Euroclone). UDP-Glc was purchased from Sigma.
RNA Extraction and q-PCR
q-PCR2 analyses were done from total RNA extracted with Eurozol (Euroclone) after cDNA synthesis with a Verso cDNA kit (Thermo Fischer, Waltham, MA), on an MX3000P thermal cycler (Stratagene, La Jolla, CA), using the Fast Start universal SYBR Green Master (ROX) (Roche Applied Science). Fold-inductions were calculated using the formula 2−(ΔΔCt), where ΔΔCt is Δ Ct(sample) − ΔCt(non-treated replicate1), ΔCt is Ct(gene of interest) − Ct(ARPO) and the Ct is the cycle at which the threshold is crossed. The gene-specific primers for the genes analyzed are shown in Table 1. PCR product quality was monitored using post-PCR melt curve analysis.
TABLE 1.
Primer sequences for q-PCR of the reverse transcribed human genes
| Gene name | Primer sequence (5′to 3′) |
|---|---|
| ARPO | Forward: AGATGCAGCAGATCCGCAT |
| Reverse: GTGGTGATACCTAAAGCCTG | |
| HAS2 | Forward: CAGAATCCAAACAGACAGTTC |
| Reverse: TAAGGTGTTGTGTGTGACTGA | |
| IL-8 | Forward: GAGTGGACCACACTGCGCCAA |
| Reverse: TCCACAACCCTCTGCACCCAGTT | |
| P2Y14 | Forward: TCAGCAGATCATTCCTGTGC |
| Reverse: GGCTCATCACAAAGTCAGCA |
Enzyme-linked Sorbent Assay for Hyaluronan
Media from the cultures were assayed for the concentration of hyaluronan using a sandwich-type enzyme-linked sorbent assay as described previously (35). The hyaluronan released into the media was normalized per 10,000 cells, counted by using a hemocytometer.
Anion Exchange HPLC of UDP-Glc
Cells were cultured until 80% confluence. After treatments, cells were counted from one plate for normalization of the results, whereas cells and media from parallel plates were used to measure UDP-Glc.
Cells were washed with cold PBS on ice. Cold acetonitrile was added to precipitate proteins and extract UDP-sugars. Cells were scraped off and the acetonitrile with cell debris was transferred into microcentrifuge tubes, the plates were washed with 1 ml of deionized water and combined with the first extract, centrifuged at 6000 × g for 20 min, the supernatants transferred to clean tubes, evaporated in a vacuum centrifuge, and dissolved in PBS for further purification by solid phase extraction on Superclean Envi-Carb SPE cartridges (Sigma) as described previously (36).
Culture media were rapidly frozen, lyophilized, and redissolved in 250 μl of water. Salts and glucose were separated from UDP-sugars on a Superdex Peptide® column eluted at 1 ml/min with 12 mm NH4HCO3. The fractions containing UDP-sugars (prechecked using UDP-Glc standard) were combined and purified further with Superclean Envi-Carb SPE, as above.
Purified samples were evaporated by vacuum centrifugation and dissolved in 300 μl of water for anion-exchange HPLC on a CarpoPacTM PA1 column (4 × 250 mm, Dionex, Sunnyvale, CA). The column was eluted at 1 ml/min with a gradient made of ultrapure H2O (A), 1.3 m sodium borate, pH 7.0 (B), 1 m sodium acetate, pH 7.0 (C), and 1.5 m sodium borate, pH 7.5 (D). The column was equilibrated with 45/55/0/0% (v/v/v/v) of buffers A, B, C, and D, respectively. Elution was performed with the following program: T0 = 45/55/0/0%, T23 = 40/55/0/5%, T48 = 36/55/0/9%, T65 = 20.6/12.3/61.8/5.3%, T69 = 20.6/12.3/61.8/5.3%, T70 = 10.4/12.3/72/5.3%, T82 = 45/55/0/0%, and T88 = 45/55/0/0%. Integrated peak areas were calculated and compared with those of standard nucleotide sugars.
Proteome ProfilerTM Array
HaCaT cells were incubated for 30 min in medium supplemented with 100 μm UDP-Glc. Cells were washed with PBS, and cell lysis and protein extraction was performed as described in the protocol of the Proteome Profiler Array, Human phosphokinase array kit (R&D Systems, Minneapolis, MN).
Western Blotting
Proteins were extracted on ice with RIPA lysis buffer (PBS, pH 7.4, with 1% Nonidet P-40, 0.5% sodium deoxycholate, 0.1% SDS, 100 μg/ml of phenylmethylsulfonyl fluoride, 10 μg/ml of sodium orthovanadate, and 1% phosphatase inhibitor mixture 2, and 0.5% protease inhibitor mixture (Sigma)). The samples (20 μg of protein) were resolved by 10% SDS-PAGE, followed by transfer onto nitrocellulose membrane (Whatman) by 35 mA/cm2 constant current with a semidry blotter (Biometra, Göttingen, Germany). The membrane was placed in a SNAP blotting system (Millipore, Bedford, MA), blocked with 1% BSA, washed with Tris-buffered saline (TBS), 0.1% Tween, and incubated with the primary antibodies: phospho-JAK2 (Tyr1007/1008), phospho-STAT3 (Tyr705) 1:1000, phospho-STAT3 (Ser727) 1:1000 (all from Cell Signaling, Danvers, MA), phospho-ERK 1:500 (Santa Cruz), and β-actin, 1:2500 (Sigma). After washes, the membrane was incubated with the fluorescent secondary antibodies anti-rabbit 680 and anti-mouse 800, 1:5000 (Pierce). Protein bands were visualized and quantified with Odyssey® infrared imaging system (Li-Cor Bioscience, Lincoln, NE). The results represent the ratio of band intensities between the protein of interest and β-actin.
Signaling Inhibitors
Cells were treated with pertussis toxin (PTX, 100 ng/ml, Tocris Bioscience, Southampton, UK), an inhibitor of Gi-coupled receptors, for 17 h prior to UDP-Glc addition. Cells were treated for 2 h with 30 μm AG490 (Sigma), an inhibitor of JAK2, 50 μm STAT3 inhibitor IX (Calbiochem), 0.5–2 μm PD98059 (Calbiochem), and 0.5–2 μm UO126 (Calbiochem), inhibitors of MEK1/2, before adding UDP-Glc. PTX was dissolved in water, AG490 in ethanol, and STAT3 inhibitor IX, PD98059, and UO126 in dimethyl sulfoxide. Equal amounts of those solvents were used as controls.
Chromatin Immunoprecipitation
After 2-h incubations with or without 100 μm UDP-Glc, nuclear proteins were cross-linked to DNA by adding formaldehyde directly to the medium to a final concentration of 1% for 10 min at room temperature. Cross-linking was stopped by adding glycine to a final concentration of 0.15 m and incubating for 10 min at room temperature.
The medium was removed and the cells were washed twice with ice-cold PBS. The cells were then collected in ice-cold PBS supplemented with a protease inhibitor mixture (Sigma). After centrifugation, the cell pellets were resuspended in lysis buffer (1% SDS, 10 mm EDTA, protease inhibitors, 50 mm Tris-HCl, pH 8.1) and incubated for 10 min at room temperature. The lysates were sonicated until DNA fragments of 300 to 1000 bp in length were obtained (in preliminary tests).
Cellular debris was removed by centrifugation. At this step 20 μl of the supernatant was taken as the input sample and diluted 1:5 in ChIP dilution buffer (0.01% SDS, 1.1% Triton X-100, 1.2 mm EDTA, 167 mm NaCl, protease inhibitors, 16.7 mm Tris-HCl, pH 8.1). The rest of the supernatant was divided into the aliquots that were diluted 1:10 in ChIP dilution buffer and incubated with the indicated antibodies (1:100–1:400) overnight at 4 °C with rotation. The antibodies against rabbit IgG (sc-2027), pSTAT3 (Tyr705) (sc-7993), were obtained from Santa Cruz Biotechnologies and pSTAT (Ser727) (number 9134) and total STAT3 (number 9132) were obtained from Cell Signaling.
The immunocomplexes were collected with 20 μl of protein G-magnetic beads (Millipore) for 1 h at 4 °C with rotation. The beads were separated from the supernatant using a magnetic rack (Qiagen, Valencia, CA). The pellets were washed sequentially for 3 min by rotation with 1 ml of each of the following buffers: low salt wash buffer (0.1% SDS, 1% Triton X-100, 2 mm EDTA, 150 mm NaCl, 20 mm Tris-HCl, pH 8.1), high salt wash buffer (0.1% SDS, 1% Triton X-100, 2 mm EDTA, 500 mm NaCl, 20 mm Tris-HCl, pH 8.1), and LiCl wash buffer (0.25 m LiCl, 1% Nonidet P-40, 1% sodium deoxycholate, 1 mm EDTA, 10 mm Tris-HCl, pH 8.1). Finally, the beads were washed twice with 1 ml of TE buffer (1 mm EDTA, 10 mm Tris-HCl, pH 8.1).
The immunocomplexes were eluted by adding 350 μl of elution buffer (1% SDS, 100 mm NaHCO3), incubating at 65 °C for 30 min, and separating the beads from the supernatant on a magnetic rack. This 350-μl sample was the enriched output sample. The cross-linking was reversed and the remaining proteins were digested by adding 1.8 μl of proteinase K (final concentration 110 μg/ml, Fermentas) to both the input and output samples, and incubating overnight at 65 °C. The DNA was recovered by using the QIAquick® PCR purification kit (Qiagen).
The DNA was used as a template for PCR with the following profile: 10 min preincubation at 95 °C, and 45 cycles of 30 s denaturation at 95 °C, 30 s annealing at 60 °C, and 30 s elongation at 72 °C, with one final incubation for 10 min at 72 °C. The primers for the amplification are presented in Table 2. The resulting PCR products were quantified and expressed as percent of the input control. Fold-changes were calculated using the formula 2(ΔCt), where ΔCt is Ct output − Ct input and Ct is the cycle at which the threshold is crossed. The results are presented as fold-changes over the value of samples precipitated with normal rabbit IgG. Input samples were diluted 13.3 times compared with outputs.
TABLE 2.
Sequence and location of the PCR primers used in the ChIP assays of human HAS2 gene promoter
| Region | Location | Primer sequence (5′to 3′) |
|---|---|---|
| 1 (TSS) | −32 to + 57 | Forward: GGAGGCAGAAGGGCAACAAC |
| Reverse: GTTCAATGGGCTGCTCGAAGC | ||
| 2 | − 481 to − 244 | Forward: GTTACTTAGCTGAAGGGCACC |
| Reverse: GGCCGGTTCTAAACTCCAATG | ||
| 3 | − 1048 to − 655 | Forward: CAGTCATCAGCAGGCTTGTTG |
| Reverse: CTGACGTCAAGTGTCAAAGCC | ||
| 4 | − 1896 to − 1554 | Forward: GGTATTCCCGCATTACGTGTC |
| Reverse: CACTGATTTCCCCCAGCAAC |
Proliferation and Migration
For the proliferation assay 20,000 HaCaT cells were seeded on a 24-well plate and after 4 h UDP-Glc was added to a final concentration of 100 μm. The media containing UDP-Glc was replaced each day. Cells were detached with trypsin-EDTA at 1–5 days following plating and counted with hemocytometer.
Cell proliferation was also studied by BrdU staining. HaCaT cells were seeded on 8-well chamber slides (Nalge Nunc, Naperville, IL), cultured to 80% confluence, and treated with 100 μm UDP-Glc overnight. The next day the cultures were incubated with 5-bromo-2′deoxyuridine (1:1000, BrdU, Roche Applied Science) in DMEM for 1 h, washed with PBS, and fixed with 4% paraformaldehyde on ice. The slides were washed with 100 mm sodium phosphate, pH 7.4 (PB), incubated with 70% EtOH for 10 min, and washed with PB again. The slides were treated with 2 m HCl for 30 min at 37 °C, washed with PB, and blocked with 1% BSA/PB for 10 min at room temperature, then immunostained with the anti-BrdU antibody (1:500, Sigma) in 1% BSA/PB for 2 h at 37 °C, washed with PB, incubated with biotinylated anti-mouse antibody (1:200, Vector Laboratories, Burlingame, CA) in 1% BSA/PB for 30 min at 37 °C, and washed with PB. The bound antibodies were visualized with the avidin-biotin peroxidase (1:200, ABC-standard kit, Vector) in PB for 1 h at room temperature, washed with PB, and incubated with 0.05% 3,3′-diaminobenzidine and 0.03% hydrogen peroxide for 5 min. The nuclei were stained with hematoxylin. The cells were mounted using Supermount (BioGenex, San Ramon, CA). The number of nuclei showing positive staining and the number of all nuclei were counted from 10 fields, randomly photographed using a ×10 objective.
For studies on apoptosis HaCaT cells were seeded on 96-well plates (Cell Star®, Greiner Bio-One, Kremsmunster, Austria). The next day, fresh medium containing 100 μm UDP-Glc was changed. After a 24-h incubation, living and dead cells were determined with a kit according to the instructions of the manufacturer (CytoTox-GloTM Cytotoxicity Assay, Promega).
For the migration assay HaCaT cultures were grown to confluence and an artificial wound was introduced to the cell layer with a pipette tip. Fresh medium with 100 μm UDP-Glc were changed. The cell-free area was measured immediately after scraping and 24 h later using an Olympus CK2 phase-contrast microscope (Olympus Optical Co. Ltd., Tokyo, Japan) and NIH Image software. The newly covered wound area was calculated and converted to an average migration distance from the wound edge.
Statistical Analysis
Normally distributed data were analyzed by paired samples t tests when comparing control and UDP-Glc-treated cultures, and by one-way analysis of variance with Dunnett's post hoc test, when many treatments were tested.
RESULTS
Extracellular UDP-Glc Stimulates HAS2 Expression and Induces Hyaluronan Synthesis
A signaling function has been established for extracellular UDP-sugars, activating several intracellular pathways and modulating cell functions. Given the importance of the intracellular UDP-sugars for hyaluronan synthesis (23, 35, 37) and HAS expression (22, 38) we examined whether UDP-sugars are also active when added in the extracellular compartment. Introduction of UDP-Glc induced a clear increase of HAS2 mRNA although UDP-GlcUA caused a modest increase, and UDP-Gal and UDP-GlcNAc did not present significant effects (Fig. 1A). The activation of HAS2 expression was rapid, with a significant increase already 90 min after the addition of UDP-Glc, whereas the expression level had returned back to control level after 6 h (Fig. 1C). The expression of HAS2 showed a steep increase between 10 and 50 μm, but without a significant further increase above 100 μm, as if crossing a threshold concentration would trigger a rapidly saturable response (Fig. 1D). UDP-Glc also slightly increased the expression of HAS3, which was not further analyzed, whereas HAS1 expression was too low for reliable analysis. To see if the rise in HAS2 mRNA expression was reflected in hyaluronan secretion, its content in the culture medium was assayed. A significant 175% rise in the amount of hyaluronan was found in samples collected 6 h after the addition UDP-Glc (Fig. 1B). This change was not observed in samples collected at the 4-h time point. The delay in the increased hyaluronan production was in line with an idea that transcriptional activation preceded the increased hyaluronan production.
FIGURE 1.

Extracellular UDP-sugars regulate HAS2 expression and hyaluronan synthesis. A, HaCaT cultures were treated for 2 h with 100 μm of the indicated UDP-sugars and analyzed for HAS2 expression. B, UDP-Glc as the most powerful stimulator was used to study hyaluronan release into growth medium, analyzed 4 and 6 h after adding UDP-Glc. C, the time course of HAS2 induction using 100 μm concentration of UDP-Glc. D, effect of UDP-Glc concentration on HAS2 expression during a 2-h incubation. In panels A and C the data represent mean ± S.E. of three independent experiments, each done as duplicate. The statistical significance of the differerences between control and UDP-sugars were tested using Dunnett's test. In panels B and D the data represent mean ± S.E. of 5 and 4 independent experiments, respectively. Statistical significance was estimated using paired sample t test. *, p < 0.05; **, p < 0.01; and ***, p < 0.001.
Extracellular Decay of UDP-Glc
Because the effect of UDP-Glc on HAS2 transcription was relatively short-lived, we measured the decay rate of the UDP-Glc in the medium. As shown in Fig. 2A, UDP-Glc content was decreased after 30 min incubation to 80% and after 6 h to 25% of the original level. The endogenously produced UDP-Glc in the medium varied between 1 and 2 pmol/10,000 cells.
FIGURE 2.
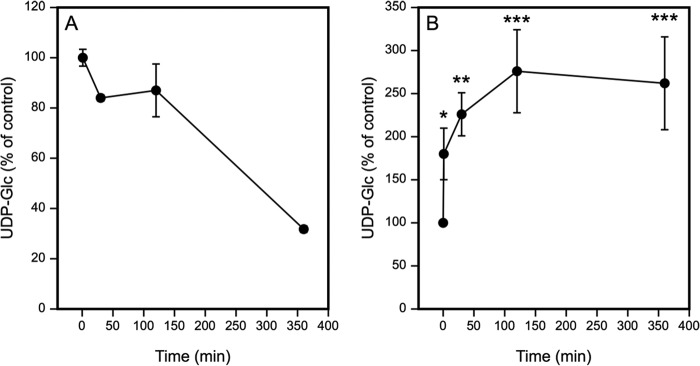
Added UDP-Glc decreases in the HaCaT culture medium and increases in the cells. HaCaT cells were incubated for 1, 30, 120, and 360 min with 100 μm UDP-Glc. Extracellular (A) and intracellular (B) UDP-Glc was analyzed with anion exchange HPLC, with mean ± S.E. of 3 and 4 independent experiments, respectively. In A, the time point at 1 min was taken as the control (100%), indicating the starting level of the UDP-Glc in the medium. In B, the time point 0 (100%) indicates the average intracellular UDP-Glc level in non-treated cultures. The statistical significance between non-treated and UDP-Glc-treated cultures at each time point indicate the results of Dunnett's test: *, p < 0.05; **, p < 0.01; and ***, p < 0.001.
We also studied how the addition of UDP-Glc influenced its intracellular content. 30 min after addition of 100 μm UDP-Glc to the culture medium there was already a 1.8-fold increase, and at the 2-h time point the intracellular level of UDP-Glc was increased by 2.7-fold (Fig. 2B), suggesting that part of UDP-Glc was endocytosed.
The Effect of UDP-Glc on HAS2 Transcription Is Mediated by Gi-coupled P2Y Receptors
UDP-Glc has been shown to act as an agonist of the Gi-coupled receptor P2Y14 (25). Three Gi-coupled P2Y receptor subtypes have been identified, namely P2Y12, P2Y13, and P2Y14. ADP activates the former two, and P2Y14 is the only subtype known to be activated by UDP-Glc (39). P2Y14 is expressed in HaCaT cells (32, 40). To study the involvement of P2Y14, experiments were done in cells pretreated with PTX, which specifically inhibits signal transduction through Gi-coupled receptors by catalyzing ADP-ribosylation of the α subunit of Gi protein, thereby uncoupling the G protein from receptor (41). We used 100 ng/ml of PTX, previously reported to effectively block Gi-coupled receptors (31). PTX did not show toxic effects on the HaCat culture, as indicated by cell morphology and the absence of increased apoptosis in the cytotoxicity assay, but it significantly inhibited the stimulation of the HAS2 expression evoked by UDP-Glc (Fig. 3A), indicating that UDP-Glc signaling involves Gi-coupled receptors, very likely P2Y14.
FIGURE 3.
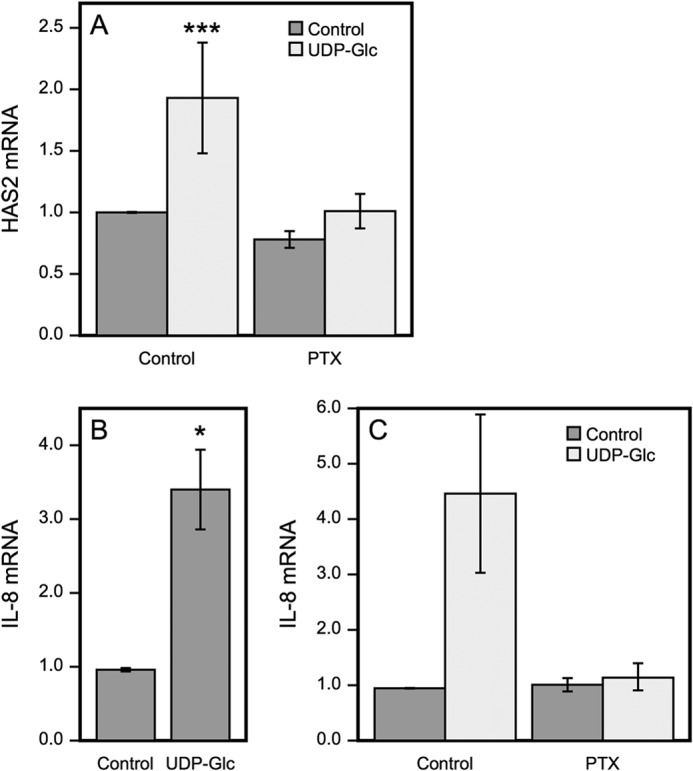
Pertussis toxin inhibits UDP-Glc-induced expression of HAS2 and IL-8. HaCaT cells were preincubated overnight with or without 100 ng/ml of PTX before UDP-Glc was added to 100 μm final concentration and incubation continued for 2 h. HAS2 (A) and IL-8 (B and C) mRNA were measured by RT q-PCR. Data represent mean ± S.E. of four experiments, ***, p < 0.001, Dunnett's test (A), of five experiments, *, p = 0.017, paired sample t test (B) and in chart (C) mean ± range of one experiment with replicate samples.
For background, we checked whether UDP-Glc also induces signals other than those leading to HAS2 expression. As enhanced secretion of IL-8 was previously reported in airway epithelial cells treated with UDP-Glc (27), we measured its expression in HaCaT cells. Indeed, IL-8 mRNA was significantly up-regulated by UDP-Glc simultaneously with HAS2 (Fig. 3B), indicating a wider range of signals activated by UDP-Glc in HaCaT cells. The induction of IL-8 expression was also blocked by PTX (Fig. 3C). The findings support the idea that the HAS2 response is part of an inflammatory reaction.
UDP-Glc Stimulates ERK and STAT3 Phosphorylation
To study which signaling pathways are involved in the up-regulation of HAS2 expression, we used a phosphokinase array (Fig. 4A). After a 30-min incubation of HaCaT cells with UDP-Glc, the most interesting finding was the Tyr705 phosphorylation of STAT3, an important transcriptional regulator of HAS2 (11, 21) and its upstream activator ERK (42, 43). The increase of ERK and STAT3-Tyr705 phosphorylations by UDP-Glc was confirmed by Western blotting (Fig. 4, B and C).
FIGURE 4.

UDP-Glc activates ERK and STAT3. A, dot blot images from a phosphokinase array on protein samples extracted from cells incubated for 30 min with 100 μm UDP-Glc. The phosphorylated proteins STAT-Tyr705 and ERK are encircled. Other spots in array: A3A4, p38a; A7A8, JNK1/2/3; A9A10, GSK-3a/b; B5B6, MSK1/2; B9B10, Akt1/2/3; C1C2, TOR; C3C4, CREB; C7C8, AMPKa2; C9C10, β-catenin; D1D2, Src; D7D8, STAT2; D9D10, STAT5a; E1E2, Fyn; E3E4, Yes; E9E10, STAT5b; F1F2, Hck; F3F4, Chk-2; F5F6, FAK; F7F8, PDGF Rb; F9F10, STAT5a/b (B and C). Western blots of cells incubated for 30–60 min with 100 μm UDP-Glc with antibodies against p-ERK and Tyr(P)705-STAT3. Mean ± S.D. of 4 independent experiments are shown. Statistical significance of the difference versus control, **, p = 0.002 (Dunnett's test).
Because p-ERK can activate STAT3, we checked whether inhibition of p-ERK blocks the up-regulation of HAS2 by UDP-Glc. It turned out that UO126, which totally abolished ERK phosphorylation (Fig. 5A), efficiently cut the basal expression of HAS2 down to ∼30% of control, whereas the relative stimulation by UDP-Glc was minimally affected (Fig. 5, A and B). This finding was reproduced by PD98059, another inhibitor of ERK phosphorylation (Fig. 5, A and C). The higher efficiency of UO126 over PD98059 has been noted before (44) and may be due to the fact that UO126 targets both MEK1 and MEK2, whereas the main target of PD98059 is MEK1. Data on both inhibitors and concentrations were subjected to statistical analysis, which indicated that UDP-Glc activation of HAS2 remained significant in the presence of ERK inhibition. This suggests that STAT3 was mainly activated by another signaling pathway.
FIGURE 5.

ERK contributes to the basal HAS2 mRNA level but not UDP-Glc-mediated up-regulation. A, phosphorylated ERK (pERK) levels after 120 min preincubation with MEK inhibitors: UO126 and PD98059 followed 30 min incubation with or without 100 μm UDP-Glc. B and C, cells preincubated for 120 min in the presence of the UO126 and PD98059 were incubated for 60 min with each inhibitor with or without 100 μm UDP-Glc. HAS2 expression was assayed and compared between UDP-Glc-treated and untreated cultures, the relative increase is indicated by the percentages above the columns. Mean ± S.D. of 2–3 independent experiments are shown. Analysis of variance indicated that the inhibitors did not influence the increase caused by UDP-Glc. In addition, UDP-Glc versus control in the presence of the inhibitors, p < 0.001 (t test).
JAK2 Phosphorylation Associates to UDP-Glc-stimulated HAS2 Expression
Besides ERK, Janus kinase 2 (JAK2) has been found to activate STAT3 (45). We therefore examined the level of p-1007/1008JAK2 following introduction of UDP-Glc. There was a transient increase of JAK2 at 10–20 min, followed by return to the control level at 30–60 min (Fig. 6, A and B). The activation suggested that JAK2 could also be involved in the up-regulation of HAS2. The contribution of JAK2 was supported by the decrease of HAS2 mRNA with AG490, an inhibitor of JAK2 (Fig. 6C).
FIGURE 6.
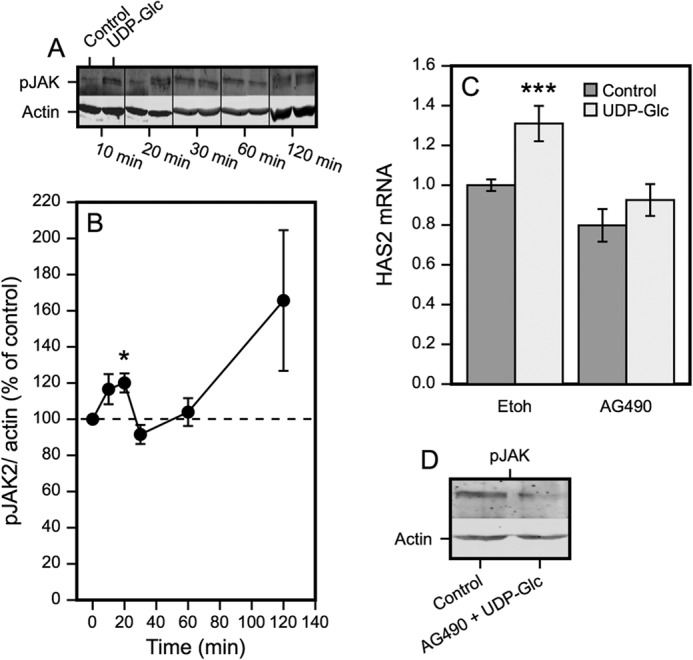
JAK2 phosphorylation associates with UDP-Glc-stimulated HAS2 expression. A, Western blots of pJAK2 at the indicated times following introduction of 100 μm UDP-Glc. B, quantitation of the Western blots from 4–6 separate experiments at each time point, normalized to β-actin. *, p < 0.05, UDP-Glc versus control, by paired sample t test. C, effect of the JAK2 inhibitor AG490 (30 μm) on HAS2 expression in cultures treated with or without 100 μm UDP-Glc. The cultures were preincubated for 120 min with the inhibitor, followed by 120 min with or without 100 μm UDP-Glc. The data represent mean ± S.E. of 5 independent experiments. Statistical significance, control versus UDP-Glc: ***, p < 0.001 (Dunnett's test). D, verification of AG490 effect on JAK2 phosphorylation. The cultures were preincubated for 120 min with or without the inhibitor, followed by 120 min with or without 100 μm UDP-Glc.
UDP-Glc Causes Sequential Activation of STAT3 at Tyr705 and Ser727
STAT3 has two phosphorylation sites (Tyr705 and Ser727) commonly associated with its activation (45). Time-dependent changes of these two phosphorylations were analyzed with Western blotting to correlate their levels with the transient increase in HAS2 mRNA. Tyr(P)705-STAT3 increased at 30 min, reached its maximum at 60 min, and declined close to the control level at 120 min (Fig. 7, A and B), thus preceding the peak of HAS2 at 120 min (Fig. 1C). In contrast, there was no significant change in the level of Ser(P)727 at 30 and 60 min, whereas a significant increase was observed at 120 min (Fig. 7, A and C). This suggests that the increase of HAS2 mRNA fits better with STAT3 phosphorylation of Tyr(P)705 than Ser(P)727.
FIGURE 7.

UDP-Glc-induces both Tyr(P)705 and Ser(P)727 phosphorylation of STAT3. A, Western blots of Tyr(P)705-STAT3 and Ser(P)727-STAT3 30–120 min after introduction of 100 μm UDP-Glc. B, quantitation of the changes in phosphorylation of Tyr(P)705 and C, Ser(P)727 of STAT3. Mean ± S.E. from 3 to 6 separate experiments are shown. **, p < 0.01, UDP-Glc versus control, by paired sample t test. D, verification of the effect of STAT3 inhibitor IX and JAK2 inhibitor AG490 on STAT3 Tyr705 phosphorylation after 120 min preincubation with the inhibitors followed by 60 min incubation with UDP-Glc. E, inhibition of the UDP-Glc-induced HAS2 up-regulation by STAT3 inhibitor IX. The cultures were preincubated for 120 min with 50 μm STAT3 inhibitor IX, followed by 120 min in the presence and absence of 100 μm UPD-Glc. Mean ± S.E. of five separate experiments, *, p < 0.05, Dunnett's test.
The Tyr705 phosphorylation of STAT3 was very efficiently blocked by STAT3 inhibitor IX (Fig. 7D). The JAK2 inhibitor AG490 also blocked the UDP-Glc-induced increase of Tyr(P)705-STAT3 (Fig. 7D), suggesting that JAK2 was involved in the Tyr(P)705-STAT3 activation. The increase of UDP-Glc-induced HAS2 expression was completely neutralized with STAT3 inhibitor IX, although the inhibitor itself increased the basal level of HAS mRNA (Fig. 7E). Together, these results suggest that the early JAK2 activation triggers Tyr705 phosphorylation of STAT3, which is followed by an increase of HAS2 mRNA.
Tyr705-phosphorylated STAT3 Binds to HAS2 Promoter after UDP-Glc Treatment
Because the data suggested involvement of STAT3 in the UDP-Glc-induced HAS2 response, and this transcription factor is known to have functional binding sites on HAS2 promoter, we studied if UDP-Glc-stimulated signaling increases STAT3 binding to the promoter regions with reported STAT response elements (21) and/or to the transcription start site. After 2 h incubation with UDP-Glc, STAT3 binding to the transcription start site containing the region was significantly increased (Fig. 8A). Separate ChIP analyses with Tyr(P)705- and Ser(P)727-STAT3 antibodies revealed that the increase of STAT3 binding to the transcription start site containing the region was solely due to the Tyr(P)705-STAT3, whereas there was no change in the binding of Ser(P)727-STAT3 (Fig. 8A). Similar findings were made in the three other regions of the HAS2 promoter with STAT response elements, showing increased Tyr(P)705-STAT3 binding and no change or reduced binding of Ser(P)727-STAT3 (Fig. 8, B–D). Taken together, the data indicate that UDP-Glc, through a Gi-coupled P2Y14 receptor and JAK2 activation stimulates Tyr705 phosphorylation of STAT3, leading to its binding to the HAS2 promoter and stimulation of its transcription, resulting in enhanced hyaluronan synthesis.
FIGURE 8.

UDP-Glc treatment enhances Tyr(P)705-STAT3 binding to the HAS2 gene promoter. HaCaT cells were incubated for 2 h with 100 μm UDP-Glc and STAT3 binding into the HAS2 promoter was studied by ChIP. Total STAT3, Tyr(P)705-STAT3 and Ser(P)727-STAT3 binding to the transcription start site region is shown in A, to region −481 to −244 in B, to region −1048 to −655 in C, and to region −1896 to −1554 in D. The data represent mean ± S.E. of five independent experiments. Statistical significance control versus UDP-Glc: *, p < 0.05 (paired sample t test).
UDP-Glc Stimulates Cell Proliferation and Migration
Because enhanced migratory and proliferative activity of epidermal keratinocytes is a common feature in inflammation (46) and often associated with elevated hyaluronan synthesis (2, 47), we studied whether UDP-Glc stimulates these cellular functions. In time series experiments daily UDP-Glc treatment did not influence cell numbers until day 5, when the cells approached confluence (Fig. 9C). At that time a small (15%) but statistically significant increase in cell counts was observed. To check if the late UDP-Glc response was due to slow or indirect mechanisms, or was related to confluence, we treated near confluent cultures with UDP-Glc for 24 h and analyzed the number of proliferating cells with BrDU labeling. A small (12%) but consistent increase in the number BrDU-positive cells was observed in UDP-Glc-treated cultures (Fig. 9A), suggesting that the proliferative response may relate to the confluence or differentiation status of the cells. UDP-Glc treatment did not influence the number of dead cells (Fig. 9B).
FIGURE 9.
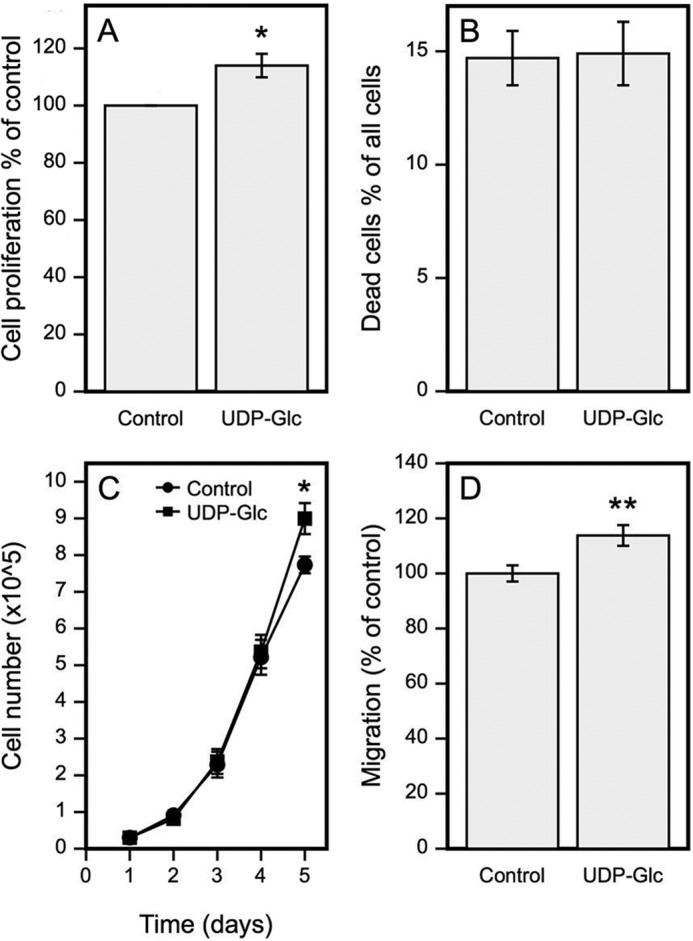
UDP-Glc stimulates HaCaT cell proliferation and migration. A, cell proliferation was studied by incubating HaCaT cells for 24 h with 100 μm UDP-Glc and then 1 h with BrdU. The specimens were processed for histology, immunostained for BrdU, and the percentage of BrdU-positive cells per all cells was calculated. B, apoptosis after 24 h incubation with 100 μm UDP-Glc was studied by a cytotoxicity assay kit. C, cell numbers were counted in a hemocytometer following incubations in 100 μm UDP-Glc for 1–5 days. A new culture medium, including UDP-Glc, was changed every day. D, cell migration was studied in a scratch wound model for 24 h in presence of 100 μm UDP-Glc. Data in A represent mean ± S.E. of 4; B, mean ± range of 2; and C and D, mean ± S.E. of 5 independent experiments. Statistical significance, control versus UDP-Glc. *, p < 0.05; **, p < 0.01 (paired samples t test).
In a scratch wound assay, HaCaT cells treated with UDP-Glc for 24 h migrated significantly more than the untreated cells (Fig. 9D). Although the difference between the means was rather modest (∼13%), the result was reproduced in all experiments performed. To summarize these results, UDP-Glc does not induce apoptosis, and it modestly increases cell proliferation and migration.
DISCUSSION
The present study established that HAS2 gene expression in keratinocytes is subject to regulation by extracellular UDP-sugars, complementing the recently described control by intracellular UDP-sugars (22). However, the extracellular and intracellular signaling mechanisms appear to be completely independent. The intracellular regulation comes through the content of UDP-GlcNAc, controlling O-GlcNAc modifications in transcription factors SP1 and YY1, and the HAS2 enzyme itself (23). In contrast, among the different UDP-sugars UDP-Glc is the dominant extracellular effector on HAS2 expression, mediated by Gi-coupled P2Y receptors, most likely P2Y14, leading to JAK2 activation and Tyr705 phosphorylation of the transcription factor STAT3, and its binding to HAS2 promoter. The resulting increase of hyaluronan synthesis occurred together with enhanced migration and proliferation, phenotypic changes previously found to accompany the accumulation of hyaluronan by other keratinocyte activators like EGF (2), keratinocyte growth factor (16), and retinoic acid (19).
The UDP-Glc stimulation on HAS2 expression comes up very rapidly. Because the HA response requires more time, it is not likely to result from direct regulation of HAS activity, but rather be a result of increased mRNA level. JAK2-STAT3 signaling appeared to be involved in HAS2 response suggesting transcriptional regulation, although changes in mRNA stability are also possible. HAS2 response also recedes fast, probably due to the fast decay of UDP-Glc in the growth medium. Ectonucleotidases are known to catalyze hydrolysis of nucleotides on the outer surface of plasma membrane, and in the extracellular milieu (48), which can explain the observed decay of the UDP-Glc.
The increase of intracellular UDP-Glc during the incubation suggests that a part of UDP-Glc is taken up into the cells, where it remained at an elevated level for at least 6 h. This finding is in line with the reported recycling of nucleotides between extracellular and intracellular compartments (48) but no data exist on the mechanisms of UDP-Glc uptake. Being membrane impermeable, and lacking known plasma membrane transport channels, UDP-Glc can be taken up by fluid phase endocytosis (49), with or without help from receptors. The increased cellular UDP-Glc is perhaps located in endosomes, ER, or Golgi apparatus. However, we believe that the cellular uptake is not a major mediator of signals induced by extracellular UDP-Glc, considering the fact that inhibition of the UDP-Glc receptor with pertussis toxin abolished its stimulatory effect on HAS2 expression.
UDP-Glc is an activating ligand of the Gi-coupled receptor P2Y14. The other Gi-coupled P2Y receptor subtypes are activated by ADP (39). P2Y14 involvement was strongly supported by the notion that PTX, a potent inhibitor of Gi-coupled receptors, prevented the UDP-Glc-induced up-regulation of HAS2 expression. RT-PCR also confirmed that P2Y14 was expressed in HaCaT cells.
It has been reported that activation of Gi-coupled receptors by extracellular UDP-Glc leads to activation of ERK (30), JNK and p38 MAP kinases (31), and mobilization of intracellular Ca2+ stores (27). In agreement with the reports (30), HaCaT cultures showed elevated ERK phosphorylation after UDP-Glc treatment. However, inhibition of the ERK signaling pathway (by UO126 and PD98059) did not block the UDP-Glc-induced stimulation of HAS2 expression (Fig. 4, C and D), indicating that other pathways were involved in the HAS2 response. Indeed, phosphorylation of JAK2, often activated by inflammatory cytokines, was increased by UDP-Glc, and an inhibitor of JAK2 reduced HAS2 up-regulation, suggesting that JAK2 was a more important contributor to the response than ERK1/2.
The STAT transcription factors are the established downstream mediators of JAK2 signaling, governing the expression of a number of genes, especially those involved in cell proliferation (50). Given the fact that the P2Y-group receptors have been shown to activate STAT3 (51), and keratinocytes present functional STAT3 response elements on their HAS2 promoter (21), it was not unexpected that UDP-Glc activated STAT3, and a STAT3 inhibitor blocked the UDP-Glc-induced HAS2 expression. It is thus very likely that Gi-coupled receptor activation signaled the up-regulation of HAS2 expression through the JAK2-STAT3 pathway.
On the other hand, strong down-regulation of the basal HAS2 expression by the inhibitors of MAPK pathway is in line with previous findings that growth factors and cytokines in the serum activate its transcription (38) and the inhibitors block this part of the HAS2 expression. Although we cannot completely exclude unspecific effects of the inhibitors, it was clear that during the 4-h incubation no obvious signs of toxicity or increased apoptosis was detected with any of them.
The STAT response elements on HAS2 promoter bind Tyr(P)705-STAT3 and activate the gene (21). Our data show that 2 h after introduction of UDP-Glc, when HAS2 mRNA reached its peak level, HAS2 promoter binding of both total STAT3 and Tyr(P)705-STAT3 are increased, whereas at the same time Ser(P)727-STAT3 tended to vanish from the chromatin immunoprecipitates. It has been reported that Tyr705 phosphorylation of STAT3 is dependent on JAK activity, whereas ERK and other MAP kinases have been suggested to promote phosphorylation of Ser727 (42, 43). Phosphorylation of Tyr705 causes dimerization of STAT3, which leads to its nuclear localization (52).
The role of Ser727 phosphorylation of STAT3 is controversial at the moment. It has been reported to promote the transcriptional activity of STAT3 by recruiting coactivators (53–55). On the other hand, it may enhance Tyr705 dephosphorylation, and thereby inhibit transcription (56). The reciprocal changes we found in Tyr705 and Ser727 phosphorylations of STAT3 are in line with the latter report, supporting the role of Tyr705 as an activating modification (56). Of course, the function of Ser727 phosphorylation may depend on the specific gene and cell type.
How UDP-sugars get into the extracellular space has remained obscure. Plasma membrane defect following cellular injury is one potential source. On the other hand, the positive correlation between UDP-sugar transporter activity in Golgi membrane, and the UDP-Glc appearance in culture medium has been suggested to indicate its controlled secretion, likely by vesicular transport to plasma membrane (25). The concentration of UDP-Glc in astrocytoma culture medium is quite small but is increased by thrombin treatment (24), also suggesting regulated secretion. The concentration of UDP-Glc was quite small in the growth medium of keratinocytes. However, it is very difficult to estimate the effective concentration in vivo, considering the minor intercellular space between epidermal keratinocytes (57), the labile nature of the substance, and the unknown mechanism of its export.
Extracellular UDP-Glc has been related to many cellular functions. Involvement in inflammation is suggested by its ability to induce the secretion of IL-8 in airway epithelial cells (27) and degranulation of mast cells via activation of the P2Y14 receptor (31). In rat brain expression of the P2Y14 receptor level is up-regulated by a challenge with lipopolysaccharide (58, 59), suggesting a role in reactive astrogliosis. In addition to inflammation, extracellular UDP-Glc and P2Y14 receptor have been associated to the commitment of mesenchymal stem cells to adipogenic and osteogenic differentiation (29), and to the chemotaxis of hematopoietic stem cells (60). Our results suggest that extracellular UDP-Glc has a functional role also in skin epidermis. The induction of HAS2 and IL-8 gene expressions, and the stimulation of migration and proliferation, suggest that its biological function may be to contribute to epidermal activation as a response to trauma or inflammation.
Acknowledgment
Expert technical help from Tuula Venäläinen is gratefully acknowledged.
This work was supported by grants from the Academy of Finland (to M. I. T.), The Sigrid Juselius Foundation (to M. I. T. and R. H. T.), the EVO Funds of the Kuopio University Hospital (to M. I. T.), The Mizutani Foundation (to M. I. T.), the Cancer Center of the University of Eastern Finland (to M. I. T. and R. H. T.), Glycoscience Graduate School (to T. A. J. and M. I. T.), Paavo Koistinen Foundation (to T. A. J.), and Kuopio University foundation (to T. A. J.).
- q-PCR
- quantitative PCR
- HAS
- hyaluronan synthase
- UDP-GlcNAc
- UDP-N-acetylglucosamine
- UDP-GlcUA
- UDP-glucuronic acid
- UDP-Glc
- UDP-glucose
- P2Y14
- Gi-protein-coupled purinergic receptor specific for UDP-sugars
- PTX
- pertussis toxin.
REFERENCES
- 1. Tammi R., Ågren U. M., Tuhkanen A. L., Tammi M. (1994) Hyaluronan metabolism in skin. Prog. Histochem. Cytochem. 29, 1–81 [DOI] [PubMed] [Google Scholar]
- 2. Pienimaki J. P., Rilla K., Fulop C., Sironen R. K., Karvinen S., Pasonen S., Lammi M. J., Tammi R., Hascall V. C., Tammi M. I. (2001) Epidermal growth factor activates hyaluronan synthase 2 in epidermal keratinocytes and increases pericellular and intracellular hyaluronan. J. Biol. Chem. 276, 20428–20435 [DOI] [PubMed] [Google Scholar]
- 3. Turley E. A., Noble P. W., Bourguignon L. Y. (2002) Signaling properties of hyaluronan receptors. J. Biol. Chem. 277, 4589–4592 [DOI] [PubMed] [Google Scholar]
- 4. Hall C. L., Turley E. A. (1995) Hyaluronan: RHAMM mediated cell locomotion and signaling in tumorigenesis. J. Neurooncol. 26, 221–229 [DOI] [PubMed] [Google Scholar]
- 5. Maytin E. V., Chung H. H., Seetharaman V. M. (2004) Hyaluronan participates in the epidermal response to disruption of the permeability barrier in vivo. Am. J. Pathol. 165, 1331–1341 [DOI] [PMC free article] [PubMed] [Google Scholar]
- 6. Tammi R., Pasonen-Seppänen S., Kolehmainen E., Tammi M. (2005) Hyaluronan synthase induction and hyaluronan accumulation in mouse epidermis following skin injury. J. Invest. Dermatol. 124, 898–905 [DOI] [PubMed] [Google Scholar]
- 7. Monslow J., Sato N., Mack J. A., Maytin E. V. (2009) Wounding-induced synthesis of hyaluronic acid in organotypic epidermal cultures requires the release of heparin-binding egf and activation of the EGFR. J. Invest. Dermatol. 129, 2046–2058 [DOI] [PMC free article] [PubMed] [Google Scholar]
- 8. Tammi R. H., Tammi M. I. (2009) Hyaluronan accumulation in wounded epidermis: a mediator of keratinocyte activation. J. Invest. Dermatol. 129, 1858–1860 [DOI] [PubMed] [Google Scholar]
- 9. Tammi R., Ripellino J. A., Margolis R. U., Tammi M. (1988) Localization of epidermal hyaluronic acid using the hyaluronate binding region of cartilage proteoglycan as a specific probe. J. Invest. Dermatol. 90, 412–414 [DOI] [PubMed] [Google Scholar]
- 10. Passi A., Sadeghi P., Kawamura H., Anand S., Sato N., White L. E., Hascall V. C., Maytin E. V. (2004) Hyaluronan suppresses epidermal differentiation in organotypic cultures of rat keratinocytes. Exp. Cell Res. 296, 123–134 [DOI] [PubMed] [Google Scholar]
- 11. Pasonen-Seppänen S., Karvinen S., Törrönen K., Hyttinen J. M., Jokela T., Lammi M. J., Tammi M. I., Tammi R. (2003) EGF upregulates, whereas TGF-beta downregulates, the hyaluronan synthases Has2 and Has3 in organotypic keratinocyte cultures: correlations with epidermal proliferation and differentiation. J. Invest. Dermatol. 120, 1038–1044 [DOI] [PubMed] [Google Scholar]
- 12. Siiskonen H., Törrönen K., Kumlin T., Rilla K., Tammi M. I., Tammi R. H. (2011) Chronic UVR causes increased immunostaining of CD44 and accumulation of hyaluronan in mouse epidermis. J. Histochem. Cytochem. 59, 908–917 [DOI] [PMC free article] [PubMed] [Google Scholar]
- 13. Weigel P. H., DeAngelis P. L. (2007) Hyaluronan synthases: a decade-plus of novel glycosyltransferases. J. Biol. Chem. 282, 36777–36781 [DOI] [PubMed] [Google Scholar]
- 14. Prehm P. (1984) Hyaluronate is synthesized at plasma membranes. Biochem. J. 220, 597–600 [DOI] [PMC free article] [PubMed] [Google Scholar]
- 15. Hubbard C., McNamara J. T., Azumaya C., Patel M. S., Zimmer J. (2012) The hyaluronan synthase catalyzes the synthesis and membrane translocation of hyaluronan. J. Mol. Biol. 418, 21–31 [DOI] [PubMed] [Google Scholar]
- 16. Karvinen S., Pasonen-Seppänen S., Hyttinen J. M., Pienimäki J. P., Törrönen K., Jokela T. A., Tammi M. I., Tammi R. (2003) Keratinocyte growth factor stimulates migration and hyaluronan synthesis in the epidermis by activation of keratinocyte hyaluronan synthases 2 and 3. J. Biol. Chem. 278, 49495–49504 [DOI] [PubMed] [Google Scholar]
- 17. Jokela T. A., Lindgren A., Rilla K., Maytin E., Hascall V. C., Tammi R. H., Tammi M. I. (2008) Induction of hyaluronan cables and monocyte adherence in epidermal keratinocytes. Connect. Tissue Res. 49, 115–119 [DOI] [PubMed] [Google Scholar]
- 18. Sampson P. M., Rochester C. L., Freundlich B., Elias J. A. (1992) Cytokine regulation of human lung fibroblast hyaluronan (hyaluronic acid) production. Evidence for cytokine-regulated hyaluronan (hyaluronic acid) degradation and human lung fibroblast-derived hyaluronidase. J. Clin. Invest. 90, 1492–1503 [DOI] [PMC free article] [PubMed] [Google Scholar]
- 19. Pasonen-Seppänen S. M., Maytin E. V., Törrönen K. J., Hyttinen J. M., Hascall V. C., MacCallum D. K., Kultti A. H., Jokela T. A., Tammi M. I., Tammi R. H. (2008) All-trans retinoic acid-induced hyaluronan production and hyperplasia are partly mediated by EGFR signaling in epidermal keratinocytes. J. Invest. Dermatol. 128, 797–807 [DOI] [PubMed] [Google Scholar]
- 20. Saavalainen K., Tammi M. I., Bowen T., Schmitz M. L., Carlberg C. (2007) Integration of the activation of the human hyaluronan synthase 2 gene promoter by common cofactors of the transcription factors retinoic acid receptor and nuclear factor κB. J. Biol. Chem. 282, 11530–11539 [DOI] [PubMed] [Google Scholar]
- 21. Saavalainen K., Pasonen-Seppänen S., Dunlop T. W., Tammi R., Tammi M. I., Carlberg C. (2005) The human hyaluronan synthase 2 gene is a primary retinoic acid and epidermal growth factor responding gene. J. Biol. Chem. 280, 14636–14644 [DOI] [PubMed] [Google Scholar]
- 22. Jokela T. A., Makkonen K. M., Oikari S., Kärnä R., Koli E., Hart G. W., Tammi R. H., Carlberg C., Tammi M. I. (2011) Cellular content of UDP-N-acetylhexosamines controls hyaluronan synthase 2 expression and correlates with O-GlcNAc modification of transcription factors YY1 and SP1. J. Biol. Chem. 286, 33632–33640 [DOI] [PMC free article] [PubMed] [Google Scholar]
- 23. Vigetti D., Deleonibus S., Moretto P., Karousou E., Viola M., Bartolini B., Hascall V. C., Tammi M., De Luca G., Passi A. (2012) Role of UDP-N-acetylglucosamine (GlcNAc) and O-GlcNAcylation of hyaluronan synthase 2 in the control of chondroitin sulfate and hyaluronan synthesis. J. Biol. Chem. 287, 35544–35555 [DOI] [PMC free article] [PubMed] [Google Scholar]
- 24. Kreda S. M., Seminario-Vidal L., Heusden Cv., Lazarowski E. R. (2008) Thrombin-promoted release of UDP-glucose from human astrocytoma cells. Br. J. Pharmacol. 153, 1528–1537 [DOI] [PMC free article] [PubMed] [Google Scholar]
- 25. Sesma J. I., Esther C. R., Jr, Kreda S. M., Jones L., O'Neal W., Nishihara S., Nicholas R. A., Lazarowski E. R. (2009) Endoplasmic reticulum/Golgi nucleotide sugar transporters contribute to the cellular release of UDP-sugar signaling molecules. J. Biol. Chem. 284, 12572–12583 [DOI] [PMC free article] [PubMed] [Google Scholar]
- 26. Chambers J. K., Macdonald L. E., Sarau H. M., Ames R. S., Freeman K., Foley J. J., Zhu Y., McLaughlin M. M., Murdock P., McMillan L., Trill J., Swift A., Aiyar N., Taylor P., Vawter L., Naheed S., Szekeres P., Hervieu G., Scott C., Watson J. M., Murphy A. J., Duzic E., Klein C., Bergsma D. J., Wilson S., Livi G. P. (2000) A G protein-coupled receptor for UDP-glucose. J. Biol. Chem. 275, 10767–10771 [DOI] [PubMed] [Google Scholar]
- 27. Müller T., Bayer H., Myrtek D., Ferrari D., Sorichter S., Ziegenhagen M. W., Zissel G., Virchow J. C., Jr, Luttmann W., Norgauer J., Di Virgilio F., Idzko M. (2005) The P2Y14 receptor of airway epithelial cells: coupling to intracellular Ca2+ and IL-8 secretion. Am. J. Respir. Cell Mol. Biol. 33, 601–609 [DOI] [PubMed] [Google Scholar]
- 28. Abbracchio M. P., Boeynaems J. M., Barnard E. A., Boyer J. L., Kennedy C., Miras-Portugal M. T., King B. F., Gachet C., Jacobson K. A., Weisman G. A., Burnstock G. (2003) Characterization of the UDP-glucose receptor (re-named here the P2Y14 receptor) adds diversity to the P2Y receptor family. Trends Pharmacol. Sci. 24, 52–55 [DOI] [PMC free article] [PubMed] [Google Scholar]
- 29. Zippel N., Limbach C. A., Ratajski N., Urban C., Luparello C., Pansky A., Kassack M. U., Tobiasch E. (2012) Purinergic receptors influence the differentiation of human mesenchymal stem cells. Stem Cells Dev. 21, 884–900 [DOI] [PubMed] [Google Scholar]
- 30. Fricks I. P., Carter R. L., Lazarowski E. R., Harden T. K. (2009) Gi-dependent cell signaling responses of the human P2Y14 receptor in model cell systems. J. Pharmacol. Exp. Ther. 330, 162–168 [DOI] [PMC free article] [PubMed] [Google Scholar]
- 31. Gao Z. G., Ding Y., Jacobson K. A. (2010) UDP-glucose acting at P2Y14 receptors is a mediator of mast cell degranulation. Biochem. Pharmacol. 79, 873–879 [DOI] [PMC free article] [PubMed] [Google Scholar]
- 32. Burrell H. E., Bowler W. B., Gallagher J. A., Sharpe G. R. (2003) Human keratinocytes express multiple P2Y-receptors: evidence for functional P2Y1, P2Y2, and P2Y4 receptors. J. Invest. Dermatol. 120, 440–447 [DOI] [PubMed] [Google Scholar]
- 33. Greig A. V., Linge C., Cambrey A., Burnstock G. (2003) Purinergic receptors are part of a signaling system for keratinocyte proliferation, differentiation, and apoptosis in human fetal epidermis. J. Invest. Dermatol. 121, 1145–1149 [DOI] [PubMed] [Google Scholar]
- 34. Boukamp P., Petrussevska R. T., Breitkreutz D., Hornung J., Markham A., Fusenig N. E. (1988) Normal keratinization in a spontaneously immortalized aneuploid human keratinocyte cell line. J. Cell Biol. 106, 761–771 [DOI] [PMC free article] [PubMed] [Google Scholar]
- 35. Jokela T. A., Jauhiainen M., Auriola S., Kauhanen M., Tiihonen R., Tammi M. I., Tammi R. H. (2008) Mannose inhibits hyaluronan synthesis by down-regulation of the cellular pool of UDP-N-acetylhexosamines. J. Biol. Chem. 283, 7666–7673 [DOI] [PubMed] [Google Scholar]
- 36. Räbinä J., Mäki M., Savilahti E. M., Järvinen N., Penttilä L., Renkonen R. (2001) Analysis of nucleotide sugars from cell lysates by ion-pair solid-phase extraction and reversed-phase high-performance liquid chromatography. Glycoconj. J. 18, 799–805 [DOI] [PubMed] [Google Scholar]
- 37. Rilla K., Oikari S., Jokela T. A., Hyttinen J. M., Kärnä R., Tammi R. H., Tammi M. I. (2013) Hyaluronan synthase 1 (HAS1) requires higher cellular UDP-GlcNAc concentration than HAS2 and HAS3. J. Biol. Chem. 288, 5973–5983 [DOI] [PMC free article] [PubMed] [Google Scholar]
- 38. Tammi R. H., Passi A. G., Rilla K., Karousou E., Vigetti D., Makkonen K., Tammi M. I. (2011) Transcriptional and post-translational regulation of hyaluronan synthesis. FEBS J. 278, 1419–1428 [DOI] [PubMed] [Google Scholar]
- 39. Harden T. K., Sesma J. I., Fricks I. P., Lazarowski E. R. (2010) Signalling and pharmacological properties of the P2Y receptor. Acta Physiol. (Oxf) 199, 149–160 [DOI] [PMC free article] [PubMed] [Google Scholar]
- 40. Tsukimoto M., Homma T., Ohshima Y., Kojima S. (2010) Involvement of purinergic signaling in cellular response to γ radiation. Radiat. Res. 173, 298–309 [DOI] [PubMed] [Google Scholar]
- 41. Kopf G. S., Wookalis M. J. (1991) ADP-ribosylation of G proteins with pertussis toxin. Methods Enzymol. 195, 257–266 [DOI] [PubMed] [Google Scholar]
- 42. Chung J., Uchida E., Grammer T. C., Blenis J. (1997) STAT3 serine phosphorylation by ERK-dependent and -independent pathways negatively modulates its tyrosine phosphorylation. Mol. Cell Biol. 17, 6508–6516 [DOI] [PMC free article] [PubMed] [Google Scholar]
- 43. Ceresa B. P., Horvath C. M., Pessin J. E. (1997) Signal transducer and activator of transcription-3 serine phosphorylation by insulin is mediated by a Ras/Raf/MEK-dependent pathway. Endocrinology 138, 4131–4137 [DOI] [PubMed] [Google Scholar]
- 44. Ripple M. O., Kim N., Springett R. (2013) Acute mitochondrial inhibition by mitogen-activated protein kinase/extracellular signaling-regulated kinase (MEK) ½ inhibitors regulates proliferation. J. Biol. Chem. 288, 2933–2940 [DOI] [PMC free article] [PubMed] [Google Scholar]
- 45. Bromberg J., Chen X. (2001) STAT proteins: signal tranducers and activators of transcription. Methods Enzymol. 333, 138–151 [DOI] [PubMed] [Google Scholar]
- 46. Shirakata Y. (2010) Regulation of epidermal keratinocytes by growth factors. J. Dermatol. Sci. 59, 73–80 [DOI] [PubMed] [Google Scholar]
- 47. Rilla K., Pasonen-Seppänen S., Rieppo J., Tammi M., Tammi R. (2004) The hyaluronan synthesis inhibitor 4-methylumbelliferone prevents keratinocyte activation and epidermal hyperproliferation induced by epidermal growth factor. J. Invest. Dermatol. 123, 708–714 [DOI] [PubMed] [Google Scholar]
- 48. Ipata P. L., Balestri F., Camici M., Tozzi M. G. (2011) Molecular mechanisms of nucleoside recycling in the brain. Int. J. Biochem. Cell Biol. 43, 140–145 [DOI] [PubMed] [Google Scholar]
- 49. Tammi R., Rilla K., Pienimaki J. P., MacCallum D. K., Hogg M., Luukkonen M., Hascall V. C., Tammi M. (2001) Hyaluronan enters keratinocytes by a novel endocytic route for catabolism. J. Biol. Chem. 276, 35111–35122 [DOI] [PubMed] [Google Scholar]
- 50. Yu H., Pardoll D., Jove R. (2009) STATs in cancer inflammation and immunity: a leading role for STAT3. Nat. Rev. Cancer. 9, 798–809 [DOI] [PMC free article] [PubMed] [Google Scholar]
- 51. Washburn K. B., Neary J. T. (2006) P2 purinergic receptors signal to STAT3 in astrocytes: difference in STAT3 responses to P2Y and P2X receptor activation. Neuroscience 142, 411–423 [DOI] [PubMed] [Google Scholar]
- 52. Bromberg J., Darnell J. E., Jr. (2000) The role of STATs in transcriptional control and their impact on cellular function. Oncogene 19, 2468–2473 [DOI] [PubMed] [Google Scholar]
- 53. Bromberg J. F., Horvath C. M., Besser D., Lathem W. W., Darnell J. E., Jr. (1998) Stat3 activation is required for cellular transformation by v-src. Mol. Cell. Biol. 18, 2553–2558 [DOI] [PMC free article] [PubMed] [Google Scholar]
- 54. Schuringa J. J., Schepers H., Vellenga E., Kruijer W. (2001) Ser727-dependent transcriptional activation by association of p300 with STAT3 upon IL-6 stimulation. FEBS Lett. 495, 71–76 [DOI] [PubMed] [Google Scholar]
- 55. Lee H. K., Jung J., Lee S. H., Seo S. Y., Suh D. J., Park H. T. (2009) Extracellular signal-regulated kinase activation is required for serine 727 phosphorylation of STAT3 in Schwann cells in vitro and in vivo. Korean J. Physiol. Pharmacol. 13, 161–168 [DOI] [PMC free article] [PubMed] [Google Scholar]
- 56. Wakahara R., Kunimoto H., Tanino K., Kojima H., Inoue A., Shintaku H., Nakajima K. (2012) Phospho-Ser727 of STAT3 regulates STAT3 activity by enhancing dephosphorylation of phospho-Tyr705 largely through TC45. Genes Cells 2, 135–145 [DOI] [PubMed] [Google Scholar]
- 57. Sandjeu Y., Haftek M. (2009) Desmosealin and other components of the epidermal extracellular matrix. J. Physiol. Pharmacol. 60, 23–30 [PubMed] [Google Scholar]
- 58. Bianco F., Fumagalli M., Pravettoni E., D'Ambrosi N., Volonte C., Matteoli M., Abbracchio M. P., Verderio C. (2005) Pathophysiological roles of extracellular nucleotides in glial cells: differential expression of purinergic receptors in resting and activated microglia. Brain Res. Brain Res. Rev. 48, 144–156 [DOI] [PubMed] [Google Scholar]
- 59. Moore D. J., Murdock P. R., Watson J. M., Faull R. L., Waldvogel H. J., Szekeres P. G., Wilson S., Freeman K. B., Emson P. C. (2003) GPR105, a novel Gi/o-coupled UDP-glucose receptor expressed on brain glia and peripheral immune cells, is regulated by immunologic challenge: possible role in neuroimmune function. Brain Res. Mol. Brain Res. 118, 10–23 [DOI] [PubMed] [Google Scholar]
- 60. Lee B. C., Cheng T., Adams G. B., Attar E. C., Miura N., Lee S. B., Saito Y., Olszak I., Dombkowski D., Olson D. P., Hancock J., Choi P. S., Haber D. A., Luster A. D., Scadden D. T. (2003) P2Y-like receptor, GPR105 (P2Y14), identifies and mediates chemotaxis of bone-marrow hematopoietic stem cells. Genes Dev. 17, 1592–1604 [DOI] [PMC free article] [PubMed] [Google Scholar]