

Background: Amyloid fibrils form in supersaturated solutions via a nucleation-growth mechanism.
Results: pH and alcohol concentration-dependent phase diagrams showed a marked difference before and after the ultrasonic treatment.
Conclusion: Persistent metastability of supersaturation determined the conformations of insulin.
Significance: The results indicate the importance of an alternative view of amyloid fibrils as supersaturation-limited crystal-like aggregates formed above the solubility.
Keywords: Alcohol, Amyloid, Circular Dichroism (CD), Electron Microscopy (EM), Fourier Transform IR (FTIR), Insulin, Protein Aggregation, Protein Misfolding, Supersaturation, Ultrasonication
Abstract
Amyloid fibrils form in supersaturated solutions via a nucleation and growth mechanism. We proposed that ultrasonication may be an effective agitation to trigger nucleation that would otherwise not occur under the persistent metastability of supersaturation. However, the roles of supersaturation and effects of ultrasonication have not been elucidated in detail except for limited cases. Insulin is an amyloidogenic protein that is useful for investigating the mechanisms underlying amyloid fibrillation with biological relevance. We studied the alcohol-induced amyloid fibrillation of insulin using various concentrations of 2,2,2-trifluoroethanol and 1,1,1,3,3,3-hexafluoro-2-propanol at pH 2.0 and 4.8. Ultrasonic irradiation effectively triggered fibrillation under conditions in which insulin retained persistent supersaturation. Structural analyses by circular dichroism, Fourier transform infrared spectroscopy, transmission electron microscopy, and atomic force microscopy revealed that the dominant structures of fibrils varied between parallel and antiparallel β-sheets depending on the solvent conditions. pH and alcohol concentration-dependent phase diagrams showed a marked difference before and after the ultrasonic treatment, which indicated that the persistent metastability of supersaturation determined the conformations of insulin. These results indicate the importance of an alternative view of amyloid fibrils as supersaturation-limited crystal-like aggregates formed above the solubility limit.
Introduction
Amyloid fibrils are misfolded and self-assembled aggregates of proteins that are ∼10 nm in diameter and several micrometers in length, and have a characteristic cross-β structure in which the β-strands are arranged perpendicularly to the fibril long axis (1–4). They have been associated with the pathology of more than 30 serious disorders such as Alzheimer disease, prion disease, type II diabetes, and dialysis-related amyloidosis (2, 5). On the other hand, amyloid-like structures are also utilized for beneficial purposes in nature, and these are known as functional amyloids (2, 6, 7). Because many structurally unrelated proteins can form amyloid fibrils, amyloid fibrillation (i.e. the formation of amyloid fibrils) is considered to be a generic property of polypeptide chains (2).
There are two distinct, but complementary views to explain why and how amyloid fibrils form. One assumes that fibrils form by specific interactions distinct from those stabilizing native structures (3, 8, 9). The atomic structures of amyloid microcrystals revealed that registered and tightly packed intermolecular interactions constitute dry steric zippers. Genome-wide searches of potential sequences with the ability to make such amyloidogenic structures have coined the term “amylome,” which suggests that most proteins have hidden amyloidogenicity (10). Main chain-dominated amyloid structures have focused on the importance of ordered hydrogen bond network (11–13). These studies have been useful for developing drugs that can prevent the tight intermolecular interactions of amyloidogenic proteins (3, 4).
The other view originated from the similarities observed in prion propagation and the crystallization of substances (14–16), and later extended to explain the propagation of amyloid fibrils and mechanisms underlying amyloidoses (17, 18). Both prion diseases and crystallization occur after a long latent period and propagate rapidly. Thus, seeding is an efficient approach that escapes nucleation and accelerates the propagation of various types of amyloidoses including prion diseases and crystallization. Moreover, the presence of multiple prion strains can be explained by the same mechanism as that used for the various morphologies of crystals. On the basis of this analogy, one of the critical factors for determining amyloidogenicity is solubility or the critical concentration of the responsible proteins, which is equal to the equilibrium solubility of monomers.
Because both views are linked and complementary, specific interactions that stabilize amyloid structures as well as the concentration of amyloidogenic proteins that determines the strength of interactions have to be considered. On the other hand, one of the most important factors associated with solubility, but not specific interactions is “supersaturation” (16–19). Supersaturation, an established concept in solution chemistry and crystallography (20–23), refers to a non-equilibrium phase in which proteins remain soluble for an extended period because of a high free energy barrier to nucleation even though the solute concentration is higher than the thermodynamic solubility. Supersaturation is remarkably stable under metastable conditions in which the solute concentration is slightly above the solubility, and seeding is essential to break supersaturation. Under labile conditions in which the driving forces of precipitation increase, spontaneous crystallization can occur after a certain period of lag time. Further increases in driving forces have been shown to result in the rapid breakdown of supersaturation, leading to the formation of glassy amorphous aggregates (19). The importance of supersaturation has recently been reported in the context of widespread aggregation and neurodegenerative diseases (24). Although the physicochemical mechanism of supersaturation remains unclear, we have suggested that ultrasonication is one of the most powerful agitations breaking the otherwise persistent metastability of supersaturation (19, 23, 25–27).
Alcohols are moderately hydrophobic solvents useful for addressing the role of water in the conformation and stability of proteins (28). In the past decade, studies have focused on the alcohol-induced formation of amyloid fibrils (29–34). The properties elucidated under those non-physiological conditions are valuable for understanding the driving forces of amyloid fibrillation under physiological conditions, once they are extrapolated back to the physiological conditions. Moreover, strongly amyloidogenic conditions in the presence of alcohols are likely to mimic the local amyloidogenic environments in biological systems such as phospholipid membrane surface or highly crowded cytoplasm, where solubility of proteins decreases markedly.
We previously used hen egg white lysozyme and water/alcohol mixtures to demonstrate the role of supersaturation for determining amyloidogenicity (35). Insulin fibril is one of the most extensively studied fibrils because of its biological relevance (31, 36–38). In the present study, we showed that solubility and supersaturation-limited amyloid fibrillation was true for human insulin, addressing the alternative view of amyloid fibrils.
EXPERIMENTAL PROCEDURES
Materials and Protein Preparation
Recombinant human insulin (Roche Diagnostic GmbH) was purchased from Nacalai Tesque (Kyoto, Japan) and used without further purification. ThT4 was obtained from Wako Pure Chemical Industries, Ltd. TFE, HFIP, and other reagents were obtained from Nacalai Tesque (Kyoto, Japan).
Insulin was dissolved in Milli-Q water at 15 and 30 mg ml−1. The protein solutions were then diluted with alcohols to the desired alcohol concentrations with a final sodium acetate concentration of 25 mm (pH 4.8 without alcohols) or a hydrochloric acid concentration of 10 mm. Although alcohols increased the pH because of their hydrophobicity, we did not adjust the pH. The apparent pH values in 25 mm sodium acetate buffer in 10% TFE and HFIP were all 4.9, and in 50% TFE and HFIP were 5.1 and 4.9, respectively. The apparent pH values in 10 mm hydrochloric acid solution in 10% TFE and HFIP were all 2.2. It should be noted that the alcohol concentrations in this article are (v/v) percentages. The concentration of insulin was determined spectrophotometrically using absorbance at 276 nm with an extinction coefficient of 1.0 mg ml−1 (37). The final concentrations of insulin used were 1.5 and 3.0 mg ml−1. Unless otherwise mentioned, the insulin concentration was 1.5 mg ml−1.
Chemical modification of insulin after ultrasonication treatment was checked by HPLC. After a 3-h ultrasonic treatment with cycles of 1-min ultrasonication and 2-min quiescence, the elution time of insulin did not change although a slight change of peak shape was noted. The results indicate that chemical degradation of insulin induced by ultrasonication was minimal and does not affect our interpretation.
Monitoring of Fibrillation with Microplates
Protein solutions with a total volume of 200 μl, containing 1.5 mg ml−1 insulin, 5 μm ThT, and TFE or HFIP at various concentrations (0–70%), were incubated in each well of a microplate at 37 °C in the absence or presence of agitation. Using the method established in our previous studies (25, 27), the microplate placed at the center of a water bath-type ultrasonic transmitter (ELESTEIN SP070-PG-M; Elekon, Chiba, Japan) was ultrasonicated from three directions. The microplate was subjected to ultrasonication cycles for 1 min at 9-min intervals, and maintained at 37 °C throughout the experiment. The power and output of sonication were set to 17–20 kHz and 350 W, respectively. ThT fluorescence was measured at suitable times using a MTP810 microplate reader (CORONA ELECTRIC, Ibaragi, Japan) with excitation wavelengths at 450 nm.
Regarding the real-time monitoring of seed-dependent fibrillation, protein solutions with a total volume of 200 μl, containing 1.5 mg ml−1 insulin, 5 μm ThT, and 20% TFE or 10% HFIP were incubated in each well of a microplate at 37 °C in the absence of agitation. Fibrillation in the absence and presence of 1% (w/w) seed fibrils was examined using a SH9000 microplate reader (CORONA ELECTRIC, Ibaraki, Japan) with an excitation wavelength at 445 nm. Fibril seeds, i.e. short insulin fibrils, were prepared by the fragmentation of mature fibrils with a manual sonication treatment. The microplates were sealed tightly to prevent the volatilization of alcohols.
Circular Dichroism Measurements
CD measurements of insulin solutions were performed at 0.15 mg/ml in 10 mm HCl or 25 mm sodium acetate buffer (pH 4.8) containing various alcohol concentrations using a Jasco J820 spectropolarimeter at 37 °C. The sample solution (1.5 mg ml−1) was diluted 10-fold for far-UV CD experiments. Far-UV CD spectra were recorded using a quartz cuvette with 1-mm path length. The spectra were expressed as the mean residue ellipticity, [θ] (deg cm2 dmol−1), after subtracting the solvent background.
Thioflavin T Assay at Neutral pH
Aliquots (5 μl) of the sample solutions after reactions at pH 2.0 or 4.8 were added to 1 ml of the 50 mm glycine-NaOH buffer (pH 8.5) containing 5 μm ThT. Fibril formation was assayed based on the ThT intensity at 485 nm excited at 445 nm using a Hitachi F4500 fluorescence spectrophotometer.
Determination of Concentrations of Residual Monomers
After reactions, sample solutions were centrifuged at 15,000 × g and 37 °C for 30 min. The concentrations of residual monomers in the supernatant were then determined spectrophotometrically after filtration using a Millex-LG Sterilizing Filter Unit obtained from Millipore Corp. (Billerica, MA).
Atomic Force Microscopy
Regarding the AFM measurements, sample solutions of 1.5 mg ml−1 insulin after reactions were diluted 10-fold and a 15-μl aliquot was spotted on a freshly cleaved mica plate. The residual solution was removed with compressed air and air dried for 10 s. AFM images were obtained using a Nano Scope IIIa (Digital Instruments), as reported previously (23, 39).
Transmission Electron Microscopy
Transmission electron microscopy measurements were performed on a HITACHI H-7650 transmission microscope (Tokyo, Japan). Samples were dripped on copper grids (400-mesh) covered by a carbon-coated collodion film (NISSHIN EM Corporation, Tokyo, Japan) with no dilution, and were then negatively stained with 2% (w/v) uranyl acetate solution. The observation magnification was ×20,000.
Fourier Transform Infrared Spectroscopy
FTIR measurements were carried out on a Bruker Equinox 55 (Bruker, Germany) instrument equipped with a MCT detector in CaF2 cells with 100-μm Teflon spacers at 1 cm−1 resolution. To avoid the contribution of water vapor peaks to the spectra, the instrument was purged with dry air. Two stock solutions were prepared by dissolving the lyophilized insulin powder at a concentration of 15 mg ml−1. In pD 2.0 samples, insulin was dissolved in D2O containing ∼10 mm DCl with the pD adjusted to 2.0 by taking into account the isotope effect (pD = pD* + 0.4, where pD* is the pH meter reading). In the pD 4.8 experiments, insulin was dissolved in pure D2O to avoid the immediate precipitation observed in acetate buffer at pH 4.8 at high protein concentrations. Insulin samples were prepared from stock solutions by mixing with appropriate volumes of D2O buffers, NaCl, and TFE or HFIP. The recorded spectra were corrected by subtracting of the appropriate buffer spectra and removing the remaining vapor peaks.
To estimate the secondary structure, peak fitting of the amide I′ band (1600–1700 cm−1) by Gaussian-shaped components was performed on the non-deconvoluted spectra (40). The positions and number of the components were determined from second derivative analysis of the spectra. To treat the borders of the amide I region appropriately, the fitting was carried out in the 1570–1730 cm−1 wave number range. The peak positions were fixed in the fitting. The width of each Gaussian curve was maximized in 20 cm−1. The contribution of each component to the amide I′ band was evaluated by integrating the area under the curve and then normalizing to the total area of the amide I′ band. We assigned the components of amide I′ to the secondary structure based on our previous study (40), as follows: 1615–1640 cm−1, β-sheet; 1670–1685 cm−1, high frequency contribution of the antiparallel β-sheet; 1640–1650 cm−1, disordered structure; 1645–1655 cm−1, α-helix; 1655–1670 cm−1, β-turn. The range of 1600–1613 cm−1 was assigned to side chain contributions.
RESULTS
Alcohol-induced Transitions under Quiescent Conditions
The effects of TFE and HFIP on insulin at 1.5 mg ml−1 were examined at pH 2.0 and 4.8, in which the pH value was measured in the absence of alcohol (see “Experimental Procedures”), by CD spectroscopy under quiescent conditions (Fig. 1). The stock solution was diluted to 0.15 mg ml−1, ∼1 min, and ∼15 h after the sample preparation at 37 °C, and the spectra were measured. In the absence of alcohols, native insulin, which was predominantly composed of α-helical structures, showed a CD spectrum with minima at 208 and 222 nm and an ellipticity of approximately −10,000 at 222 nm at both pH 2.0 and 4.8 (Fig. 1, A–D). Because alcohol-induced denaturation led to an α-helical conformation, the far-UV CD was not very sensitive for conformational transitions. Thus, we also measured near-UV CD spectra at various alcohol concentrations at pH 2.0 and 4.8 (Fig. 1, E–H). The presence of low concentrations of HFIP caused the aggregation and precipitation of insulin at pH 4.8. Under other conditions, the intense negative peak at 275 nm, which was representative of the native structure, disappeared with an increase in the concentration of alcohols. The addition of HFIP at more than 20% at pH 4.8 recovered solubility, as indicated by the CD spectra and transition curves (Fig. 1, D, H, and L).
FIGURE 1.

TFE or HFIP-dependent conformational transitions of insulin immediately after sample preparation. A–D, far-UV CD spectra in the presence of various concentrations of TFE (A and B) or HFIP (C and D) at pH 2 (A and C) and 4.8 (B and D). E–H, near-UV CD spectra in the presence of various concentrations of TFE (E and F) or HFIP (G and H) at pH 2.0 (E and G) and 4.8 (F and H). I–L, transition curves dependent on TFE (I and J) or HFIP (K and L) concentrations at pH 2 (I and K) or 4.8 (J and L) monitored by ellipticity at 222 or 275 nm. Measurements were performed immediately after sample preparation.
The plots of ellipticity at 275 nm against alcohol concentrations showed that cooperative denaturation transition occurred immediately after the addition of TFE at pH 2.0 and 4.8 or HFIP at pH 2.0 (Fig. 1, I–K). Although the gradual increase observed after the major transition prevented the exact determination of the midpoint alcohol concentration they were ∼5% for TFE at pH 2.0, ∼15% for TFE at pH 4.8, and ∼15% for HFIP at pH 2.0. On the other hand, the transitions monitored by ellipticity at 222 nm were monotonous with a gradual increase in amplitude, which indicated a slight increase in the α-helical content.
No significant change was observed in any solution following incubation for ∼15 h without agitation. These results indicated that the CD spectra and transition curves shown in Fig. 1 represented conformational transitions under quiescence that appeared to be dependent on pH and TFE or HFIP concentrations.
Alcohol-induced Transitions under Ultrasonication
We then examined the effects of ultrasonic irradiation on insulin solutions at various alcohol/water mixtures using Eppendorf tubes. Insulin solutions at 1.5 mg ml−1 were irradiated with 1-min ultrasonication cycles followed by 2-min quiescence for 15 h. The reaction products were analyzed by measuring the far-UV CD spectra and ThT fluorescence.
A significant change was observed in the far-UV CD spectra at pH 2.0 in the presence of various concentrations of TFE (Fig. 2A). In the absence of alcohol, the spectrum for the α-helical conformation transformed to a spectrum with a minimum at 225 nm, which suggested the formation of a β-structure. The spectra exhibited a minimum at 200–205 nm under other conditions. Although these spectra were distinct from that of a typical β-structure with a minimum at 218–225 nm, ThT fluorescence after ultrasonication showed a marked increase at all TFE concentrations, which suggested the formation of amyloid fibrils (Fig. 2I). Consistent with this result, the remaining monomer concentration after centrifugation decreased significantly (Fig. 2I). Transmission electron microscopy (Fig. 3) and AFM images (data not shown) confirmed the formation of amyloid fibrils, which were short in length due to the effects of ultrasonication.
FIGURE 2.

TFE or HFIP-dependent conformational transitions of insulin after ultrasonic irradiation. A–D, far-UV CD spectra in the presence of various concentrations of TFE (A and B) or HFIP (C and D) at pH 2 (A and C) and 4.8 (B and D). E–H, transition curves dependent on the TFE (E and F) or HFIP (G and H) concentrations at pH 2.0 (E and G) or 4.8 (F and H) monitored by ellipticity at 200 or 222 nm. I–L, transition curves dependent on the TFE (I and J) or HFIP (K and L) concentrations at pH 2 (I and K) or 4.8 (J and L) monitored by ThT fluorescence or the remaining protein concentration after centrifugation. ThT assays were performed at pH 8.5.
FIGURE 3.
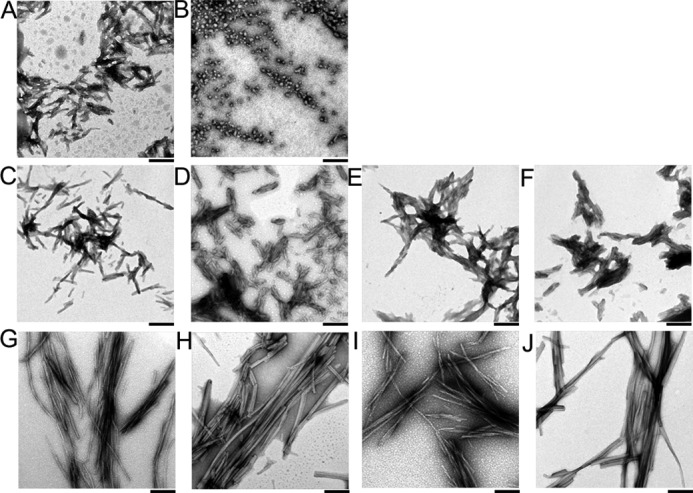
EM images of various conformational states of insulin. A, fibrils at pH 2.0 with no alcohol. B, amorphous aggregates at pH 4.8 with no alcohol. C and G, fibrils at pH 2.0 and 20% TFE. D and H, fibrils at pH 4.8 and 20% TFE. E and I, fibrils at pH 2.0 and 10% HFIP. F and J, fibrils at pH 4.8 and 10% HFIP. Insulin fibrils were prepared by ultrasonication (A–F) or seeding (G–J). The black bars indicate 1 μm.
The effects of ultrasonic pulses were also examined at pH 4.8 in the presence of various concentrations of TFE and at pH 2.0 and 4.8 in the presence of various concentrations of HFIP (Fig. 2). Under most conditions, except for 0–10% TFE at pH 4.8, 30–40% HFIP at pH 2.0, and 70% HFIP at pH 4.8, ultrasonic irradiation induced ThT-positive conformations with distinct CD spectra from those of the α-helical conformations (Fig. 2). Transmission electron microscopy (Fig. 3) or AFM images (data not shown) revealed the formation of amyloid fibrils. Moreover, the remaining soluble protein concentrations after centrifugation decreased in a manner complementary to the increase observed in ThT fluorescence, which supported the formation of amyloid fibrils (Fig. 2, I–L).
Analysis of Secondary Structures by CD and FTIR
Although various types of the CD spectra of fibrils, as shown in Fig. 2, may arise from the parallel or antiparallel types of β-sheets, the lengths of β-strands, or twisting of β-sheets, it was difficult to characterize these properties from the CD spectra because of the absence of CD spectrum analysis software useful for such purposes. Nevertheless, by carefully comparing the insulin CD spectra with those of globular proteins and amyloid fibrils with known structures, we distinguished three groups of secondary structures.
(i) Parallel β-Sheet Dominated Structure
The spectra contained a negative minimum at ∼215–225 nm and a positive maximum at 200 nm or lower wavelengths. The amplitude of the minimum was relatively large. Most characteristic samples were 0 and 20% HFIP at pH 2, and 50% HFIP at pH 4.8 (Figs. 2 and 4). The CD spectrum of amyloid-β fibrils with parallel β-sheets showed a similar spectrum (41). Fibrils of β2-microglobulin formed at pH 2.5 also show this spectral shape and were interpreted as parallel β-sheet structure (25, 40).
FIGURE 4.

Comparison of the CD and FTIR spectra of various conformational states of insulin. The secondary structure analysis of insulin fibrils were performed by CD (A, C, E, G, I, K, and M) or FTIR (B, D, F, H, J, L, and N) spectra. The native state (A and B) and fibrils (C and D) at pH 2.0 with no alcohol are shown. E and F, amorphous aggregates at pH 4.8 with no alcohol. G and H, fibrils at pH 2.0 and 20% TFE. I and J, fibrils at pH 4.8 and 10% TFE. K and L, fibrils at pH 2.0 and 10% HFIP. M and N, fibrils at pH 4.8 and 10% HFIP. In panels B, D, F, H, J, L, and N, the dotted lines represent the raw data and the solid lines represent the fitted data on the basis of deconvolution (broken lines).
(ii) Antiparallel β-Sheet Dominated Structures
Antiparallel β-sheets often showed a minimum at ∼220–230 nm with low amplitude and a larger maximum at ∼200 nm or higher wavelengths. Representative samples were fibrils in 20–30% TFE or 10–20% HFIP at pH 4.8 (Figs. 2 and 4). The characteristic CD spectra of native β2-microglobulin were reported previously (13).
(iii) Antiparallel Twisted β-Sheet
Although the CD spectra with a minimum at 200–205 nm were at first unusual for amyloid fibrils with a dominant cross-β structure, there were several examples of β-structure-dominated proteins with similar far-UV CD spectra, e.g. a soybean trypsin inhibitor with a twisted antiparallel β-sheet (42). Insulin showed this spectral shape in the presence of TFE at pH 2.0 and 10% HFIP at pH 2.0 (Figs. 2 and 4, G and K).
We tentatively assigned the parallel and antiparallel β-structures from the CD spectra of insulin fibrils observed under various water/alcohol mixtures. However, types i and ii were difficult to distinguish and both structures may even coexist. Moreover, some spectra such as those at pH 4.8 in the presence of 30–40% HFIP showed very large amplitudes, which made any structural estimation problematic.
We then used FTIR, one of the alternative methods, to examine the secondary structures of proteins (40, 43). The advantages of FTIR spectra are that β-sheet structures can be distinguished from other structures more clearly than CD and that antiparallel β-structures can also be identified, depending on the presence of a high frequency peak at 1670–1685 cm−1 (40). We measured the FTIR spectra for the native state at pH 2.0 in the absence of alcohol, fibrils under the same conditions, fibrils in the presence of 20% TFE at pH 2.0 or 4.8, and fibrils in 10% HFIP at pH 2.0 or 4.8 (Fig. 4, Table 1). A protein concentration of 5 mg ml−1 was used for the FTIR measurements and the samples were prepared by seeding with seeds at 1% (w/w) under stirring.
TABLE 1.
Secondary structure assignments of insulin fibrils on the basis of FTIR spectra under representative conditions
| Conditions | Major components | Wave number | Ratio | Structure assignment |
|---|---|---|---|---|
| cm−1 | ||||
| pH 2.0, no alcohol | Native monomers α-helix | 1682 | 0.02 | High frequency β |
| 1667 | 0.3 | Turn | ||
| 1650 | 0.4 | α-Helix | ||
| 1644 | 0.08 | Irregular | ||
| 1633 | 0.2 | Antiparallel β | ||
| pH 2.0, no alcohol | Parallel β | 1666 | 0.03 | Turn |
| 1661 | 0.01 | Turn | ||
| 1651 | 0.01 | Helix | ||
| 1647 | 0.4 | Irregular | ||
| 1627 | 0.48 | Parallel β | ||
| 1618 | 0.07 | Antiparallel β | ||
| pH 4.8, no alcohol | Amorphous aggregate irregular | 1682 | 0.04 | High frequency β |
| 1667 | 0.19 | Turn | ||
| 1655 | 0.17 | Turn/helix | ||
| 1644 | 0.31 | Irregular | ||
| 1634 | 0.24 | Antiparallel β | ||
| 1622 | 0.04 | Antiparallel β | ||
| pH 2.0, 20% TFE | Antiparallel β | 1669 | 0.14 | Turn/high frequency β? |
| 1657 | 0.08 | Turn/helix | ||
| 1648 | 0.06 | Helix/irregular | ||
| 1637 | 0.26 | Antiparallel β | ||
| 1630 | 0.23 | Parallel β? | ||
| 1619 | 0.23 | Antiparallel β | ||
| pH 4.8, 20% TFE | Antiparallel β | 1678 | 0.04 | High frequency β |
| 1664 | 0.12 | Turn | ||
| 1650 | 0.09 | Helix | ||
| 1644 | 0.17 | Irregular | ||
| 1632 | 0.38 | Antiparallel β | ||
| 1618 | 0.2 | Antiparallel β | ||
| pH 2.0, 10% HFIP | Antiparallel β | 1665 | 0.15 | Turn/high frequency β |
| 1648 | 0.14 | Helix/irregular | ||
| 1635 | 0.3 | Antiparallel β | ||
| 1626 | 0.08 | Parallel β | ||
| 1620 | 0.33 | Antiparallel β | ||
| pH 4.8, 10% HFIP | Antiparallel β | 1677 | 0.09 | High frequency β |
| 1658 | 0.28 | Turn | ||
| 1647 | 0.08 | Irregular/helix | ||
| 1634 | 0.33 | Antiparallel β | ||
| 1618 | 0.22 | Antiparallel β |
Based on the deconvolution analysis of the spectra, we assigned the major secondary components for the respective states (Fig. 4, Table 1). The initial native state at pH 2.0 in the absence of alcohol showed an α-helical structure with the main components at 1644 and 1650 cm−1. Upon ultrasonic irradiation under the same conditions, insulin formed fibrils with parallel β-structures with negligible or no high frequency component. The main β-sheet component manifested at 1627 cm−1. Therefore, when components appeared at 1626–1627 cm−1 in the other spectra, we considered them to be parallel β-structures.
In the presence of 20% TFE or 10% HFIP at pH 2, other characteristic β-sheet components appeared at ∼1635–1637 and 1618–1620 cm−1, which were considered to be antiparallel β-sheets (Fig. 4). Insulin instantly precipitated at pH 4.8 without alcohol, which resulted in a weak CD signal (Fig. 1). The infrared spectrum showed a broad amide I′ band with a mixture of a significant turn, α-helix, irregular structure, and antiparallel β-structure with high frequency component, which when taken together, indicated amorphous aggregates (Fig. 4, E and F). In summary, based on CD and FTIR, we could consistently assign the dominant β-structure contents of insulin amyloid fibrils (Table 1, see also Fig. 6, below).
FIGURE 6.

Phase diagrams of the alcohol- and pH-dependent conformational states of insulin at 1.5 mg ml−1 before and after ultrasonication obtained with TFE or HFIP. Phase diagrams obtained before (A and B) and after (C and D) ultrasonication are represented by dominant species even when distinct states coexisted, as indicated by symbols (●, ♦, ■, ▴, ▾). Vivid blue, native monomers (●); light blue, unfolded monomers (♦); green, amorphous aggregates (■); yellow, parallel β fibrils (▴); red, antiparallel β fibrils (▾).
Kinetics of Fibrillation
We monitored the kinetics of fibrillation directly on 96-well microplates by applying 1-min ultrasonication cycles followed by 9-min quiescence (Fig. 5). Each well of the microplate contained a sample solution of 0.2 ml with 5 μm ThT. After ultrasonic irradiation of the microplate in the ultrasonicator, the fibrillation was assessed by a microplate reader at a fluorescence intensity of 490 nm with an excitation wavelength of 450 nm. Under our experimental ultrasonic irradiation conditions, amyloid fibrillation occurred after a lag time of several hours (Fig. 5, A–D). However, high concentrations of alcohol, in particular HFIP, and low pH prevented accurate measurements. We consider that there may be optimal alcohol concentrations for fibrillation at moderate concentrations of TFE and HFIP, as demonstrated for hen egg lysozyme, for which the fibrillation assays were performed carefully by using a larger sample volume and taking an aliquot for optimized assays (35).
FIGURE 5.
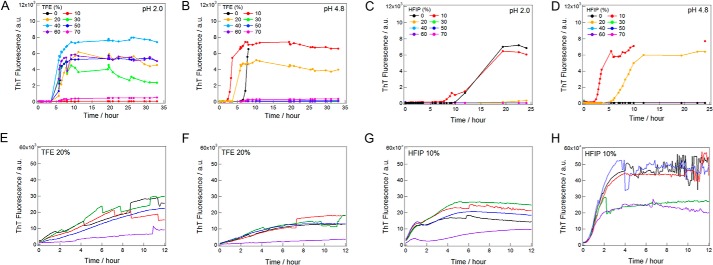
Kinetics of ultrasonication-triggered and seed-dependent insulin fibrillation under various alcohol conditions. Ultrasonication-dependent fibrillation was monitored at various concentrations of TFE (A and B) or HFIP (C and D) at pH 2.0 (A and C) or 4.8 (B and D). Seed-dependent reactions were monitored at 20% TFE and pH 2.0 (E) or 4.8 (F), or at 10% HFIP and pH 2.0 (G) or 4.8 (H). Kinetics were measured on 96-well microplates with a sample volume of 200 μl. Because higher concentrations of TFE or HFIP prevented the measurement of ThT fluorescence, we only showed the data obtained following successful kinetic monitoring. Curves in panels E-H with different colors indicate the results at different wells.
We also performed seeding experiments in 20% TFE with a microplate, in which seed fibrils at 1% (w/w) were added to monomers at 1.5 mg ml−1 under the same conditions of fibrillation (Fig. 5, E–H). We monitored seed-dependent fibrillation without ultrasonic irradiation. We could monitor the rapid fibrillation without a lag time that was saturated in several hours. The results confirmed the seeding potential of fibrils prepared by ultrasonication. Transmission electron microscopy images (Fig. 3, G–J) confirmed the formation of amyloid fibrils, which were longer than those prepared by ultrasonication (Fig. 3, C–F) because of the absence of ultrasonication-dependent fragmentation.
Phase Diagram of Insulin Fibrillation
We constructed phase diagrams of conformational states on the basis of the TFE- or HFIP-dependent fibrillations of insulin at pH 2.0 and 4.8 (Fig. 6). Two-phase diagrams were made for each alcohol: the one before applying ultrasonic irradiation represented an apparent phase diagram under supersaturation, whereas the other after ultrasonic irradiation represented thermodynamic conformational states.
Regarding TFE under quiescence conditions, amorphous aggregates formed at 0–10% TFE and pH 4.8 (Fig. 6A), although they were not visible in the CD measurements after dilution (Fig. 1F). Insulin was apparently soluble for other regions, where insulin assumes the native α-helical conformation at 0% TFE at pH 2.0. The metastability of supersaturation was broken upon ultrasonic irradiation, which produced thermodynamically stable fibrils at both pH 2.0 and 4.8 (Fig. 6C). According to the CD and FTIR analyses, fibrils were dominantly parallel β structures at pH 2 in the absence of alcohols, whereas antiparallel β structures prevailed for other regions (Fig. 4).
As for HFIP in the absence of ultrasonic irradiation, amorphous aggregates formed at 0–10% HFIP and pH 4.8 (Fig. 6B). Insulin was apparently soluble for other regions, where insulin assumes the native α-helical conformation at 0–5% HFIP at pH 2.0. These were similar to the TFE-dependent apparent phase diagram of insulin (Fig. 6A). Upon ultrasonic irradiation, insulin was transformed to fibrils between 0–20 and 50–70% HFIP at pH 2.0 and 10–60% HFIP at pH 4.8 (Fig. 6D). On the other hand, insulin stayed soluble between 30 and 40% HFIP at pH 2.0 and 70% HFIP at pH 4.8. According to the CD and FTIR analyses, both parallel and antiparallel β structures existed depending on the HFIP concentration. Therefore, they may coexist even under the same solvent conditions.
We also performed a series of experiments at 3.0 mg ml−1 insulin at pH 2.0 and 4.8 in the presence of various concentrations of TFE and HFIP (data not shown). The results were similar to those obtained at 1.5 mg ml−1 insulin, although the higher insulin concentration slightly decreased the alcohol concentration required to induce the fibrils and no soluble region after ultrasonication. At 3.0 mg ml−1 insulin at pH 4.8, no parallel β was observed. Except for these changes, the phase diagrams at 3.0 mg ml−1 insulin (Fig. 7) were similar to those at 1.5 mg ml−1 (Fig. 6).
FIGURE 7.

Phase diagrams of the alcohol- and pH-dependent conformational states of insulin at 3 mg ml−1 before and after ultrasonication obtained with TFE or HFIP. Phase diagrams obtained before (A and B) and after (C and D) ultrasonication are represented by dominant species even when distinct states coexisted, as indicated by symbols (●, ♦, ■, ▴, ▾) as defined in the legend to Fig. 6.
DISCUSSION
Significance of Supersaturation
Among the two types of complementary views used to consider the mechanism underlying amyloid fibrillation, a series of recent advancements in structural studies have focused on the former view in which specific intermolecular interactions produce tightly packed steric zipper-type amyloid architectures (3, 4, 9–13). Although the latter view in which fibrillation is a process that is similar to that crystallization of substances (14–18) has been proposed at an early stage based on the findings of amyloid research, we did not consider the reality and importance of this similarity to have been documented in sufficient detail. More importantly, this similarity argues the critical roles of solubility and supersaturation to make ordered amyloid structures without tight packing.
According to the latter view, the solubility (i.e. critical concentration) of monomeric proteins is one of the most important factors determining amyloidogenicity. Because thermodynamic solubility depends on concentration, the protein concentration used in experiments is critical for predicting the amyloidogenicity of proteins. In other words, even highly amyloidogenic proteins stay soluble and preformed fibrils can dissolve into monomers below the critical concentration (7, 39). The critical concentration is a function of various factors including the conformations of monomers and fibrils as well as the hydrophobicities of amino acid residues.
Previous studies showed that crystal-like ordered states including amyloid fibrils do not form rapidly because of the high free energy of nucleation (19, 23), which leads to supersaturation in which, in the absence of agitations to induce nucleation, the solutes may retain apparent solubility indefinitely under the conditions of metastability. On the other hand, when solvent-excluded conformations are glassy amorphous aggregates, which is common for larger denatured proteins, aggregation has been shown to occur rapidly without a lag phase. The transition from crystal-like amyloid fibrillation to glass-like amorphous aggregation even occurs for the same protein when changes in the solvent conditions favor precipitation (e.g. increased NaCl concentration (19)).
Although supersaturation is an important factor that determines the amyloidogenicity of proteins, it has often been considered to be a trivial factor that retards the initiation of fibrillation. Supersaturated regions have been divided into metastable and labile regions in the field of the crystallization of substances (19, 21, 23, 44). In the metastable region in which the solute concentration is slightly above solubility, spontaneous nucleation does not occur indefinitely and seeding is essential to break supersaturation and form crystals. However, nucleation can occur after a certain lag time in the labile region. A further increase in the driving force of precipitation has been shown to lead to a glass region in which solutes precipitate rapidly without a lag time (see Fig. 5 of Yoshimura et al. (19)).
Although amyloid fibrillation is expected to occur after a certain lag time, an analogy with crystallization suggests that it does not occur indefinitely forever under the metastability of supersaturation. Moreover, the mechanism underlying spontaneous fibrillation in the labile region remains unclear and the simple mechanism of nucleation-dependent crystallization cannot account for persistent metastability. Various competing pathways have been considered to lead to crystals as well as various amorphous aggregates. The stabilization of monomeric or oligomeric states by unknown mechanisms may be involved in the persistence of supersaturation.
Supersaturation in Biological Systems
We have proposed the persistent metastability of supersaturation with insulin under various conditions of water/alcohol mixtures. Strong agitation with ultrasonication is needed to break metastability. The same effects may be induced by other types of agitations such as stirring. One possible mechanism is the condensation of amyloidogenic proteins at the water/air interface produced by ultrasonication-induced cavitation or stirring (19, 23). Local increases in the protein concentration at the water/air interface have been shown to lead to glassy aggregates, in which a template-competent conformation may emerge. Various factors increase the local concentration of amyloidogenic precursors in biological systems, including binding to phospholipid membranes, local crowding in cells, or partial unfolding in low pH environments (45, 46). Once the nucleus or amyloid-competent aggregates are formed, supersaturation breaks, followed by the explosive propagation of amyloid fibrillation.
Ciryam et al. (24) recently reported that widespread aggregation and neurodegenerative diseases were associated with supersaturated proteins. On the basis of a genome-wide search of proteins, they showed that supersaturated proteins, whose cellular concentrations were higher than their solubilities, represented a metastable subproteome involved in pathological aggregation. They further suggested that it may soon become possible to use supersaturation measures to quantitatively assess the vulnerability of the human proteome to aggregation and the risk of neurodegenerative diseases in individuals over the course of their lives. Thus, our results demonstrating the metastability of supersaturated insulin solutions under a wide range of solvent conditions will be important for a physicochemical understanding of the principles leading to pathological aggregations in biological systems.
Conclusion
We showed that solubility of insulin decreases markedly coupled with the alcohol-induced denaturation at moderate concentrations of water/alcohol mixtures of TFE and HFIP. However, because of the metastability of supersaturation, denatured insulin remained soluble. Disrupting metastability through strong agitation, such as ultrasonication, results in the production of crystal-like amyloid fibrils. Solubility and supersaturation-dependent amyloid fibrillation will apply to fibrillation under physiological conditions without alcohols in which biological environments including membranes and crowding in cellular environments play important roles in decreasing solubility. On the basis of the new view that amyloid fibrillation is a consequence of breaking supersaturation, we suggest that distinguishing the metastability of supersaturation and rapid glassy transition will be a next stage for clarifying the mechanism underlying protein aggregation and its biological impacts. Oligomers have been proposed to be directly responsible for cytotoxity (47–49). We assume oligomers to be another type of protein aggregates produced above the solubility limit. It will be important to understand oligomeric species in relationship to solubility and supersaturation.
Acknowledgment
We thank Elemér Vass (Eötvös University) for providing the FTIR machine for the experiments.
This work was supported in part by a grant from the Ministry of Education, Science, Sports, and Culture for Scientific Research, Japan, and the Takeda Science Foundation.
- ThT
- thioflavin T
- AFM
- atomic force microscopy
- TFE
- 2,2,2-trifluoroethanol
- HFIP
- 1,1,1,3,3,3-hexafluoro-2-propanol.
REFERENCES
- 1. Cohen F. E., Kelly J. W. (2003) Therapeutic approaches to protein-misfolding diseases. Nature 426, 905–909 [DOI] [PubMed] [Google Scholar]
- 2. Chiti F., Dobson C. M. (2006) Protein misfolding, functional amyloid, and human disease. Annu. Rev. Biochem. 75, 333–366 [DOI] [PubMed] [Google Scholar]
- 3. Eisenberg D., Jucker M. (2012) The amyloid state of proteins in human diseases. Cell 148, 1188–1203 [DOI] [PMC free article] [PubMed] [Google Scholar]
- 4. Jucker M., Walker L. C. (2013) Self-propagation of pathogenic protein aggregates in neurodegenerative diseases. Nature 501, 45–51 [DOI] [PMC free article] [PubMed] [Google Scholar]
- 5. Sipe J. D., Benson M. D., Buxbaum J. N., Ikeda S., Merlini G., Saraiva M. J., Westermark P. (2012) Amyloid fibril protein nomenclature: 2012 recommendations from the Nomenclature Committee of the International Society of Amyloidosis. Amyloid 19, 167–170 [DOI] [PubMed] [Google Scholar]
- 6. Fowler D. M., Koulov A. V., Balch W. E., Kelly J. W. (2007) Functional amyloid: from bacteria to humans. Trends Biochem. Sci. 32, 217–224 [DOI] [PubMed] [Google Scholar]
- 7. Maji S. K., Perrin M. H., Sawaya M. R., Jessberger S., Vadodaria K., Rissman R. A., Singru P. S., Nilsson K. P., Simon R., Schubert D., Eisenberg D., Rivier J., Sawchenko P., Vale W., Riek R. (2009) Functional amyloids as natural storage of peptide hormones in pituitary secretory granules. Science 325, 328–332 [DOI] [PMC free article] [PubMed] [Google Scholar]
- 8. Sawaya M. R., Sambashivan S., Nelson R., Ivanova M. I., Sievers S. A., Apostol M. I., Thompson M. J., Balbirnie M., Wiltzius J. J., McFarlane H. T., Madsen A. Ø., Riekel C., Eisenberg D. (2007) Atomic structures of amyloid cross-β spines reveal varied steric zippers. Nature 447, 453–457 [DOI] [PubMed] [Google Scholar]
- 9. Tycko R., Wickner R. B. (2013) Molecular structures of amyloid and prion fibrils: consensus versus controversy. Acc. Chem. Res. 46, 1487–1496 [DOI] [PMC free article] [PubMed] [Google Scholar]
- 10. Goldschmidt L., Teng P. K., Riek R., Eisenberg D. (2010) Identifying the amylome, proteins capable of forming amyloid-like fibrils. Proc. Natl. Acad. Sci. U.S.A. 107, 3487–3492 [DOI] [PMC free article] [PubMed] [Google Scholar]
- 11. Fändrich M., Dobson C. M. (2002) The behaviour of polyamino acids reveals an inverse side chain effect in amyloid structure formation. EMBO J. 21, 5682–5690 [DOI] [PMC free article] [PubMed] [Google Scholar]
- 12. Chatani E., Kato M., Kawai T., Naiki H., Goto Y. (2005) Main-chain dominated amyloid structures demonstrated by the effect of high pressure. J. Mol. Biol. 352, 941–951 [DOI] [PubMed] [Google Scholar]
- 13. Lee Y. H., Chatani E., Sasahara K., Naiki H., Goto Y. (2009) A comprehensive model for packing and hydration for amyloid fibrils of β2-microglobulin. J. Biol. Chem. 284, 2169–2175 [DOI] [PubMed] [Google Scholar]
- 14. Griffith J. S. (1967) Self-replication and scrapie. Nature 215, 1043–1044 [DOI] [PubMed] [Google Scholar]
- 15. Lansbury P. T., Jr., Caughey B. (1995) The chemistry of scrapie infection: implications of the “ice 9” metaphor. Chem. Biol. 2, 1–5 [DOI] [PubMed] [Google Scholar]
- 16. Jarrett J. T., Lansbury P. T., Jr. (1993) Seeding “one-dimensional crystallization” of amyloid: a pathogenic mechanism in Alzheimer's disease and scrapie? Cell 73, 1055–1058 [DOI] [PubMed] [Google Scholar]
- 17. Harper J. D., Lansbury P. T., Jr. (1997) Models of amyloid seeding in Alzheimer's disease and scrapie: mechanistic truths and physiological consequences of the time-dependent solubility of amyloid proteins. Annu. Rev. Biochem. 66, 385–407 [DOI] [PubMed] [Google Scholar]
- 18. Wetzel R. (2006) Kinetics and thermodynamics of amyloid fibril assembly. Acc. Chem. Res. 39, 671–679 [DOI] [PubMed] [Google Scholar]
- 19. Yoshimura Y., Lin Y., Yagi H., Lee Y. H., Kitayama H., Sakurai K., So M., Ogi H., Naiki H., Goto Y. (2012) Distinguishing crystal-like amyloid fibrils and glass-like amorphous aggregates from their kinetics of formation. Proc. Natl. Acad. Sci. U.S.A. 109, 14446–14451 [DOI] [PMC free article] [PubMed] [Google Scholar]
- 20. Kam Z., Shore H. B., Feher G. (1978) Crystallization of proteins. J. Mol. Biol. 123, 539–555 [DOI] [PubMed] [Google Scholar]
- 21. Durbin S. D., Feher G. (1996) Protein crystallization. Annu. Rev. Phys. Chem. 47, 171–204 [DOI] [PubMed] [Google Scholar]
- 22. Asherie N. (2004) Protein crystallization and phase diagrams. Methods 34, 266–272 [DOI] [PubMed] [Google Scholar]
- 23. Yoshimura Y., So M., Yagi H., Goto Y. (2013) Ultrasonication: an efficient agitation for accelerating the supersaturation-limited amyloid fibrillation of proteins. Jpn. J. Appl. Phys. 52, 07HA01-01-07HA01-08 [Google Scholar]
- 24. Ciryam P., Tartaglia G. G., Morimoto R. I., Dobson C. M., Vendruscolo M. (2013) Widespread aggregation and neurodegenerative diseases are associated with supersaturated proteins. Cell Rep. 5, 781–790 [DOI] [PMC free article] [PubMed] [Google Scholar]
- 25. Ohhashi Y., Kihara M., Naiki H., Goto Y. (2005) Ultrasonication-induced amyloid fibril formation of β2-microglobulin. J. Biol. Chem. 280, 32843–32848 [DOI] [PubMed] [Google Scholar]
- 26. Chatani E., Lee Y. H., Yagi H., Yoshimura Y., Naiki H., Goto Y. (2009) Ultrasonication-dependent production and breakdown lead to minimum-sized amyloid fibrils. Proc. Natl. Acad. Sci. U.S.A. 106, 11119–11124 [DOI] [PMC free article] [PubMed] [Google Scholar]
- 27. So M., Yagi H., Sakurai K., Ogi H., Naiki H., Goto Y. (2011) Ultrasonication-dependent acceleration of amyloid fibril formation. J. Mol. Biol. 412, 568–577 [DOI] [PubMed] [Google Scholar]
- 28. Buck M. (1998) Trifluoroethanol and colleagues: cosolvents come of age. Recent studies with peptides and proteins. Q. Rev. Biophys. 31, 297–355 [DOI] [PubMed] [Google Scholar]
- 29. Chiti F., Webster P., Taddei N., Clark A., Stefani M., Ramponi G., Dobson C. M. (1999) Designing conditions for in vitro formation of amyloid protofilaments and fibrils. Proc. Natl. Acad. Sci. U.S.A. 96, 3590–3594 [DOI] [PMC free article] [PubMed] [Google Scholar]
- 30. Fezoui Y., Teplow D. B. (2002) Kinetic studies of amyloid β-protein fibril assembly: differential effects of α-helix stabilization. J. Biol. Chem. 277, 36948–36954 [DOI] [PubMed] [Google Scholar]
- 31. Dzwolak W., Grudzielanek S., Smirnovas V., Ravindra R., Nicolini C., Jansen R., Loksztejn A., Porowski S., Winter R. (2005) Ethanol-perturbed amyloidogenic self-assembly of insulin: looking for origins of amyloid strains. Biochemistry 44, 8948–8958 [DOI] [PubMed] [Google Scholar]
- 32. Yamaguchi K., Naiki H., Goto Y. (2006) Mechanism by which the amyloid-like fibrils of a β2-microglobulin fragment are induced by fluorine-substituted alcohols. J. Mol. Biol. 363, 279–288 [DOI] [PubMed] [Google Scholar]
- 33. Sekhar A., Udgaonkar J. B. (2011) Fluoroalcohol-induced modulation of the pathway of amyloid protofibril formation by barstar. Biochemistry 50, 805–819 [DOI] [PubMed] [Google Scholar]
- 34. Roeder A. M., Roettger Y., Stündel A., Dodel R., Geyer A. (2013) Synthetic dimeric Aβ(28–40) mimics the complex epitope of human anti-Aβ autoantibodies against toxic Aβ oligomers. J. Biol. Chem. 288, 27638–27645 [DOI] [PMC free article] [PubMed] [Google Scholar]
- 35. Lin Y., Lee Y. H., Yoshimura Y., Yagi H., Goto Y. (2014) Solubility and supersaturation-dependent protein misfolding revealed by ultrasonication. Langmuir 30, 1845–1854 [DOI] [PubMed] [Google Scholar]
- 36. Jiménez J. L., Nettleton E. J., Bouchard M., Robinson C. V., Dobson C. M., Saibil H. R. (2002) The protofilament structure of insulin amyloid fibrils. Proc. Natl. Acad. Sci. U.S.A. 99, 9196–9201 [DOI] [PMC free article] [PubMed] [Google Scholar]
- 37. Ahmad A., Uversky V. N., Hong D., Fink A. L. (2005) Early events in the fibrillation of monomeric insulin. J. Biol. Chem. 280, 42669–42675 [DOI] [PubMed] [Google Scholar]
- 38. Loksztejn A., Dzwolak W. (2010) Vortex-induced formation of insulin amyloid superstructures probed by time-lapse atomic force microscopy and circular dichroism spectroscopy. J. Mol. Biol. 395, 643–655 [DOI] [PubMed] [Google Scholar]
- 39. Yagi H., Hasegawa K., Yoshimura Y., Goto Y. (2013) Acceleration of the depolymerization of amyloid β fibrils by ultrasonication. Biochim. Biophys. Acta 1834, 2480–2485 [DOI] [PubMed] [Google Scholar]
- 40. Kardos J., Okuno D., Kawai T., Hagihara Y., Yumoto N., Kitagawa T., Závodszky P., Naiki H., Goto Y. (2005) Structural studies reveal that the diverse morphology of β2-microglobulin aggregates is a reflection of different molecular architectures. Biochim. Biophys. Acta 1753, 108–120 [DOI] [PubMed] [Google Scholar]
- 41. Ban T., Hoshino M., Takahashi S., Hamada D., Hasegawa K., Naiki H., Goto Y. (2004) Direct observation of Aβ amyloid fibril growth and inhibition. J. Mol. Biol. 344, 757–767 [DOI] [PubMed] [Google Scholar]
- 42. Whitmore L., Woollett B., Miles A. J., Klose D. P., Janes R. W., Wallace B. A. (2011) PCDDB: the Protein Circular Dichroism Data Bank, a repository for circular dichroism spectral and metadata. Nucleic Acids Res. 39, D480–486 [DOI] [PMC free article] [PubMed] [Google Scholar]
- 43. Bouchard M., Zurdo J., Nettleton E. J., Dobson C. M., Robinson C. V. (2000) Formation of insulin amyloid fibrils followed by FTIR simultaneously with CD and electron microscopy. Protein Sci. 9, 1960–1967 [DOI] [PMC free article] [PubMed] [Google Scholar]
- 44. Crespo R., Martins P. M., Gales L., Rocha F., Damas A. M. (2010) Potential use of ultrasound to promote protein crystallization. J. Appl. Crystallogr. 43, 1419–1425 [Google Scholar]
- 45. Byström R., Aisenbrey C., Borowik T., Bokvist M., Lindström F., Sani M. A., Olofsson A., Gröbner G. (2008) Disordered proteins: biological membranes as two-dimensional aggregation matrices. Cell Biochem. Biophys. 52, 175–189 [DOI] [PubMed] [Google Scholar]
- 46. Munishkina L. A., Cooper E. M., Uversky V. N., Fink A. L. (2004) The effect of macromolecular crowding on protein aggregation and amyloid fibril formation. J. Mol. Recognit. 17, 456–464 [DOI] [PubMed] [Google Scholar]
- 47. Walsh D. M., Klyubin I., Fadeeva J. V., Cullen W. K., Anwyl R., Wolfe M. S., Rowan M. J., Selkoe D. J. (2002) Naturally secreted oligomers of amyloid β protein potently inhibit hippocampal long-term potentiation in vivo. Nature 416, 535–539 [DOI] [PubMed] [Google Scholar]
- 48. Haass C., Selkoe D. J. (2007) Soluble protein oligomers in neurodegeneration: lessons from the Alzheimer's amyloid β-peptide. Nat. Rev. Mol. Cell Biol. 8, 101–112 [DOI] [PubMed] [Google Scholar]
- 49. Bemporad F., Chiti F. (2012) Protein misfolded oligomers: experimental approaches, mechanism of formation, and structure-toxicity relationships. Chem. Biol. 19, 315–327 [DOI] [PubMed] [Google Scholar]