

Background: Lipin 2 is a phosphatidic acid phosphatase (PAP) responsible for DAG formation at the ER membrane during lipogenesis.
Results: A combination of biochemical approaches is used to characterize lipin 2 phosphatase activity and regulation.
Conclusion: The electrostatic charge of PA regulates activity, but phosphorylation does not.
Significance: These findings demonstrate differential regulation of PAP activity within the lipin family.
Keywords: Diacylglycerol, Enzyme Kinetics, Phosphatidic Acid, Phosphatidylethanolamine, Phosphorylation, Lipin 2, lpin2, mTOR, Phosphatidic Acid Phosphatase, Polybasic Domain
Abstract
Lipin 2 is a phosphatidic acid phosphatase (PAP) responsible for the penultimate step of triglyceride synthesis and dephosphorylation of phosphatidic acid (PA) to generate diacylglycerol. The lipin family of PA phosphatases is composed of lipins 1–3, which are members of the conserved haloacid dehalogenase superfamily. Although genetic alteration of LPIN2 in humans is known to cause Majeed syndrome, little is known about the biochemical regulation of its PAP activity. Here, in an attempt to gain a better general understanding of the biochemical nature of lipin 2, we have performed kinetic and phosphorylation analyses. We provide evidence that lipin 2, like lipin 1, binds PA via the electrostatic hydrogen bond switch mechanism but has a lower rate of catalysis. Like lipin 1, lipin 2 is highly phosphorylated, and we identified 15 phosphosites. However, unlike lipin 1, the phosphorylation of lipin 2 is not induced by insulin signaling nor is it sensitive to inhibition of the mammalian target of rapamycin. Importantly, phosphorylation of lipin 2 does not negatively regulate either membrane binding or PAP activity. This suggests that lipin 2 functions as a constitutively active PA phosphatase in stark contrast to the high degree of phosphorylation-mediated regulation of lipin 1. This knowledge of lipin 2 regulation is important for a deeper understanding of how the lipin family functions with respect to lipid synthesis and, more generally, as an example of how the membrane environment around PA can influence its effector proteins.
Introduction
Lipin 2 is a Mg2+-dependent phosphatidic acid phosphatase and a member of the lipin family consisting of lipins 1–3, which are members of the haloacid dehalogenase superfamily (1, 2). The lipins translocate between the cytosol and the ER2 membrane where they bind PA in response to multiple regulatory inputs to form DAG. Being soluble proteins, the lipins reside at a unique regulatory node in triacylglycerol synthesis as the other triacylglycerol biosynthetic enzymes are integral membrane proteins (3). Additionally, cellular PAP activity influences production of specific phospholipids. Phosphatidylglycerol, phosphatidylinositol, and cardiolipin are formed from PA by the CDP-DAG pathway, whereas phosphatidylcholine (PC), phosphatidylethanolamine (PE), and phosphatidylserine are formed from DAG via the Kennedy pathway (4).
Lipin 2 expression is most prominent in the liver, but expression has also been observed in adipose, macrophages, and the cerebellum, where its role in these cell types is best understood to contribute to lipid homeostasis (5). More specifically, in the liver lipin 2 expression is induced by fasting, diet-induced obesity, and ER stress (6, 7). Among the lipin family there are tissues in which expression of more than one lipin isoform occurs, suggesting distinct and overlapping functions. For example, in 3T3-L1 adipocytes, lipin 2 expression decreases during adipogenesis while lipin 1 expression increases, suggesting distinct functionalities of the two enzymes (8, 9). The importance of PAP in lipid metabolism is exemplified by its mutant phenotypes. Deletion of lipin 1 in mice causes lipodystrophy, fatty liver, and peripheral neuropathy, although humans lacking lipin 1 exhibit myoglobinuria, rhabdomyolysis, and inflammation (5). Genetic alteration in lipin 2 is known to cause Majeed syndrome, which is characterized by the formation of osteomyelitic lesions near the ends of long bones and dysperythropoietic anemia (10).
The best studied lipin family member, lipin 1, is highly phosphorylated in response to insulin/PI3K/mTOR signaling with several validated rapamycin- and Torin1-sensitive phosphosites (11–13). This signaling is known to control lipin 1 cellular localization. mTOR-dependent phosphorylation sequesters lipin 1 to the cytoplasm, whereas inhibition of mTORC1 and -2 with Torin1, an ATP competitive inhibitor, results in lipin 1 translocation to the ER membrane and nucleus. Although lipin 1 phosphorylation has been correlated with its cytosolic localization, a mechanistic basis for phosphorylation controlling lipin 1 membrane binding has only recently been elucidated. PA, the lipin family's substrate, is a phosphomonoester. This unique lipid headgroup yields two dissociable protons, with approximate pKa values of 3 and 7.9 (14). Considering that pKa2 falls within the physiological pH range, PA can be either mono- or di-anionic. Deprotonation of PA is enhanced in the presence of primary amines, such as the headgroup of PE, through the formation of a hydrogen bond with the PA phosphate group thereby lowering pKa2 to ∼6.9 (14). In an in vitro phosphatase and membrane binding liposome assay, lipin 1 activity increased correspondingly with increases in the mol % of PE, which increase the ratio di-anionic to mono-anionic PA (15). This is consistent with the electrostatic hydrogen bond switch mechanism elegantly demonstrated by Kooijman et al. (16). This response is mediated through the lipin 1 PA binding domain, known as the polybasic domain, which consists of a nine-amino acid stretch of lysines and arginines. The polybasic domain is conserved within the lipin family, and the specific sequence of lysines and arginines is unique to each lipin family member and is highly conserved between species. Phosphorylation of lipin 1 has been shown to exert a negative regulation on lipin 1 PA binding, suggestive of an interaction or competition between phospho-(Ser/Thr) within lipin 1 and the phosphomonoester headgroup of PA competing for polybasic domain binding within lipin 1 (15). This evidence suggests that lipin 1 binds PA by the electrostatic hydrogen bond switch mechanism, and this is negatively regulated by phosphorylation.
The relative PAP activity of human lipin 2 has been previously determined in cell lysates (17, 18). In this study, we examine lipin 2 kinetics, first as a general characterization and then with respect to PA charge and phosphorylation. Our data suggest that lipin 2 preferentially binds di-anionic PA, similar to lipin 1, and is a constitutively active PAP enzyme with respect to phosphorylation. In addition, we have identified novel phosphorylation sites within lipin 2 and have examined the cellular localization in 3T3-L1 adipocytes in response to inhibition of mTOR signaling.
EXPERIMENTAL PROCEDURES
Plasmids and Adenovirus Constructs
The Mus musculus Lpin2 cDNA from a triple HA-tagged expression vector that was described previously was removed with EcoRV and inserted into pCMV-Tag2C (Stratagene) to produce pCMV-TAG2C-Lipin 2 (6). This tagged lipin 2 was then subcloned into the pAdTRACK-CMV shuttle vector (19) and then into the pAdEASY system for adenovirus generation. High titer adenovirus was purified by CsCl banding as described (19). The lipin 2 antibody has been previously described (6). To generate Venus (yellow fluorescent protein)-tagged lipin 2, the triple HA-tagged Lipin 2 was inserted downstream of FLAG-tagged Venus in pcDNA3. To generate the Venus-tagged lipin 1, the FLAG-tagged Venus sequence was subcloned immediately upstream of lipin 1b in pcDNA3.
Expression and Purification of Lipin 2
Lipin 2 with a FLAG tag was expressed in HeLa cells using 72-h adenoviral infection with multiplicity of infection ∼10. Cells were harvested by centrifugation at 800 × g for 10 min, washed with ice-cold phosphate-buffered saline (PBS), and either used directly or frozen at −80 °C. All subsequent steps were carried out on ice or at 4 °C unless otherwise noted. Cells were lysed in buffer A (500 mm NaCl, 0.1% Brij 35, and 20 mm Hepes, pH 7.2), and the supernatant was incubated with anti-FLAG beads for 2–4 h. Beads were isolated by centrifugation at 600 × g, and the supernatant was removed. After washing, the slurry was incubated for 30 min at 30 °C in 50 mm Hepes, 100 mm NaCl, 1 mm MnCl2, 2 mm DTT, with or without 2000 units of λ-protein phosphatase (New England Biolabs), and subjected to gentle agitation. The slurry was packed onto a screening column and washed with 5 column volumes of buffer A, followed by 5 column volumes of buffer B (150 mm NaCl, 0.1% Brij 35, and 20 mm Hepes, pH 7.2), and lipin 2 was eluted by five successive additions of an equal volume of 0.5 mg/ml FLAG peptide in buffer B. Elution fractions containing lipin were pooled and dialyzed three times against 1 liter of 150 mm NaCl, 10% glycerol, and 20 mm Hepes, pH 7.2. Purified lipin was quantitated using UV absorbance and comparison of bands of lipin and bovine serum albumin standards on Coomassie Blue-stained SDS-polyacrylamide gels.
Preparation of [32P]PA
[32P]Phosphatidic acid was purified by thin layer chromatography after using [γ-32P]ATP and Escherichia coli diacylglycerol kinase to phosphorylate 1,2-dioleoyl-sn-glycerol.
Preparation of Triton X-100/Phospholipid-mixed Micelles
PA was transferred to a glass tube, and solvent was eliminated in vacuo for 1 h. Triton X-100 was added to produce the appropriate concentration of Triton X-100/PA micelles. The mol % of lipid in a Triton X-100/lipid-mixed micelle was calculated using the formula, mol % = 100 × [lipid (M)]/([lipid (M)] + [Triton X-100 (M)]), where M is Molar.
Quantitation of Phosphate Removal by λ-Phosphatase
HeLa cells were infected with adenovirus expressing FLAG-tagged lipin 2 for 72 h, were then switched from culture medium to low phosphate buffer (145 mm NaCl, 5.4 mm KCl, 1.4 mm CaCl2, 1.4 mm MgSO4, 25 mm NaHCO3, 5 mm glucose, 0.2 mm sodium phosphate, and 10 mm Hepes, pH 7.4) containing 10% serum, and were radiolabeled with 0.02 mCi/ml [32P]ATP for 2 h before protein isolation. Lipin 2 was isolated as described above and treated with λ-phosphatase for the indicated amount of time at 30 °C subject to gentle agitation. Lipin 2 was electrophoresed on an 8.75% acrylamide gel and transferred to PVDF membrane, and quantitation of phosphate removal was determined by autoradiography.
Radiolabeling of Lipin 2 in 3T3-L1 Adipocytes
Day-6–8 3T3-L1 adipocytes were infected with adenovirus expressing FLAG-tagged lipin 2. Two days after infection, the cells were incubated for a total of 120 min in low phosphate buffer plus 0.1% BSA and supplemented with 0.5 mCi/ml [32P]orthophosphate. During this time, the cells were incubated as follows: no additions, 10 milliunits/ml insulin for the last 15 min only, and 250 nm Torin1 for the last 30 min followed by 10 milliunits/ml insulin for the last 15 min. The cells were lysed in buffer A, and the lysates were cleared by centrifugation at 16,000 × g for 10 min. The supernatant was incubated with anti-FLAG beads for 2 h at 4 °C. Beads were isolated by centrifugation at 2000 × g for 10 s, and the supernatant was removed. The beads were washed three times with buffer B. Samples were subjected to SDS-PAGE, and incorporation of 32P was visualized using a phosphorimager.
Preparation of Liposomes
Unilamellar phospholipid vesicles were prepared by the lipid extrusion method of MacDonald et al. (20). Briefly, the indicated lipids were dried in vacuo overnight to form a thin film that was suspended in buffer B consisting of 20 mm Tris-HCl, pH 7.2, and 1 mm EDTA. For PAP assays with liposomes, [32P]phosphatidic acid (10,000 cpm/nmol) was included before drying. The lipid suspensions were extruded 11 times using a mini-extruder (Avanti) through a 100-nm diameter polycarbonate filter after five freeze/thaws. Liposome production and diameter were verified using a Dynamic Light Scattering instrument from DynaPro. Liposomes were used immediately after generation.
Measurement of PAP Activity
PAP activity was determined by using a modification of the Han and Carman procedure (21) to measure [32P]phosphate release from [32P]phosphatidic acid. Briefly, purified lipin was added to reaction mixtures (100 μl) containing Triton X-100/lipid-mixed micelles or liposomes, 10 mm β-mercaptoethanol, [32P]phosphatidic acid (10,000 cpm/nmol), 0.5 mm MgCl2, and 50 mm Tris-HCl, pH 7.2. After 20 min at 30 °C, reactions were terminated by adding 0.5 ml of 0.1 n HCl in methanol. [32P]Phosphate was extracted by vigorous mixing after adding 1 ml of chloroform and 1 ml of 1 m MgCl2. The [32P]phosphate in 0.5 ml of the aqueous phase was determined by scintillation counting. All enzyme activity assays were performed in triplicate, and error is shown as ± S.D. The kinetic data were analyzed using GraphPad Prism 5 using Michaelis-Menten or allosteric sigmoidal equations where appropriate. kcat was calculated according to the equation kcat = Vmax/Et, where Et = enzyme catalytic site concentration. Each assay was confirmed with an independent enzyme purification preparation. All kinetic data were based on duplicate experiments. Results generally agreed within 20%. PA hydrolysis did not exceed 10% for the conditions used.
Measurement of Membrane Binding
Binding of lipin to large unilamellar vesicles was measured following a slightly modified version of Höfer et al. (22). Briefly, Venus-tagged lipin 2 was incubated for 20 min at 30 °C with liposomes containing the indicated phospholipid concentrations and 0.1 mol % pyrene-PC, and then an equal volume of 80% (w/v) sucrose in buffer B was added. This mixture was placed in 5 × 41-mm Beckman tubes and was carefully overlaid with 150 μl of 20% (w/v) and then 50 μl of 0% (w/v) sucrose in buffer B and centrifuged in an SW 55Ti swinging bucket rotor containing nylon inserts at 240,000 × g for 1 h. The top 50-μl fraction was collected with a Hamilton syringe and pyrene, and Venus absorption was measured to determine the percent liposome recovery after flotation in addition to the fraction of lipin 2 bound to the liposomes. All binding assays were performed at least three times. The average relative binding compared with PC/PA (20 mol %) liposomes is shown, ± S.D. Student's t test was used to determine statistical significance.
Mass Spectrometry
Phosphatase-treated and natively phosphorylated lipin 2 were TCA-precipitated, suspended in 50 mm ammonium bicarbonate, pH 7.7, reduced with 5 mm dithiothreitol, alkylated with 15 mm iodoacetamide, and digested overnight with trypsin. LC-MS/MS analysis was conducted in triplicate on a hybrid ion trap-Orbitrap mass spectrometer to identify phosphorylation sites and to approximate site stoichiometry based on the phosphatase-treated sample. The remaining tryptic peptides were further purified using metal affinity chromatography to enrich phosphopeptides prior to LC-MS/MS (23). Acquired spectra were searched using Sequest against a concatenated forward and reverse version of the UniProt mouse protein sequence database (version 11.29.2012) allowing for phosphorylation of serine, threonine, and tyrosine (+79.96633 Da). An in-house implementation of the “Ascore” algorithm was used to correctly localize phosphorylation sites (24). Approximate phosphorylation site stoichiometry was calculated at the peptide level. The increased relative abundance of an unmodified peptide after phosphatase treatment is a proxy for phosphorylation site stoichiometry. We defined “high” stoichiometry as >67%, “medium” as 33–66%, and “low” as <33% of peptides phosphorylated.
Immunofluorescence
Day 5 post-differentiation 3T3-L1 adipocytes were plated onto poly-l-lysine-coated coverslips in 6-well plates and incubated in DMEM with 10% FBS. Day 8 mature adipocytes were treated overnight (16 h) with either 250 nm Torin1 or vehicle (0.025% DMSO). After treatment, cells on coverslips were washed three times with ice-cold PBS, fixed with 4% paraformaldehyde for 20 min at room temperature, washed three times with PBS, and then permeabilized with 0.25% (v/v) Triton X-100 with 10% normal goat serum in PBS for 10 min and washed an additional three times with PBS. Cells were incubated in blocking buffer containing 10% normal goat serum and 0.1% Triton X-100 in PBS for 1 h, followed by primary antibody incubation for 1 h at 37 °C, incubation with protein-disulfide isomerase primary, when present, at room temperature and 2 h at room temperature with lipin 1/2 primary. Primary antibodies were diluted in 5% normal goat serum and 0.1% Triton X-100 in PBS (1:200 CT-lipin 1, 1:75 lipin 2, 1:200 protein-disulfide isomerase). Cells were washed three times with PBS and incubated with secondary antibody dilution (1:200 Alexa Fluor 555 goat anti-rabbit and 1:400 Alexa Fluor 488 goat anti-mouse) containing 8 ng/μl BODIPY 493/503, when present, in 5% normal goat serum and 0.1% Triton X-100 in PBS for 1 h at room temperature in the dark. Coverslips were washed four times with PBS and then mounted onto glass slides using Vectashield containing DAPI. Slides were imaged using a Zeiss LSM 510 microscope equipped with a ×100 oil immersion plan-apochromatic lens. The images represent a z-stack projection of 7–10 confocal sections from the basal to apical cell side.
Subcellular Fractionations
3T3-L1 adipocytes were fractionated by slight modification of the method previously described (12). For each treatment, two 6-cm diameter plates of cells were homogenized in 0.5 ml of TES buffer (10 mm Tris-HCl, pH 7.4, 1 mm EDTA, 0.25 m sucrose). The homogenates were centrifuged at 16,000 × g for 20 min, and the resulting supernatants were centrifuged at 175,000 × g for 1 h. The high speed supernatants containing soluble proteins were collected, and the high speed pellets containing microsomes were suspended in 0.5 ml of TES buffer.
RESULTS
Purification and Enzymatic Characterization of Lipin 2
To obtain purified lipin 2 for detailed kinetic analyses, HeLa cells were infected with adenovirus expressing FLAG-tagged lipin 2. The recombinant protein was purified from cell lysates using anti-FLAG-agarose beads, followed by extensive washes, elution by FLAG peptide, and dialysis, which yielded a highly purified enzyme preparation (Fig. 1A).
FIGURE 1.

Purification and initial characterization of lipin 2. A, FLAG-tagged lipin 2 was expressed in HeLa cells using adenovirus for 72 h, after which cells were harvested and lysed in homogenization buffer A, and cleared lysates were incubated with anti-FLAG-agarose beads for 2–4 h. The slurry was packed onto a screening column, washed extensively, eluted with FLAG peptide, and dialyzed. A representative 8.75% acrylamide SDS-polyacrylamide gel stained with Coomassie Blue is shown with 500 ng of purified lipin 2. B, the linear range of lipin 2 phosphatase activity (50 ng) is shown toward Triton X-100/PA-mixed micelles (9.1 mol %). C, lipin 2 PA phosphatase activity was measured at the indicated pH in 50 mm Tris maleate/glycine. D, indicated concentrations of Triton X-100 were used to measure PA phosphatase activity against 0.5 mm PA. The lipin 2 PA phosphatase activity was measured with the indicated concentrations of MgCl2 (E) and MnCl2 (F). G, lipin 2 PA phosphatase activity was measured with the indicated concentrations of N-ethylmaleimide in the absence of β-mercaptoethanol. H, lipin 2 PA phosphatase activity was measured with the indicated concentrations of β-mercaptoethanol. Maximum PA phosphatase activity is set to 100%. The data shown are the means ± S.D. from triplicate experiments.
Because lipin 2 is relatively uncharacterized, and no studies have been performed with purified lipin 2, we first performed a series of basic biochemical characterizations. The subsequent experimental parameters were measured against 0.5 mm PA solubilized at the indicated amount of Triton X-100. The linear range of phosphatase activity with respect to time was determined (Fig. 1B); under these conditions, the specific activity of lipin 2 was 0.14 μmol/min/mg. The optimal pH for lipin 2 PAP activity was determined (Fig. 1C) and found to peak at pH 7.2. Lipin 2 PAP activity declined with increasing molar concentrations of Triton X-100, a characteristic of surface dilution kinetics also exhibited by lipin 1 (Fig. 1D) (25).
Like lipin 1, lipin 2 PAP activity required a divalent cation. Optimal PAP activity for lipin 2 was achieved with 0.5 mm Mg2+ (Fig. 1E), and approximately half of this maximal activity was achieved with a 50-fold lower concentration of Mn2+ (Fig. 1F). Alkylating agents such as N-ethylmaleimide are known to inhibit lipin 1 PAP activity, and similar effects are observed with lipin 2 (Fig. 1G, IC50 = 0.1 mm). Maximal PAP activity is achieved with the addition of 10 mm β-mercaptoethanol (Fig. 1H), similar to lipin 1. The results from Fig. 1, D–H, are quite similar to those reported for human lipin 1, with the primary difference being the magnitude of the optimum activity (26).
Lipin 2 Membrane Binding and PAP Activity Are Stimulated by Di-anionic PA, Characteristic of the Electrostatic Hydrogen Bond Switch Mechanism
To determine what effect the charge on the PA headgroup has on lipin 2 PAP activity and membrane binding, Lipin 2 substrate, PA, was presented in a lipid bilayer with and without primary amines to modulate PA charge. Liposomes containing [32P]PA and unlabeled PA and PC (10:90 mol %) and PA, PE, and PC (10:30:60 mol %) were used to measure the rate of phosphate hydrolysis where the majority of PA is mono-anionic (Fig. 2A) and di-anionic (Fig. 2B). The mol % composition was held constant, and the molar concentration of PA was increased. Analysis of the data according to the Michaelis-Menten equation showed no significant effect on the measured Kmapp values for 0 and 30 mol % PE, which were 3.3 ± 0.4 × 10⁻⁵ and 3.6 ± 0.6 × 10⁻⁵ m, respectively. However, both the turnover number and catalytic efficiency increased ∼4-fold in the presence of PE (Table 1), indicating that PA charge does indeed influence lipin 2 PAP activity.
FIGURE 2.

Effects of PA charge on lipin 2 PA phosphatase activity. A, lipin 2 PA phosphatase activity was measured using PA/PC (10:90 mol %) liposomes (A) and PA:PE:PC (10:30:60 mol %) liposomes at the indicated molar concentration (B). The data shown are the means ± S.D. from triplicate experiments.
TABLE 1.
Steady-state kinetic data for lipin 2 (phosphorylated, −λ, and dephosphorylated, +λ) using liposomes composed of 10 mol % PA and 90 mol % (PE +PC) with PE mol % indicated
| Lipin 2 | mol % PE | kcat | Kmapp | kcat/Kmapp |
|---|---|---|---|---|
| s−1 | m | m−1 s−1 | ||
| +λ | 0 | 0.59 ± 0.02 | 3.8 ± 0.5 × 10⁻⁵ | 1.5 × 10⁴ |
| +λ | 30 | 2.54 ± 0.32 | 2.7 ± 1.3 × 10⁻⁵ | 9.4 × 10⁴ |
| −λ | 0 | 0.63 ± 0.03 | 3.3 ± 0.4 × 10⁻⁵ | 1.9 × 10⁴ |
| −λ | 30 | 2.65 ± 0.39 | 3.6 ± 0.6 × 10⁻⁵ | 7.3 × 10⁴ |
To determine whether the observed increase in lipin 2 phosphatase activity is a result of increased membrane association or active site efficiency, or both, lipin 2 binding to similarly constructed liposomes was measured (Fig. 3A). FLAG-tagged Venus-lipin 2 was purified and subjected to liposome flotation assays. Total binding increases ∼0.5-fold with 30 mol % PE. To demonstrate that the modulation of PA charge is responsible for increasing lipin 2 membrane binding, increasing mol % of PE was titrated into the liposomes while holding the molar concentration of PA at saturation. As seen in Fig. 3B, at constant PA levels the increase in PE corresponds with an increase in total lipin 2 binding to membranes. A similar experiment was performed with a Venus-tagged lipin 1 to directly compare the binding affinity of lipin 2 with lipin 1 (Fig. 3C). Under these conditions, the binding affinity (Kd) of lipin 1 (0.066 0.003 × 10⁻⁵ m) to PC/PA/PE liposomes was substantially higher than lipin 2 (1.5 ± 0.3 × 10⁻⁵ m). The results from Figs. 2 and 3 clearly demonstrate that, similar to lipin 1, lipin 2 PAP activity and binding to liposomes are both increased with conversion of the charge of PA from mono-anionic to di-anionic.
FIGURE 3.

Effects of PA charge on lipin 2 membrane binding. A, lipin 2 binding to liposomes composed of PA/PC (20 mol % PA, 0% PE, 79.9 mol % PC, 0.1 mol % pyrene-PC) and PA/PE/PC (20 mol % PA, 30 mol % PE, 49.9 mol % PC, 0.1 mol % pyrene-PC). Venus-tagged lipin 2 and the indicated concentration of liposomes were incubated for 20 min at 30 °C and then an equal volume of 80% (w/v) sucrose in buffer B was added. This mixture was placed in 5 × 41-mm Beckman tubes and was carefully overlaid with 150 μl of 20% (w/v) and 50 μl of 0% (w/v) sucrose in buffer B and centrifuged in an SW 55Ti swinging bucket rotor containing nylon inserts at 240,000 × g for 1 h. The top 50-μl fraction was collected with a Hamilton syringe, and pyrene and Venus absorption were measured to determine the percent liposome recovery after flotation in addition to the fraction of lipin 2 bound to the liposomes. Fraction bound was determined from triplicate experiments. B, FLAG-Venus-lipin 2 binding to PA containing liposomes increases as the mol % PE increases. Binding was performed as described previously with the indicated mol % PE. Binding was performed at saturating PA concentrations, 10 mm. C, FLAG-Venus-lipin 1 binding to PA/PC liposomes (20 mol % PA, 79.9 mol % PC, 0.1 mol % pyrene-PC) was performed as described for lipin 2 in A. The data are shown as means ± S.D. from triplicate experiments.
Characterization of Lipin 2 Phosphorylation
Because of the importance of phosphorylation in negatively regulating lipin 1, we utilized mass spectrometry to identify the phosphorylated residues within lipin 2. Affinity-purified lipin 2 was trypsin-digested and subjected to LC-MS/MS. Sequence coverage of lipin 2 was 91%, missing the region between amino acids 428 and 482. The MS/MS spectrum derived from a representative phosphopeptide is shown (Fig. 4A). In this case, fragments of the peptide that contained phosphoserine 106 had the mass predicted from the amino acid composition (LPAYLATS(ph)PIPTEDQFFK) plus 80 atomic mass units. Including Ser-106, 15 phosphorylation sites were identified on lipin 2 (Fig. 4B). The location of the sites with respect to other features of lipin 2 is shown (Fig. 4C). The majority (12/15) of the phosphorylated residues was found in the low homology region between the CLIP and NLIP domains (Fig. 4C). Interestingly, Ser-106 and Ser-150, residing at the end of the NLIP domain and immediately before the polybasic domain, respectively, are phosphorylated in both lipin 1 and lipin 2. In addition, Ser-243 in lipin 2 is homologous to Ser-285 in lipin 1. Most of the sites identified were phosphorylated at high stoichiometry, as estimated by comparison with λ-phosphatase-treated lipin 2 (Fig. 4B). Because of the complexity of the MS/MS spectra for the peptide from Gln-335 to Lys-K379, we were unable to unambiguously assign the exact position of two phosphorylated residues. To indicate this ambiguity, the two sites, one at Ser-337/Ser-341/Thr-342 and the other at Ser-365/Ser-367, are reported within brackets in Fig. 4C. Thus, we demonstrate that lipin 2 contains numerous phosphorylated Ser and Thr residues, with only a few of them in common with lipin 1.
FIGURE 4.

Mass spectrometric analysis of lipin 2 phosphorylation. A, MS/MS spectrum of the peptide containing phosphorylated Ser106 is shown. B, summary of the identified phosphorylation sites in lipin 2. Amino acid sequences and approximate stoichiometries of the phosphopeptides identified by MS/MS analyses are shown. Also shown is whether the residue identified as phosphorylated in lipin 2 is conserved within lipin 1 and 3. Note that this does not necessarily mean that the conserved residue is phosphorylated in lipin 1 and 3. C, schematic showing identified phosphorylation sites in relation to each other and domains within lipin 2. If the site could not be confidently localized (>95% certainty), a range of possible positions is indicated with brackets.
Having both confirmed that lipin 2 is phosphorylated and identified the phosphorylated residues, we next determined if phosphorylation has an intrinsic effect on lipin 2 phosphatase activity. To do so, lipin 2 was purified and treated with λ-phosphatase to remove phosphates to generate a nonphosphorylated lipin 2. As reported for lipin 1, a decrease in mobility on SDS-PAGE is observed for phosphorylated (−λ) compared with phosphatase-treated (+λ) lipin 2 (Fig. 5A). However, even more so than in the case of lipin 1, dephosphorylated lipin 2 still displays an aberrant mobility by SDS-PAGE migrating at 145–150 kDa instead of a predicted 95 kDa. To determine the efficiency of phosphatase treatment, HeLa cells were incubated with 0.02 mCi [32P]ATP for 2 h, and lipin 2 was immunoprecipitated and subjected to dephosphorylation by λ-phosphatase for the indicated amount of time (Fig. 5B). A 30-min phosphatase treatment removed >90% of the radiolabel.
FIGURE 5.

λ-Phosphatase treatment of lipin 2. A, lipin 2 was purified as described previously and treated with λ-phosphatase for 30 min. A representative 8.75% acrylamide SDS-polyacrylamide gel stained with Coomassie Blue is shown for 500 ng of dephosphorylated (+λ) and phosphorylated (−λ) lipin 2. B, HeLa cells expressing lipin 2 were incubated with 0.02 mCi/ml [32P]ATP for 2 h, and Lipin 2 was immunoprecipitated and treated with λ-phosphatase for the indicated amount of time. Quantitation of phosphate removal was determined by autoradiography of lipin 2 after running on an 8.75% acrylamide SDS-polyacrylamide gel and transferred to PVDF. Graph shows means ± S.D. of 32P incorporation from triplicate experiments.
We next performed a series of kinetic analyses to determine the effect of phosphorylation on lipin 2 PAP activity. For enzymes that follow surface dilution kinetics such as lipin 2, as determined by the results from Fig. 1D, the bulk and surface concentration of the substrate need to be considered. Phosphorylated and nonphosphorylated lipin 2 showed no significant difference in kinetic constants when measured against the bulk concentration of PA (Fig. 6, A and B) or the surface concentration of PA (Fig. 6, C and D) using PA/Triton X-100-mixed micelles. For phosphorylated and dephosphorylated lipin 2, the apparent Km and Vmax values for PA against the bulk concentration is 6.5 ± 0.5 × 10⁻⁵ and 8.3 ± 1.2 × 10⁻⁵ m and 136.9 ± 3.0 and 132.3 ± 5.3 nmol/min/mg, respectively. When measured against the surface concentration of PA, the Vmax and h values were 251 ± 93 and 213 ± 120 nmol/min/mg and 1.3 ± 0.7 and 1.4 ± 0.5, respectively. These apparent h values suggest lipin 2 is not cooperative with respect to the surface concentration of PA, unlike what has been found for lipin 1 (15). Therefore, at neutral pH, where the majority of PA is mono-anionic, lipin 2 shows no effect of phosphorylation.
FIGURE 6.

Effect of lipin 2 phosphorylation on PA phosphatase activity. Phosphorylated (−λ) and dephosphorylated (+λ) lipin 2 PA phosphatase activity against Triton X-100/PA micelles was measured with respect to the molar (A and B) and surface (C and D) concentrations of PA. With respect to the molar concentration of PA, the molar ratio of Triton X-100/PA was 10:1 (9.1 mol %) and assayed against increasing molar PA concentrations. With respect to the surface concentration, the molar concentration of PA was maintained at 1 mm while decreasing the ratio of Triton X-100/PA. E and F, lipin 2 PA phosphatase activity was measured using liposomes with 0 and 30 mol % PE and 90 and 30 mol % PC, respectively, and 10 mol % PA. The data shown are the means ± S.D. from triplicate experiments. The best fit curves were derived from kinetic analysis of the data.
Because lipin 1 PAP activity is influenced by both phosphorylation and PA charge, we determined whether lipin 2 PAP activity is similarly influenced. Liposomes containing PA/PC (10:90 mol %) and PA/PE/PC (10:30:60 mol %) were used to determine whether substrate charge altered phosphatase activity in the context of phosphorylation. PAP activity for phosphorylated (−λ) lipin 2 was performed in Fig. 2, A and B. Dephosphorylated (+λ) lipin 2 PAP activity toward liposomes without PE (mono-anionic PA) and with PE (di-anionic PA) is shown in Fig. 6, E and F. These kinetic constants are summarized in Table 1. Surprisingly, dephosphorylated lipin 2 displayed similar kinetic parameters as phosphorylated lipin 2 against both PE- and non-PE-containing liposomes. Thus, although the electrostatic charge of PA plays a crucial role in the regulation of both phosphorylated and dephosphorylated lipin 2, lipin 2 PAP activity is independent of phosphorylation, at least as measured under these conditions. These results demonstrate that in contrast to lipin 1, the PAP activity of lipin 2 is not negatively regulated by phosphorylation.
Phosphorylation and Localization of Lipin 2 in 3T3-L1 Adipocytes
It has been previously reported that lipin 2 is phosphorylated in 3T3-L1 adipocytes (9). Because lipin 1 phosphorylation is highly induced in response to insulin stimulation, we sought to determine whether the phosphorylation of lipin 2 is similarly induced. Because of low expression levels of lipin 2 in differentiated adipocytes (8), FLAG-tagged lipin 2 was overexpressed in 3T3-L1 adipocytes using adenovirus, and after 72 h the cells were radiolabeled with [32P]orthophosphate for 120 min under serum-free conditions. The labeled adipocytes were then incubated with or without 250 nm Torin1 for 30 min and then with or without 10 milliunits/ml insulin for 15 min. Radiolabeled FLAG-tagged lipin 2 and endogenous lipin 1 were then isolated by immunoprecipitation, electrophoresed by SDS-PAGE, and transferred to membranes. After phosphorimaging the membranes, the levels of lipin 1 and 2 were determined by immunoblotting and used to normalize the amount of 32P incorporated. Insulin induces a significant degree of 32P incorporation into lipin 1 as reported previously; however, despite a high degree of basal phosphorylation, insulin did not increase the amount of radiolabel in lipin 2 (Fig. 7A) (12). In addition, although numerous publications have described lipin 1 phosphorylation as dependent on the activity of mTOR (Fig. 7) (11–13), complete inhibition of mTORC1 and -2 activities by the dual mTOR inhibitor Torin1 did not affect the phosphorylation of lipin 2. These experiments demonstrate that in 3T3-L1 adipocytes phosphorylation of lipin 2 is neither stimulated by insulin nor sensitive to mTOR inhibition. Finally, Ser-106 in lipin 1 is specifically phosphorylated in response to insulin in an mTOR-dependent manner (27). Although this phosphosite is conserved in lipin 2, and the phosphospecific antibody previously described does recognize this phosphorylation, no change in immunoreactivity for lipin 2 was seen with either insulin or Torin1 (Fig. 7, A and B).
FIGURE 7.
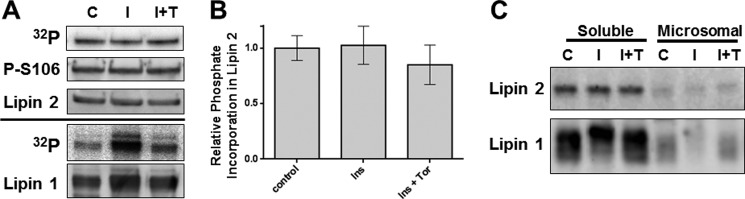
Phosphorylation of lipin 1 and 2 in 3T3-L1 adipocytes. A, 3T3-L1 adipocytes were cultured with 0.5 mCi/ml [32P]orthophosphate for 2 h in the absence of serum. Treatments were as follows: with or without 10 milliunits/ml insulin for the last 15 min (control, C or I) or Torin1 pretreatment for 30 min prior to insulin stimulation (I+T). Endogenous lipin 1 and FLAG-tagged lipin 2 expressed by adenovirus were immunoprecipitated with lipin 1 or FLAG antibodies, subjected to SDS-PAGE, and transferred to PVDF membrane for phosphorimaging and immunoblotting. Representative immunoblot and phosphorimager from triplicate experiments are shown. B, quantitation of data in A, n = 3. C, 3T3-L1 adipocytes were serum-starved for 2 h (control, C) and then treated with or without insulin (I) and insulin plus Torin1 (I+T) as described in A. After insulin stimulation, fractions containing soluble and microsomal proteins were isolated, and lipin 1 and 2 immunoblots were prepared.
Phosphorylation of lipin 1 via the mTOR signaling pathway regulates its intracellular localization (13). Although we saw no reduction in lipin 2 phosphorylation upon mTOR inhibition, we wanted to determine whether lipin 2 intracellular localization was changed under the same conditions. 3T3-L1 adipocytes were treated with or without the mTORC1 and -2 dual inhibitor, Torin1, and insulin and then subjected to biochemical fractionation (Fig. 7C). As reported previously, there is a translocation of lipin 1 from the microsomal fraction to the soluble fraction upon insulin stimulation, and 30 min of Torin1 pretreatment completely blocks this translocation, unlike what was reported for rapamycin (12). There was no change in lipin 2 localization with either insulin or Torin1 treatment.
As an additional confirmation for these observations, we fixed differentiated 3T3-L1 adipocytes and visualized endogenous lipin 2 expression by immunofluorescence staining (Fig. 8). As a control we simultaneously visualized lipin 1 under these conditions. Either lipid droplets (BODIPY, Fig. 8, A and B) or the ER (protein-disulfide isomerase, Fig. 8, C and D) was also visualized. As expected, lipin 1 showed a cytosolic localization that was altered to ER membrane/nuclear location after overnight Torin1 treatment. It was very clear that lipin 2 showed no such change in location with Torin1 treatment. Punctate staining of lipin 2 was observed throughout the cell, and localization was not altered with inhibition of mTOR signaling. Therefore, lipin 2 phosphorylation and localization appear to be insensitive to insulin stimulation or mTOR inhibition.
FIGURE 8.

Lipin 2 subcellular localization in 3T3-L1 adipocytes. 3T3-L1 adipocytes were plated onto coverslips in 6-well plates and incubated in DMEM with 10% FBS. On day 8, adipocytes were treated overnight (16 h) with either 250 nm Torin1 or vehicle (0.025% DMSO). A, red, endogenous lipin 1; B, endogenous lipin 2; green, BODIPY; blue, DAPI. C, red, endogenous lipin 1; D, endogenous lipin 2; green, protein-disulfide isomerase; blue, DAPI. Con, control.
DISCUSSION
These studies establish that lipin 2 is a constitutively active PAP enzyme with respect to phosphorylation. Using a combination of enzyme kinetics, mass spectrometry, and immunofluorescence, we have provided strong convergent evidence. These findings indicate that biochemical regulation of lipin 2 PAP activity is quite different from lipin 1. The implications are important for a better understanding of the distinct and overlapping tissue-specific expression of lipin 1 and 2, as well as the resulting phenotype in mice and humans when expression is lost.
The finding that lipin 2 membrane binding and PAP activity are stimulated by di-anionic PA suggests that lipin 2 binds PA by the electrostatic hydrogen bond switch mechanism. This is similar to previous studies demonstrating that lipin 1 binds PA in a similar way. This suggests that perhaps the charge sensing ability of lipin 1 and 2 is a defining characteristic of the lipin family and possibly other PA-binding proteins in general (28, 29). Therefore, previously unappreciated aspects of cellular physiology might be central to lipin family regulation. Considering that the second pKa value for the PA phosphate group falls within the physiological pH range, fluctuations in intracellular pH and changes in the ratios of di-anionic to mono-anionic PA at the ER membrane could potentially influence both lipin 1 and 2 cellular PAP activity. Furthermore, alterations in the relative abundance of PE in the endoplasmic reticular membrane are potential means of accomplishing such changes in this ratio. It is interesting to consider that the lipin family substrate can exert a form of regulation on its catalytic effector simply by the composition of the surrounding membrane. Perhaps the differential tissue expression of the lipins has evolved to take advantage of unique cellular membrane environments, and thus different biochemical presentations of PA allow for more efficient lipid processing. The kinetic studies performed herein suggest that this may be the case for both lipin 1 and 2.
In stark contrast to lipin 1, phosphorylation of lipin 2 has no effect on PAP activity. This suggests that there is more post-translational control of lipin 1 PAP activity, whereas lipin 2 might be considered a constitutively active PAP enzyme. This is best illustrated by the differences in the catalytic efficiencies of lipin 1 and 2 with respect to phosphorylation (Table 1). At 30 mol % PE, dephosphorylation of lipin 2 has no effect on catalytic efficiency, whereas for lipin 1, dephosphorylation greatly increases catalytic efficiency (100% increase, Fig. 9) (15). Whereas this study has examined how phosphorylation affects the PAP activity of lipin 2 in an isolated system, if such an effect exists within cells it is likely to be exerted through interactions with other regulatory proteins, such as the 14-3-3s (30). However, the lack of stimulation of lipin 2 phosphorylation by insulin and in the absence of alterations in lipin 2 localization during stimulation suggests that lipin 2 PAP activity is not acutely regulated. Interestingly, although the PAP activity of lipin 2 was roughly a third of that of lipin 1 using PA/PC liposomes, the PAP activity of lipin 2 against Triton X-100/PA micelles was substantially lower than lipin 1 (∼1%). Whether this represents a detergent sensitivity or simply reflects the ability of the two enzymes to access substrate under differing modes of presentation is unknown.
FIGURE 9.

Model of lipin 1 versus lipin 2 enzymatic activity. A, comparison of specific activity at saturating PA concentrations between lipin 1 and 2 measured with liposomes containing 0 and 30 mol % PE and Triton X-100/PA micelles. Data were derived from the data contained herein and Eaton et al. (15). B, schematic representing important similarities and differences between lipin 1 and 2. NLIP and CLIP are conserved NH2- and COOH-lipin homology domains; PBD is the polybasic domain.
It is also unclear mechanistically how lipin 1 PAP activity is negatively regulated by phosphorylation and lipin 2 activity is not. Differential phosphorylation between the two isoforms may provide an explanation. Two phosphorylated residues identified in lipin 2 are of significant interest. Ser-106 of lipin 1 has been unambiguously demonstrated to be downstream of mTOR as demonstrated by its sensitivity to rapamycin and Torin1 (12, 13). Ser-106 is found at the very end of the NLIP domain (31), a region of the lipin family predicted to fold as an immunoglobulin-like β-sandwich (32). Preventing Ser-106 phosphorylation by mutation to Ala does not affect lipin 1 localization or PAP activity (13). Despite a high degree of similarity in the surrounding sequence, Ser-106 of lipin 2, although phosphorylated, shows no sensitivity to mTOR inhibition. Lipin 1 contains a serine-rich domain with up to six phosphorylated Ser and Thr residues from amino acids 291 to 298 (numbering for lipin 1b) that has been implicated in binding to 14-3-3 to regulate nuclear localization and has been termed the serine-rich domain (13, 30). Within lipin 2, only residue Ser-243 was found to be phosphorylated. Interestingly, this residue is found in a conserved micro-homology domain PKSDSEL, one of the few regions of homology within the low homology region in all three lipin family proteins. However, outside of this very short domain, there is little similarity between the lipin family members in the low homology region, and this falls within a region of no obvious predicted secondary structure. A more detailed understanding of the higher order structure within the lipin family will be necessary to understand precisely how phosphorylation affects PAP activity.
Studies in cell culture as well as lipin 2 knock-out mice show that the expression of lipin 1 and 2 is inversely correlated, most likely via a post-transcriptional mechanism (6, 9, 33). Cells appear to adapt to the loss of lipin 1 PAP activity by increasing PAP activity through the induction of lipin 2. However, our studies have demonstrated that lipin 2 cannot be negatively regulated via acute hormonal stimulation. Thus, in instances where the loss of lipin 1 leads to increased expression of the nonregulatable PAP activity of lipin 2, it should be considered that the phenotypic consequences may be ascribed not to loss of PAP activity but rather to the occurrence of a compensatory but nonregulatable PAP activity. For example, in the fatty liver dystrophy (fld) mice, the loss of lipin 1 causes only a modest decline in the overall levels of PAP activity in the liver due primarily to the induction of lipin 2 (6, 27). However, as the name of these animals implies, there is ectopic accumulation of triglycerides found in the liver, rather than a defect as might be supposed from decreased PAP activity. It may be that the dysregulation of the PAP activity in the liver in the form of lipin 2 accounts for the pathological accumulation of lipid. Future work investigating the physiological roles of these paralogs should consider their functional differences, particularly in light of the observed developmental compensation.
It has been demonstrated that a portion of lipin 2 is associated with a detergent-insoluble fraction in HeLa cells that is only completely extractable by the inclusion of high salt concentrations (9). We also observed that more rigorous conditions were required for complete isolation of lipin 2 (see “Experimental Procedures”). However, by directly measuring lipin 2 affinity for membranes containing PA, we found that isolated lipin 2 has a far lower affinity than lipin 1, although the latter is easily solubilized by detergent. Because lipin 2 is a peripheral membrane protein, it is curious that mild lysis conditions are insufficient for complete solubility. Future directions will need to investigate whether lipin 2 associates with detergent-insoluble lipid domains or with an insoluble integral membrane protein or components of the cytoskeleton.
Cellular fractionation studies suggest that the majority of both lipin species are found in the soluble fraction. Immunofluorescent staining of 3T3-L1 adipocytes shows that endogenous lipin 1 and lipin 2 form punctate structures that colocalize with the ER. The precise nature of these structures is currently unclear. We have previously shown that within cells the lipins form tetramers (34), and by atomic force microscopy, we have found that recombinant lipin 1 can form even higher order structures on lipin bilayers (35). In addition, lipin 1 has been found to interact with the human lipodystrophy protein seipin (36), and seipin itself has been found to form large oligomeric structures (37–39). Although the identification of lipin localization to punctate spots is interesting, further study will be necessary to uncover the nature and/or function of lipin protein cellular localization to these structures.
Lipin 1 shows dramatic changes in cellular localization from the cytosol to the nucleus with Torin1 treatment, whereas lipin 2 localization does not appear to be affected by inhibition of mTORC1- and -2-dependent signaling. This further suggests distinct roles for lipin 1 and 2. Lipin 1 movement to the nucleus is directly controlled by mTORC1-dependent phosphorylation (13). Nuclear lipin 1 inhibits sterol regulatory element-binding protein transcriptional activity, which places lipin 1 within the mTOR/sterol regulatory element-binding protein signaling axis. Lipin 2 has been clearly shown to coactivate transcription through peroxisome proliferator-activated receptor α-PGC1-α (40). Considering that the localization of lipin 2 does not change with Torin1 treatment suggests that it is not a player in mTOR's role in lipogenic control, further distinguishing lipin 1 from lipin 2.
Our conclusions support a role for lipin 2 as a constitutive enzyme that provides relatively low levels of PAP activity that is not under acute negative regulation. This contrasts with lipin 1 functioning as a more active PAP enzyme that is under tight negative regulation by hormonal signaling.
Acknowledgments
We acknowledge the technical assistance of Rebecca C. Grande. We thank Dr. Zygmunt Derewenda for use of the DynaPro DLS and Dr. Carl Creutz for critical reading of the manuscript.
This work was supported, in whole or in part, by National Institutes of Health Grants R00CA140789 and R01 DK078187 (to B. N. F.). This work was also supported by American Diabetes Association Junior Faculty Grant 7-11-JF-21 (to T. E. H.) and an Ellison Medical Foundation New Scholar award (to J. V.).
- ER
- endoplasmic reticulum
- DAG
- diacylglycerol
- mTOR
- mammalian target of rapamycin
- PAP
- phosphatidic acid phosphatase
- PC
- phosphatidylcholine
- PE
- phosphatidylethanolamine
- PA
- phosphatidic acid
- TAG
- triacylglycerol.
REFERENCES
- 1. Han G. S., Wu W. I., Carman G. M. (2006) The Saccharomyces cerevisiae lipin homolog is a Mg2+-dependent phosphatidate phosphatase enzyme. J. Biol. Chem. 281, 9210–9218 [DOI] [PMC free article] [PubMed] [Google Scholar]
- 2. Harris T. E., Finck B. N. (2011) Dual function lipin proteins and glycerolipid metabolism. Trends Endocrinol. Metab. 22, 226–233 [DOI] [PMC free article] [PubMed] [Google Scholar]
- 3. Coleman R. A., Lee D. P. (2004) Enzymes of triacylglycerol synthesis and their regulation. Prog. Lipid Res. 43, 134–176 [DOI] [PubMed] [Google Scholar]
- 4. Kennedy E. P. (1956) The biological synthesis of phospholipids. Can. J. Biochem. Physiol. 34, 334–348 [PubMed] [Google Scholar]
- 5. Csaki L. S., Dwyer J. R., Fong L. G., Tontonoz P., Young S. G., Reue K. (2013) Lipins, lipinopathies, and the modulation of cellular lipid storage and signaling. Prog. Lipid Res. 52, 305–316 [DOI] [PMC free article] [PubMed] [Google Scholar]
- 6. Gropler M. C., Harris T. E., Hall A. M., Wolins N. E., Gross R. W., Han X., Chen Z., Finck B. N. (2009) Lipin 2 is a liver-enriched phosphatidate phosphohydrolase enzyme that is dynamically regulated by fasting and obesity in mice. J. Biol. Chem. 284, 6763–6772 [DOI] [PMC free article] [PubMed] [Google Scholar]
- 7. Ryu D., Seo W. Y., Yoon Y. S., Kim Y. N., Kim S. S., Kim H. J., Park T. S., Choi C. S., Koo S. H. (2011) Endoplasmic reticulum stress promotes LIPIN2-dependent hepatic insulin resistance. Diabetes 60, 1072–1081 [DOI] [PMC free article] [PubMed] [Google Scholar]
- 8. Sembongi H., Miranda M., Han G. S., Fakas S., Grimsey N., Vendrell J., Carman G. M., Siniossoglou S. (2013) Distinct roles of the phosphatidate phosphatases lipin 1 and 2 during adipogenesis and lipid droplet biogenesis in 3T3-L1 Cells. J. Biol. Chem. 288, 34502–34513 [DOI] [PMC free article] [PubMed] [Google Scholar]
- 9. Grimsey N., Han G. S., O'Hara L., Rochford J. J., Carman G. M., Siniossoglou S. (2008) Temporal and spatial regulation of the phosphatidate phosphatases lipin 1 and 2. J. Biol. Chem. 283, 29166–29174 [DOI] [PMC free article] [PubMed] [Google Scholar]
- 10. Majeed H. A., Al-Tarawna M., El-Shanti H., Kamel B., Al-Khalaileh F. (2001) The syndrome of chronic recurrent multifocal osteomyelitis and congenital dyserythropoietic anaemia. Report of a new family and a review. Eur. J. Pediatr. 160, 705–710 [DOI] [PubMed] [Google Scholar]
- 11. Huffman T. A., Mothe-Satney I., Lawrence J. C., Jr. (2002) Insulin-stimulated phosphorylation of lipin mediated by the mammalian target of rapamycin. Proc. Natl. Acad. Sci. U. S. A. 99, 1047–1052 [DOI] [PMC free article] [PubMed] [Google Scholar]
- 12. Harris T. E., Huffman T. A., Chi A., Shabanowitz J., Hunt D. F., Kumar A., Lawrence J. C., Jr. (2007) Insulin controls subcellular localization and multisite phosphorylation of the phosphatidic acid phosphatase, lipin 1. J. Biol. Chem. 282, 277–286 [DOI] [PubMed] [Google Scholar]
- 13. Peterson T. R., Sengupta S. S., Harris T. E., Carmack A. E., Kang S. A., Balderas E., Guertin D. A., Madden K. L., Carpenter A. E., Finck B. N., Sabatini D. M. (2011) mTOR complex 1 regulates lipin 1 localization to control the SREBP pathway. Cell 146, 408–420 [DOI] [PMC free article] [PubMed] [Google Scholar]
- 14. Kooijman E. E., Carter K. M., van Laar E. G., Chupin V., Burger K. N., de Kruijff B. (2005) What makes the bioactive lipids phosphatidic acid and lysophosphatidic acid so special? Biochemistry 44, 17007–17015 [DOI] [PubMed] [Google Scholar]
- 15. Eaton J. M., Mullins G. R., Brindley D. N., Harris T. E. (2013) Phosphorylation of lipin 1 and charge on the phosphatidic acid headgroup control its phosphatidic acid phosphatase activity and membrane association. J. Biol. Chem. 288, 9933–9945 [DOI] [PMC free article] [PubMed] [Google Scholar]
- 16. Kooijman E. E., Tieleman D. P., Testerink C., Munnik T., Rijkers D. T., Burger K. N., de Kruijff B. (2007) An electrostatic/hydrogen bond switch as the basis for the specific interaction of phosphatidic acid with proteins. J. Biol. Chem. 282, 11356–11364 [DOI] [PubMed] [Google Scholar]
- 17. Donkor J., Sariahmetoglu M., Dewald J., Brindley D. N., Reue K. (2007) Three mammalian lipins act as phosphatidate phosphatases with distinct tissue expression patterns. J. Biol. Chem. 282, 3450–3457 [DOI] [PubMed] [Google Scholar]
- 18. Brindley D. N., Pilquil C., Sariahmetoglu M., Reue K. (2009) Phosphatidate degradation: phosphatidate phosphatases (lipins) and lipid phosphate phosphatases. Biochim. Biophys. Acta 1791, 956–961 [DOI] [PMC free article] [PubMed] [Google Scholar]
- 19. Luo J., Deng Z. L., Luo X., Tang N., Song W. X., Chen J., Sharff K. A., Luu H. H., Haydon R. C., Kinzler K. W., Vogelstein B., He T. C. (2007) A protocol for rapid generation of recombinant adenoviruses using the AdEasy system. Nat. Protoc. 2, 1236–1247 [DOI] [PubMed] [Google Scholar]
- 20. MacDonald R. C., MacDonald R. I., Menco B. P., Takeshita K., Subbarao N. K., Hu L. R. (1991) Small-volume extrusion apparatus for preparation of large, unilamellar vesicles. Biochim. Biophys. Acta 1061, 297–303 [DOI] [PubMed] [Google Scholar]
- 21. Han G. S., Carman G. M. (2004) Assaying lipid phosphate phosphatase activities. Methods Mol. Biol. 284, 209–216 [DOI] [PubMed] [Google Scholar]
- 22. Höfer C. T., Herrmann A., Müller P. (2010) Use of liposomes for studying interactions of soluble proteins with cellular membranes. Methods Mol. Biol. 606, 69–82 [DOI] [PubMed] [Google Scholar]
- 23. Ficarro S. B., McCleland M. L., Stukenberg P. T., Burke D. J., Ross M. M., Shabanowitz J., Hunt D. F., White F. M. (2002) Phosphoproteome analysis by mass spectrometry and its application to Saccharomyces cerevisiae. Nat. Biotechnol. 20, 301–305 [DOI] [PubMed] [Google Scholar]
- 24. Beausoleil S. A., Villén J., Gerber S. A., Rush J., Gygi S. P. (2006) A probability-based approach for high-throughput protein phosphorylation analysis and site localization. Nat. Biotechnol. 24, 1285–1292 [DOI] [PubMed] [Google Scholar]
- 25. Carman G. M., Deems R. A., Dennis E. A. (1995) Lipid signaling enzymes and surface dilution kinetics. J. Biol. Chem. 270, 18711–18714 [DOI] [PubMed] [Google Scholar]
- 26. Han G. S., Carman G. M. (2010) Characterization of the human LPIN1-encoded phosphatidate phosphatase isoforms. J. Biol. Chem. 285, 14628–14638 [DOI] [PMC free article] [PubMed] [Google Scholar]
- 27. Harris T. E., Chi A., Shabanowitz J., Hunt D. F., Rhoads R. E., Lawrence J. C., Jr. (2006) mTOR-dependent stimulation of the association of eIF4G and eIF3 by insulin. EMBO J. 25, 1659–1668 [DOI] [PMC free article] [PubMed] [Google Scholar]
- 28. Young B. P., Shin J. J., Orij R., Chao J. T., Li S. C., Guan X. L., Khong A., Jan E., Wenk M. R., Prinz W. A., Smits G. J., Loewen C. J. (2010) Phosphatidic acid is a pH biosensor that links membrane biogenesis to metabolism. Science 329, 1085–1088 [DOI] [PubMed] [Google Scholar]
- 29. Shin J. J., Loewen C. J. (2011) Putting the pH into phosphatidic acid signaling. BMC Biol. 9, 85. [DOI] [PMC free article] [PubMed] [Google Scholar]
- 30. Péterfy M., Harris T. E., Fujita N., Reue K. (2010) Insulin-stimulated interaction with 14-3-3 promotes cytoplasmic localization of lipin-1 in adipocytes. J. Biol. Chem. 285, 3857–3864 [DOI] [PMC free article] [PubMed] [Google Scholar]
- 31. Péterfy M., Phan J., Xu P., Reue K. (2001) Lipodystrophy in the fld mouse results from mutation of a new gene encoding a nuclear protein, lipin. Nat. Genet. 27, 121–124 [DOI] [PubMed] [Google Scholar]
- 32. Kelley L. A., Sternberg M. J. (2009) Protein structure prediction on the Web: a case study using the Phyre server. Nat. Protoc. 4, 363–371 [DOI] [PubMed] [Google Scholar]
- 33. Dwyer J. R., Donkor J., Zhang P., Csaki L. S., Vergnes L., Lee J. M., Dewald J., Brindley D. N., Atti E., Tetradis S., Yoshinaga Y., De Jong P. J., Fong L. G., Young S. G., Reue K. (2012) Mouse lipin-1 and lipin-2 cooperate to maintain glycerolipid homeostasis in liver and aging cerebellum. Proc. Natl. Acad. Sci. U. S. A. 109, E2486–E2495 [DOI] [PMC free article] [PubMed] [Google Scholar]
- 34. Liu G. H., Qu J., Carmack A. E., Kim H. B., Chen C., Ren H., Morris A. J., Finck B. N., Harris T. E. (2010) Lipin proteins form homo- and hetero-oligomers. Biochem. J. 432, 65–76 [DOI] [PMC free article] [PubMed] [Google Scholar]
- 35. Creutz C. E., Eaton J. M., Harris T. E. (2013) Assembly of high molecular weight complexes of lipin on a supported lipid bilayer observed by atomic force microscopy. Biochemistry 52, 5092–5102 [DOI] [PMC free article] [PubMed] [Google Scholar]
- 36. Sim M. F., Dennis R. J., Aubry E. M., Ramanathan N., Sembongi H., Saudek V., Ito D., O'Rahilly S., Siniossoglou S., Rochford J. J. (2012) The human lipodystrophy protein seipin is an ER membrane adaptor for the adipogenic PA phosphatase lipin 1. Mol. Metab. 2, 38–46 [DOI] [PMC free article] [PubMed] [Google Scholar]
- 37. Fei W., Li H., Shui G., Kapterian T. S., Bielby C., Du X., Brown A. J., Li P., Wenk M. R., Liu P., Yang H. (2011) Molecular characterization of seipin and its mutants: implications for seipin in triacylglycerol synthesis. J. Lipid Res. 52, 2136–2147 [DOI] [PMC free article] [PubMed] [Google Scholar]
- 38. Binns D., Lee S., Hilton C. L., Jiang Q. X., Goodman J. M. (2010) Seipin is a discrete homooligomer. Biochemistry 49, 10747–10755 [DOI] [PMC free article] [PubMed] [Google Scholar]
- 39. Sim M. F., Talukder M. M., Dennis R. J., O'Rahilly S., Edwardson J. M., Rochford J. J. (2013) Analysis of naturally occurring mutations in the human lipodystrophy protein seipin reveals multiple potential pathogenic mechanisms. Diabetologia 56, 2498–2506 [DOI] [PMC free article] [PubMed] [Google Scholar]
- 40. Donkor J., Zhang P., Wong S., O'Loughlin L., Dewald J., Kok B. P., Brindley D. N., Reue K. (2009) A conserved serine residue is required for the phosphatidate phosphatase activity but not the transcriptional coactivator functions of lipin-1 and lipin-2. J. Biol. Chem. 284, 29968–29978 [DOI] [PMC free article] [PubMed] [Google Scholar]