

In recent years, contrast-enhanced magnetic resonance imaging (MRI) has shown promise for in vivo visualization of reporter gene expression and molecular biomarkers of various diseases.[1] MRI can provide high-resolution images of the entire body with exquisite image contrast. However, compared to other imaging modalities MRI has relatively poor sensitivity to low levels of molecular targets, therefore design of highly potent molecular probes is crucial for success.[2] “Smart” or “activatable” probes that modulate their MR properties (relaxivity) resulting in signal amplification upon molecular target interaction can greatly help improve MRI detection of specific molecular events. A few gadolinium (Gd)-based “smart” probes have been developed including those that are responsive to beta-galactosidase and myeloperoxidase.[3] Herein we report the rational design of a new, potentially generalized “smart” MR probe platform based on a biocompatible and controllable condensation reaction between 1,2-aminothiol and 2-cyanobenzothiazole (CBT).
This condensation reaction has been shown to occur in vitro and in living cells under the control of a variety of physiological conditions including pH change, disulfide reduction, or enzymatic cleavage to synthesize nanoparticles with diameters ranging from 8 nm to 170 nm.[4] We envisioned that a CBT-based, Gd-containing “smart” probe could similarly condense to produce more hydrophobic oligomers that self-assemble to form Gd-containing nanoparticles (Gd-NPs) in response to the molecular target. These assembled Gd-NPs should have relaxivity enhancement compared with that of the precursor with identical Gd concentration.
As the proof-of-principle demonstration of our “smart” MRI probe concept, we designed the probe 1 that could be activated by disulfide reduction (Scheme 1). Thiol redox is central to the control of cell fate and associated with various abnormal biochemical processes.[5] Probe 1 contains the MR moiety DOTA-Gd chelate for MR imaging. Disulfide reduction either by tris(2-carboxyethyl)phosphine (TCEP) (in vitro) or glutathione (GSH) (in cells) generates an intermediate with a free 1,2-aminothiol group. The free 1,2-aminothiol reacts with the cyano group on the CBT motif to initiate condensation leading to the formation of larger, more hydrophobic molecules (i.e., oligomers), which self-assemble to form nanoparticles with enhanced relaxivity, presumably due to increased rotational correlation time (Scheme 1).
Scheme 1.

Reduction-controlled condensation of 1 to assemble Gd-containing nanoparticles (Gd-NPs). 2 is the control probe that cannot be reduced to induce condensation.
1 mM of 1 is soluble in 0.2 M phosphate buffer. When treated with 4 mM TCEP at RT for 1 h, condensation of 1 occurs to afford cyclized dimer, trimer, tetramer, and higher-order oligomers, detected by matrix-assisted laser desorption/ionization (MALDI) mass spectrometry (Figure 1). UV-Vis spectra at 500–700 nm and dynamic light scattering (DLS) measurements consistently showed the aggregation of particles with a mean diameter of 275 nm (Figure S4). Transmission electron microscope (TEM) images revealed the shapes of separated Gd-NPs with diameters ranging from 100 nm to 360 nm (Figure 1). The presence of Gd was confirmed by energy dispersive X-ray (EDX) spectroscopy (Figure S4d). Besides the nanoparticles, the DLS data also showed particles with a mean diameter of 2.1 μm likely due to further aggregation of some nanoparticles at this concentration (1 mM), consistent with the TEM observation (Figure S4c). Under the same conditions, the control probe 2 whose thiol group was methylated could not be reduced by TCEP to form condensation products detected by HPLC and UV-Vis spectroscopy (Figure S5).
Figure 1.
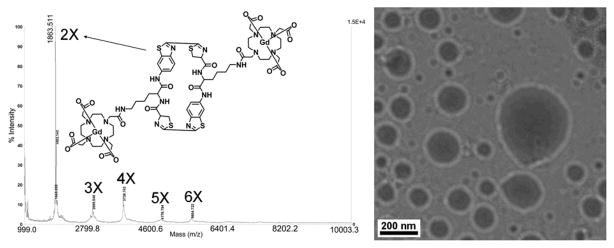
Left, MALDI mass spectrum of the oligomer mixtures of 1 after TCEP reduction. Right, representative TEM image of the condensation products of 1 in 0.2 M phosphate buffer (pH 7.4) treated with 4 mM TCEP.
Nuclear magnetic relaxation dispersion (NMRD) is a technique to measure the longitudinal relaxation rate (R1) of water protons in solution as a function of NMR filed strength, or, equivalently, Larmor frequency. NMRD can be used to study dynamics in condensed matter as the longitudinal relaxation time T1 (T1=1/R1) is determined by fluctuations in local fields. At 768 μM in 0.2 M phosphate buffer (pH 7.4) and different temperatures ranging from 5 to 35 °C, in the absence of TCEP both 1 and 2 have decreased relaxation rates as either the temperature or the magnetic field is increased (Figure S6a&c). These NMRD profiles are typical of those measured from solutions of small molecule paramagnetic complexes; the shape is governed by a combination of rotational correlation time of the complex and the exchange rate of the inner sphere water coordinated water molecule.[6] Importantly, after adding TCEP, the profiles of the above two solutions are clearly different. The NMRD profile of 2 with TCEP remained nearly unchanged compared to 2 without TCEP, suggesting no change in rotational correlation time or coordinated water exchange rate, and consistent with the absence of nanoparticle formation (Figure S6d). In contrast, the solution of 1 with TCEP showed increased relaxation rates upon the increase of temperature and a broad hump appeared in the NMRD profile from 8.4 to 127.7 MHz (0.2 to 3 T), suggesting changes in rotational correlation time due to the formation of nanoparticles with measurable sizes in the solution (Figure S6b).[7] Figure 2a shows the NMRD profiles of 1 in 0.2 M phosphate buffer (pH 7.4) before and after condensation by TCEP at 35 °C. At 25.6 MHz (~0.6 T), the relaxation rate of 1 after condensation increased by 160% compared to 1 before condensation. Even at 64 MHz (1.5 T), the relaxation rate increased by 110% after condensation. In contrast, the relaxation rate of 2 did not obviously change before and after TCEP addition (Figure 2b).
Figure 2.
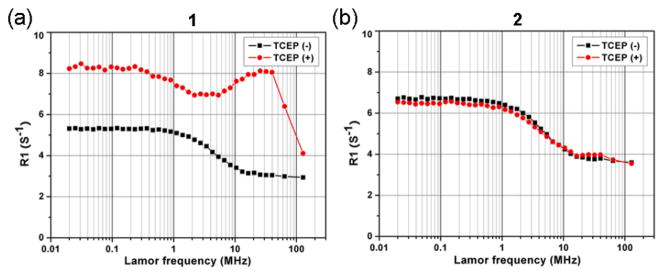
NMRD profiles of 1 (a) and 2 (b) treated with (red circles) and without (black squares) 4 mM of TCEP at 35 °C. The concentrations of 1 and 2 are 768 μM in 0.2 M phosphate buffer (pH 7.4).
We also conducted T1-weighted MR imaging of 1 and 2 with and without TCEP on both 1.5 T and 3 T MRI scanners (Figure S7). Plots of signal intensity versus inversion time clearly showed that after TCEP reduction 1 had a shortened T1 relaxation time while 2 did not (Figure S7c&d). Using inductively coupled plasma atomic emission spectroscopy (ICP-AES) to measure the concentration of Gd3+ in the imaged samples, we calculated the relaxivity of each probe according to the equation r1 = ΔR1/[concentration]. At 35 °C and 1.5 T, the relaxivity of 1 is 3.9 mM−1s−1 and the relaxivity of its assembled products increases to 8.3 mM−1s−1. In contrast, the relaxivities of 2 before and after TCEP addition at 35 °C and 1.5 T remained nearly the same (4.8 and 4.9 mM−1s−1, respectively). These results indicate that, after condensation, the relaxivity of 1 is dramatically enhanced owing to the formation of Gd-NPs. Similarly, the relaxivity of 1 at 3 T increased by 40% after the TCEP addition (5.4 versus 3.8 mM−1s−1) and the relaxivity of 2 changed little before and after TCEP addition (4.7 and 4.6 mM−1s−1, respectively).
We next measured the relaxivity of 1 and 2 in the lysate of MDA-MB-468 cells (Figure S8). The relaxivities of both 1 and 2 in the cell lysate at 1.5 T are higher than that in TCEP-treated buffer (14.8 versus 8.3 mM−1s−1 for 1, and 10.5 versus 4.9 mM−1s−1 for 2). Consistent with the increase in the relaxivity after the TCEP reduction, the relaxivity of 1 in the cell lysate is also 40% higher than that of 2 at 1.5T and 35 °C (14.8 versus 10.5 mM−1s−1). HPLC analysis confirmed that cell lysate could similarly induce the condensation of 1 like TCEP and produce the cyclic oligomers (Figure S9).
We tested the cell permeability of 1 by imaging the uptake of its europium analog compound 3 (Figure 3) in live cells with two-photon laser confocal microscopy (TPLM). The europium compound 3 has luminescence emissions at 594 nm and 616 nm when excited at 355 nm or with two-photon excitation at 725 nm (Figure S10), as reported previously.[8] TPLM imaging of MDA-MB-468 cells incubated with 3 at 192 μM for 8 h shows the strong fluorescent signal (Figure 3). Under the same conditions, cells without 3 did not show detectable fluorescent signal. Since the replacement of Gd3+ in 1 should not affect cell uptake, this result suggests good cell permeability of 1. The coupled plasma atomic mass spectroscopy (ICP-MS) measurement of the uptake of 1 (299 μM) after 8 h incubatation in MDA-MB-468 cells showed the average gadolinium uptake of 0.074 fmol/cell and 0.137 fmol/cell after 24 h incubation, further supporting good cell permeability of 1.
Figure 3.
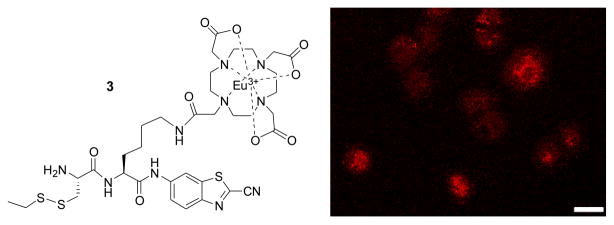
Structure of analog 3 and two-photon laser microscopy image (λEx = 725 nm, λEm = 565-615 nm) of MDA-MB-468 cells incubated with 3 at 192 μM for 8 h and then rinsed and fixed prior to imaging. Scale bar: 20 μm.
Finally, we performed T1 relaxometry of cell pellets loaded with probes 1 and 2. MDA-MB-468 cells were incubated with 1 (299 μM) or 2 (293 μM) for 2, 4, 8, or 24 hours. Each culture dish containing approximately 4 million cells was used to form a single fixed cell pellet in a mini-NMR tube (inner diameter 2.4 mm). Inversion-recovery MRI with 10 different inversion times was performed at 0.5 T, 1.5 T, and 3 T, from which the T1 relaxation time of each cell pellet was quantified; the number of cells per pellet was also counted. Following imaging, pellets were prepared for ICP-MS for absolute [Gd] quantification to permit calculation of T1 relaxivity. The T1 relaxivity is summarized in Table 1. Consistent with the results in buffer and cell lysates, the relaxivity of 1 in live cells was significantly higher at all the field strengths than that of 2. Both the relaxivities of 1 and 2 at 1.5 T are similar to that in cell lysates (17.40 versus 14.8 mM−1s−1 for 1, and 11.0 versus 10.5 mM−1s−1 for 2), and are much higher than that in TCEP-reduced buffer (17.40 versus 8.3 mM−1s−1 for 1, and 11.0 versus 4.9 mM−1s−1 for 2). These results demonstrate that as we reported before,[4] the condensation reaction and probe 1 can work in live cells upon the glutathione reduction.
Table 1.
The relaxivity of 1 and 2 in live cells at different field strength.
| MR Field Strength | Relaxivity of 1 (mM−1s−1) | Relaxivity of 2 (mM−1s−1) | Change (%) |
|---|---|---|---|
| 0.5 T | 18.88 | 9.25 | 104 |
| 1.5 T | 17.40 | 11.0 | 58 |
| 3 T | 11.69 | 8.91 | 31 |
In summary, we have successfully demonstrated that the condensation reaction between between 1,2-aminothiol and 2-cyanobenzothiazole can be employed to assemble Gd-NPs that have enhanced r1 relaxivity compared with its small molecular precursor. The MR agent reported here has shown good cell permeability. As we have shown previously, simple chemical modifications of this small molecule are possible, which would allow the generation of MR probes that are responsive to a variety of molecular targets.[4] In view of current methods of designing nanoparticles for MRI,[9] this new approach may provide us with a new platform of developing “smart” molecular MR probes.
Supplementary Material
Footnotes
This work has been supported by the Stanford University National Cancer Institute (NCI) Centers of Cancer Nanotechnology Excellence (1U54CA119367-01), and the NCI ICMIC@Stanford (1P50CA114747-06). P. Pandit is supported by a Stanford Molecular Imaging Scholars (SMIS) fellowship. The authors thank Dr. Richard Chin for assistance of the EDX experiment.
Supporting information for this article is available on the WWW under http://www.angewandte.org or from the author.
Contributor Information
Dr. Gaolin Liang, Molecular Imaging Program at Stanford, Department of Radiology, Stanford University, 1201 Welch Road, Stanford, California 94305-5484 (USA), Fax: (+1) 650-736-7925, Homepage: http://raolab.stanford.edu.
Dr. John Ronald, Email: jrao@stanford.edu, Molecular Imaging Program at Stanford, Department of Radiology, Stanford University, 1201 Welch Road, Stanford, California 94305-5484 (USA), Fax: (+1) 650-736-7925, Homepage: http://raolab.stanford.edu
Dr. Yunxin Chen, Imaging research laboratories, Robarts Research Institute, The University of Western Ontario, 100 Perth Drive, London N6A 5K8, Canada
Dr. Deju Ye, Molecular Imaging Program at Stanford, Department of Radiology, Stanford University, 1201 Welch Road, Stanford, California 94305-5484 (USA), Fax: (+1) 650-736-7925, Homepage: http://raolab.stanford.edu
Dr. Prachi Pandit, Molecular Imaging Program at Stanford, Department of Radiology, Stanford University, 1201 Welch Road, Stanford, California 94305-5484 (USA), Fax: (+1) 650-736-7925, Homepage: http://raolab.stanford.edu
Man Lung Ma, Molecular Imaging Program at Stanford, Department of Radiology, Stanford University, 1201 Welch Road, Stanford, California 94305-5484 (USA), Fax: (+1) 650-736-7925, Homepage: http://raolab.stanford.edu.
Prof. Brian Rutt, Molecular Imaging Program at Stanford, Department of Radiology, Stanford University, 1201 Welch Road, Stanford, California 94305-5484 (USA), Fax: (+1) 650-736-7925, Homepage: http://raolab.stanford.edu
Prof. Jianghong Rao, Molecular Imaging Program at Stanford, Department of Radiology, Stanford University, 1201 Welch Road, Stanford, California 94305-5484 (USA), Fax: (+1) 650-736-7925, Homepage: http://raolab.stanford.edu
References
- 1.(a) Xie J, Chen K, Lee HY, Xu CJ, Hsu AR, Peng S, Chen XY, Sun SH. J Am Chem Soc. 2008;130:7542. doi: 10.1021/ja802003h. [DOI] [PMC free article] [PubMed] [Google Scholar]; (b) Caravan P, Ellison JJ, McMurry TJ, Lauffer RB. Chem Rev. 1999;99:2293. doi: 10.1021/cr980440x. [DOI] [PubMed] [Google Scholar]; (c) Perez JM, Josephson L, O’Loughlin T, Hogemann D, Weissleder R. Nat Biotech. 2002;20:816. doi: 10.1038/nbt720. [DOI] [PubMed] [Google Scholar]
- 2.Terreno E, Castelli DD, Viale A, Aime S. Chem Rev. 2010;110:3019. doi: 10.1021/cr100025t. [DOI] [PubMed] [Google Scholar]
- 3.(a) Bogdanov A, Matuszewski L, Bremer C, Petrovsky A, Weissleder R. Mol Imaging. 2002;1:16. doi: 10.1162/15353500200200001. [DOI] [PubMed] [Google Scholar]; (b) Querol M, Bogdanov A. J Mag Res Imaging. 2006;24:971. doi: 10.1002/jmri.20724. [DOI] [PubMed] [Google Scholar]; (c) Querol M, Chen JW, Weissleder R, Bogdaniv AA. Org Lett. 2005;7:1719. doi: 10.1021/ol050208v. [DOI] [PubMed] [Google Scholar]; (d) Chen JW, Phm W, Weisleder R, Bogdanov AA. Mag Res Med. 2004;52:1021. doi: 10.1002/mrm.20270. [DOI] [PubMed] [Google Scholar]; (e) Nivorozhkin AL, Kolodziej AF, Caravan P, Greenfield MT, Lauffer RB, McMurry TJ. Angew Chem Int Ed. 2001;40:2903. [PubMed] [Google Scholar]; (f) Louie AY, Huber MM, Ahrens ET, Rothbacher U, Moats R, Jacobs RE, Fraser SE, Meade TJ. Nat Biotech. 2000;18:321. doi: 10.1038/73780. [DOI] [PubMed] [Google Scholar]; (g) Ronald JA, Chen JW, Chen YX, Hamilton AM, Rodriguez E, Reynolds F, Hegele RA, Rogers KA, Querol M, Bogdanov A, Weissleder R, Rutt BK. Circulation. 2009;120:592. doi: 10.1161/CIRCULATIONAHA.108.813998. [DOI] [PMC free article] [PubMed] [Google Scholar]
- 4.(a) Liang G, Ren H, Rao J. Nat Chem. 2010;2:54. doi: 10.1038/nchem.480. [DOI] [PMC free article] [PubMed] [Google Scholar]; (b) Ren H, Xiao F, Zhan K, Kim YP, Xie H, Xia Z, Rao J. Angew Chem Int Ed. 2009;48:9658. doi: 10.1002/anie.200903627. [DOI] [PMC free article] [PubMed] [Google Scholar]; (c) Ye J, Gao L, Ma ML, Rao J. Angew Chem Int Ed. 2011;50:2275. doi: 10.1002/anie.201006140. [DOI] [PubMed] [Google Scholar]
- 5.(a) Li LZ. Angew Chem Int Ed [Google Scholar]; Zhou R, Xu HN, Moon L, Zhong TX, Kim EJ, Qiao H, Reddy R, Leeper D, Chance B, Glickson JD. Proc Natl Acad Sci U S A. 2009;106:6608. doi: 10.1073/pnas.0901807106. [DOI] [PMC free article] [PubMed] [Google Scholar]; (b) Schafer FQ, Buettner GR. Free Radic Biol Med. 2001;30:1191. doi: 10.1016/s0891-5849(01)00480-4. [DOI] [PubMed] [Google Scholar]; (c) Franco R, Cidlowski J. Cell Death Differ. 2009;16:1303. doi: 10.1038/cdd.2009.107. [DOI] [PubMed] [Google Scholar]
- 6.Major JL, Parigi G, Luchinat C, Meade TJ. Proc Natl Acad Sci U S A. 2007;104:13881. doi: 10.1073/pnas.0706247104. [DOI] [PMC free article] [PubMed] [Google Scholar]
- 7.Koenig SH, Kellar KE. Magn Reson Med. 1995;34:227. doi: 10.1002/mrm.1910340214. [DOI] [PubMed] [Google Scholar]
- 8.Shen Y, Chambers MD, Clarke DR. Surf Coat Tech. 2008;203:456. [Google Scholar]
- 9.(a) Gao J, Liang G, Cheung JS, Pan Y, Kuang Y, Zhao F, Zhang B, Zhang X, Wu EX, Xu B. J Am Chem Soc. 2008;130:11828. doi: 10.1021/ja803920b. [DOI] [PubMed] [Google Scholar]; (b) Manus LM, Mastarone DJ, Waters EA, Zhang XQ, Schultz-Sikma EA, MacRenaris KW, Ho D, Meade TJ. Nano Lett. 2010;10:484. doi: 10.1021/nl903264h. [DOI] [PMC free article] [PubMed] [Google Scholar]; (c) Lee JH, Huh YM, Jun Y, Seo J, Jang J, Song HT, Kim S, Cho EJ, Yoon HG, Suh JS, Cheon J. Nat Med. 2007;13:95. doi: 10.1038/nm1467. [DOI] [PubMed] [Google Scholar]; (d) Mouli SK, Zhao LC, Omary RA, Thaxton CS. Nat Rev Urol. 7:84. doi: 10.1038/nrurol.2009.254. [DOI] [PubMed] [Google Scholar]; (e) Zhao M, Josephson L, Tang Y, Weissleder R. Angew Chem Int Ed. 2003;42:1375. doi: 10.1002/anie.200390352. [DOI] [PubMed] [Google Scholar]
Associated Data
This section collects any data citations, data availability statements, or supplementary materials included in this article.