Abstract
Micro-computed tomography (micro-CT) is a high-resolution imaging modality that is capable of analysing bone structure with a voxel size on the order of 10 μm. With the development of in vivo micro-CT, where disease progression and treatment can be monitored in a living animal over a period of time, this modality has become a standard tool for preclinical assessment of bone architecture during disease progression and treatment. For meaningful comparison between micro-CT studies, it is essential that the same parameters for data acquisition and analysis methods be used. This protocol outlines the common procedures that are currently used for sample preparation, scanning, reconstruction and analysis in micro-CT studies. Scan and analysis methods for trabecular and cortical bone are covered for the femur, tibia, vertebra and the full neonate body of small rodents. The analysis procedures using the software provided by ScancoMedical and Bruker are discussed, and the routinely used bone architectural parameters are outlined. This protocol also provides a section dedicated to in vivo scanning and analysis, which covers the topics of anaesthesia, radiation dose and image registration. Because of the expanding research using micro-CT to study other skeletal sites, as well as soft tissues, we also provide a review of current techniques to examine the skull and mandible, adipose tissue, vasculature, tumour severity and cartilage. Lists of recommended further reading and literature references are included to provide the reader with more detail on the methods described.
Introduction
Micro-computed tomography (micro-CT) has become a standard tool for the measurement and visualisation of bone structure. With an attainable isotropic voxel size of ⩽10 μm, this modality allows the three-dimensional (3D) nature of the bone structure to be visualised and numerous bone structural parameters to be quantified with a high degree of accuracy. Owing to the small field of view and high radiation dose, in vivo applications of micro-CT are limited to preclinical animal studies. With in vivo micro-CT, bone structural changes can be assessed over time in the same animal to monitor disease progression and treatment efficacy. It is important that standard scan settings and analysis regions are used in order to compare data from different studies. This protocol aims to cover common methods for sample preparation, scanning, reconstruction and analysis that are currently used in micro-CT studies of bone structure. Micro-CT has also become a popular tool to study soft tissues, and this protocol also provides a brief review of applications to adipose tissue, vasculature, tumour and cartilage. Lists of recommended further reading and literature references are included to provide the reader with further detail on the methods described.
Materials and methods
We begin this section with a description of sample preparation for ex vivo scanning, followed by standard procedures for micro-CT scanning and analysis, which can be applied to either in vivo or ex vivo scans. We then provide sections dedicated to in vivo scanning, where issues such as anaesthesia, radiation and long-term precision of measurements are discussed.
Ex vivo sample preparation
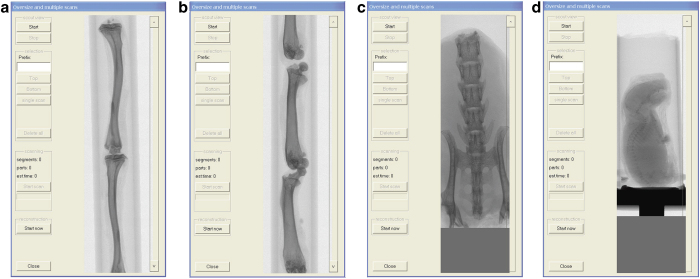
For ex vivo analysis of bone specimens from rodents, samples are isolated, fixed in formalin for 24 h, washed in PBS and then either stored in ethanol or frozen in sterile PBS at −20 °C. Alternatively, samples can be fixed in organic solvents, such as alcohols or acetone. If the samples will be used for biomechanical testing or histomorphometric analysis, freezing is the best storage method.1 For scanning, samples should be cleaned from surrounding soft tissue as much as possible and placed in a sample holder. Sample holders should be transparent to X-rays, of the right size according to the samples and should allow for sample stacking when appropriate. Samples can be scanned directly in medium, such as ethanol, saline, formalin or oil. Any of these methods will serve to prevent sample desiccation. For bone tissue, the attenuation properties of the medium are not as critical as for soft tissues, where scanning in aqueous medium can lead to loss of contrast. In-house sample holders can be made from 1-ml syringes, cut at both ends and adjusted to fit in the scanner.2 Such holders are ideal for scanning a stack of long bones, as 2–3 intact tibiae or 3 intact femora can fit at once (Figure 1). Alternatively, falcon tubes can be used to hold the sample, which may be more appropriate for lumbar spines or whole pups (Figure 1). To prevent movement of the sample within the holder, it can be wrapped tightly in parafilm or surrounded by a foam material. Images should be checked to ensure that sufficient contrast between the holder material and bone tissue is obtained.
Figure 1.
Scout scan of sample holders with specimen. (a) Stack of entire tibiae; (b) stack of entire femora; (c) lumbar spine; (d) entire 2-day-old mouse neonate.
Scanning procedure
General settings
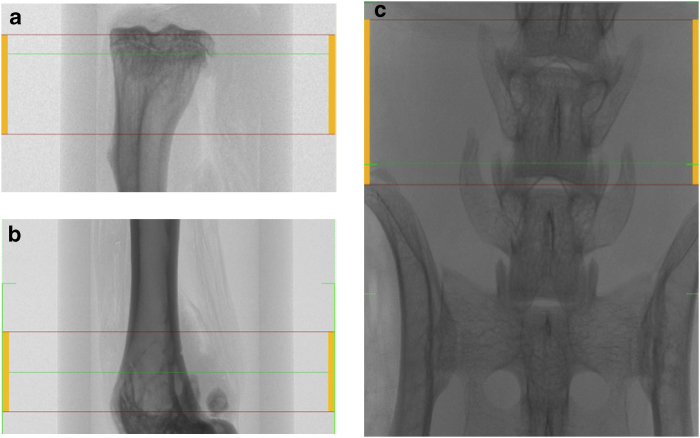
Detailed descriptions of scan settings and their effect on image quality have been described elsewhere;2,3,4 however, a brief description is given here. For scanning hard tissue such as bone, the X-ray source should be set at a voltage of 50–70 kV, with a current of 115–150 μA. This level of voltage is optimal for establishing high-contrast images of bone with minimal beam hardening. However, a lower voltage level may be appropriate depending on the sample being scanned (for example, for mouse neonates). To further reduce beam hardening, a 0.5-mm aluminium filter is used for absorbing the low-energy X-rays before or after they pass through the sample. The rotation step, frame averaging and integration time can also be adjusted to optimise image quality and scan time. The rotation step is the angle between successive projections. The frame averaging and integration time are the number of repeated measurements and length of projection at each angle, respectively. Reducing the rotation step, increasing the frame averaging and increasing the integration time will all improve the image quality by increasing the signal-to-noise ratio, but will result in larger scan and reconstruction times, larger file sizes and higher radiation doses. Finally, reducing the voxel size will allow for smaller structures to be visualised and quantified more accurately, but it will also increase the scan time, reconstruction time, file size and radiation dose. For accurate images of the trabecular microarchitecture, a voxel size of less than 20 μm in rats or 10 μm in mice is recommended.2 However, in cases where the trabecular microstructure is not being assessed, larger voxel sizes may be more appropriate in order to reduce the radiation exposure. The scout scan is used to select the scan volume within the sample (Figures 2, 3, 4). Detailed descriptions of the proper scan volumes are given in the following sections.
Figure 2.
Scanned area for trabecular bone analysis at the proximal tibial metaphysis (a), distal femoral metaphysis (b) and fifth lumbar (L5) vertebra of the spine (c).
Figure 3.
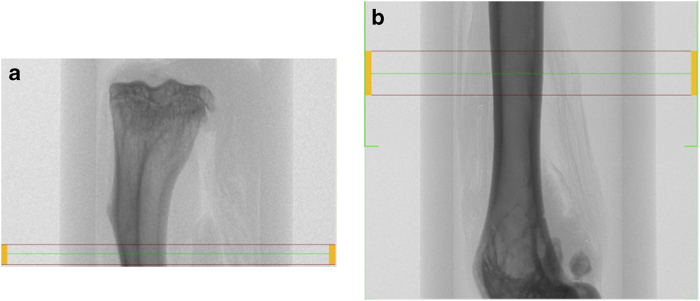
Area scanned for cortical bone analysis in tibial (a) and femoral (b) midpoints.
Figure 4.
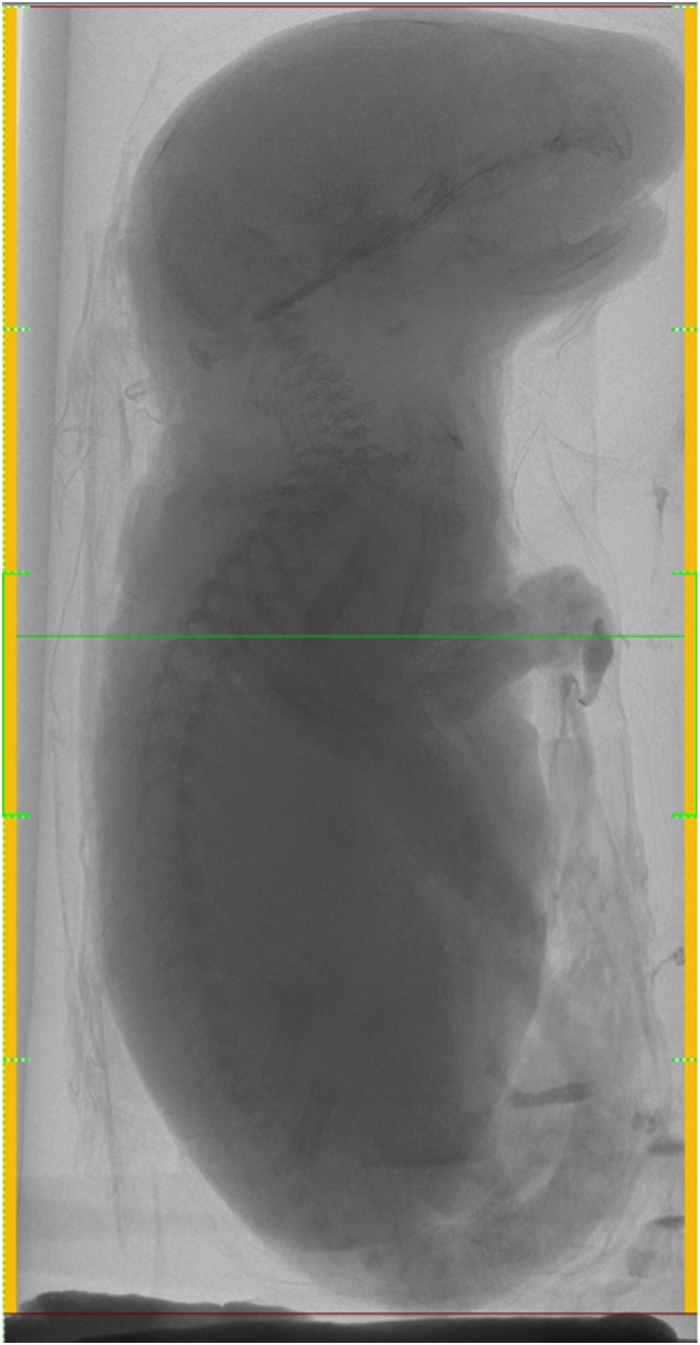
Scanned area for whole skeletal analysis of a 2-day-old mouse neonate.
Scan region: trabecular bone
Trabecular bone is most commonly assessed at the proximal tibial metaphysis, distal femoral metaphysis and lumbar vertebrae of the spine (Figure 2). However, trabecular bone within the femoral neck can also be analysed. The scans of the tibia typically start distal to the growth plate and those of the femur start proximal to the growth plate to capture the metaphyseal region. If the epiphyseal region is to be analysed, the entire proximal or distal region can be scanned.5 In rats, the scan typically starts 1 mm away from the growth plate to capture the remodelling, rather than modelling, characteristics.6,7,8,9 In mice, scans often start at the growth plate, as there is a smaller volume of bone available for analysis.10 However, scans starting at a distance of up to 0.29 mm from the growth plate have been reported.11 It is recommended to minimise the scanning of the growth plate itself to avoid the effects of radiation. The size of the scan in the axial direction typically ranges from 1 to 2 mm for mice10,11,12 and from 2 to 3 mm for rats.8,9,13 For the vertebra and femoral neck, the entire regions are scanned, and specific analysis volumes are segmented afterwards by the user.
Scan region: Cortical bone
Cortical bone is typically assessed at the tibial or femoral midshaft (Figure 3).
Femur midshaft
The scan volume of the femoral midshaft is centred on the midpoint of the long bone. This can be determined as half the distance from the distal condyle to the proximal point of the femoral head.6 The scan region ranges between 0.1 and0.7 mm for both mice and rats.2,11,14,15,16 If using a percentage of the long bone length, 10–15% of the total length is common.6,17 In this case, it is recommended to scan a larger region than needed and to calculate a subregion in the analysis phase. The scan should still be centred at the midshaft of the long bone, and the operator should take note of the total length of the long bone.
Tibial midshaft
For the analysis of tibial cortical bone, the reference line can be chosen at the midpoint of the long bone in a similar manner to the femur but by using the proximal and distal condyles as reference points.2 Alternatively, the scan can begin at the tibia–fibula junction or at a specified distance (that is, 0.3 mm) away from this point.17 Again, if using a percentage of total length, 10% is common.
Entire skeleton of mouse neonates
Whole skeletons of newborn mice are assessed as close to birth as possible. This is typically 2–3 days old after collection and fixation (Figure 4).
Reconstruction
The 3D image stacks are reconstructed from the rotation image projections, using the reconstruction software (Bruker (Kontich, Belgium) provides the NRecon software, ScancoMedical (Brüttisellen, Switzerland) provides the IPL software) that can run on graphics cards using large-scale parallel processing and multiple computers in a cluster to aid a faster reconstructing process. The NRecon software allows the adjustment of three reconstruction parameters: smoothing, beam-hardening factor correction, and ring artefact reduction (Table 1). Optimal settings for each parameter may vary from scanner to scanner, but suggested settings for scanning mouse bones are shown in Table 1. In particular, the settings for beam hardening should be determined empirically.
Table 1. Reconstruction parameters by the NRecon software.
| Parameter | Description | Suggested setting |
|---|---|---|
| Smoothing | Smoothes images and removes noise | Width; 1 pixel (however, it may interfere with fine details – in that case do not activate smoothing) |
| Beam-hardening factor correction | Corrects for the absorption of lower-energy X-ray on the outside of the specimen | 10–25% (optimal setting should be determined empirically) |
| Ring artefact reduction | Corrects for the nonlinear behaviour of pixels causing ring artefacts | ∼10 |
NRecon software also allows the selection of the area to be reconstructed. Areas that are of no interest should not be reconstructed, as this will increase the size of the data set. On the other hand, a slightly larger area than that required should be reconstructed to ensure that critical data are retained. The reconstruction occurs automatically in the ScancoMedical system. It is possible to reconstruct images at a user-defined angle; however, this procedure should be used with caution, as it can decrease the accuracy of the mineral measurement.
Analysis
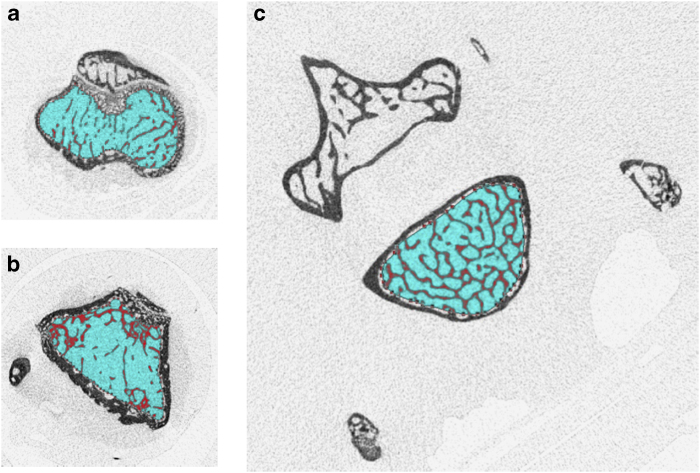
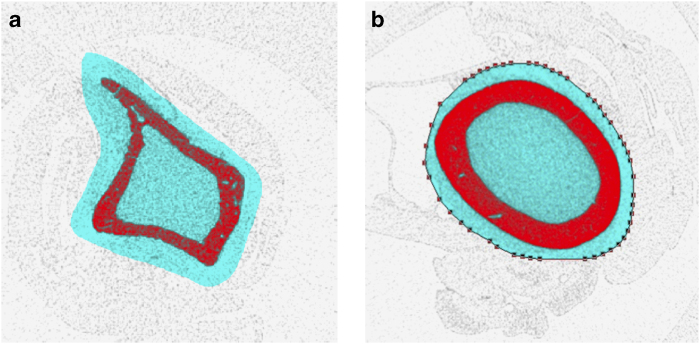
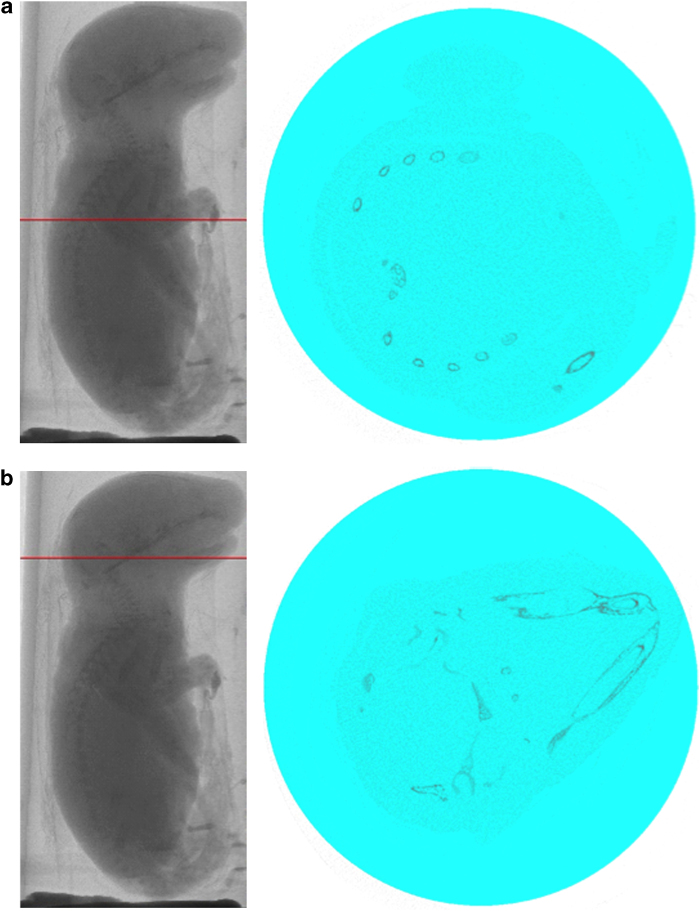
After reconstruction, the images can be analysed to obtain quantitative information on the bone structure (Bruker provides the CTAn software, ScancoMedical the IPL software). During this process, regions must be chosen in a consistent manner, as mass and structure can vary along the length of the bone. Landmarks that are easy to find in all scanned specimens should be identified as starting points. The area to be analysed from the reconstructed images for trabecular and cortical bone is specified by the region of interest (ROI), which is typically selected adjacent to the endocortical surface for trabecular bone (Figure 5) or includes the entire bone for cortical bone (Figure 6). ROI selection is achieved using a free-hand drawing tool, and auto-interpolation between the different ROI levels produces the total volume of interest (VOI) for all frames selected. ScancoMedical provides an automated segmentation analysis that can be used to separate the trabecular and cortical bone compartments.18 For the analysis of mouse neonates, the VOI is stretched along the entire reconstructed skeleton images using a regular circle as ROI (Figure 7).
Figure 5.
Region of interest for trabecular bone analysis in tibial metaphysis (a), femoral metaphysis (b) and fifth lumbar (L5) vertebra of the spine (c).
Figure 6.
Region of interest for cortical bone analysis in tibial (a) and femoral (b) midshaft.
Figure 7.
Region of interest for the skeletal analysis of the entire 2-day-old mouse neonate specified by a regular circle. (a) A single frame showing spine and ribs. (b) A single frame showing the skull.
The following sections describe typical VOI sizes and locations used to analyse the trabecular and cortical bone of the tibia, femur and vertebra. It should be noted, however, that there is not one specific VOI location and size used consistently in the literature. It is therefore important to keep the following points in mind when conducting the analysis of the scans. First, consistent VOIs must be chosen for each animal or sample and time point. This allows comparisons between groups and time points to be analysed with confidence. Second, comparison of study results with literature values should be only made to studies using similar VOIs (or the difference of VOIs should be noted in the paper).
Trabecular bone
Proximal tibia and distal femur
The entire scanned region of the proximal tibia and distal femur can be analysed if the complete volume is located away from the growth plate, as is normally the case in rat bone. For mouse bones, where the scan may begin at the growth plate to maximise trabecular volume, a subregion can be chosen for analysis to ensure that the bone at the growth plate is not included. For example, the most distal slice of the growth plate can be identified and the analysis can be set to begin 20 slices away from this point.2 Contours are drawn manually in each slice to separate the trabecular bone from the cortical wall, or an automated segmentation procedure can be applied.18
Vertebra
The majority of studies on the vertebra examine the entire vertebral body.11,14,15,19,20 Alternatively, some researchers have specified a volume (for example, 2 mm) centred at the midline,8 or they have used the growth plate as a landmark.7,21,22 As the mid-region is sparsely populated with trabecular bone, and the bone volume density is inhomogeneously distributed throughout the vertebral body, it is recommended to analyse the entire volume unless the study question gives cause to focus on a specific subvolume.
Femoral neck
The analysis of the femoral neck provides more of a challenge than other sites, as the longitudinal axis does not normally align with the scan axis. This can be circumvented by performing a principal axis alignment on a subimage containing the femoral neck on the reconstructed image. This site can be studied either in its entirety,17,23 or in a subregion (for example 0.15 mm) centred at the narrowest point.6,24
Cortical bone
If the procedures discussed in section ‘Scan region' for midshaft scanning are followed for obtaining a consistent scan size for each animal and time point, the entire region can be analysed. However, if a percentage of the total length is to be analysed, this is best done by creating a subvolume on the reconstructed image. The middle slice in the image can be found, and the total number of slices above and below this point can be calculated for inclusion in the subvolume. It should be noted that if 3D methods are being used for calculating the cortical thickness (that is, largest sphere method),25 the axial dimension must be larger than the maximum possible cortical thickness. If this is not the case, the thickness detected by the method will be limited to the axial dimension. If the cortical thickness is to be measured on a volume with an axial dimension that is less than the cortical thickness, two-dimensional (2D) methods must be used for the calculation.
Choice of VOI size and location
To define reproducible VOIs for analysis, landmarks such as the growth plate, midpoint or tibia–fibula junction are chosen as reference points. The choice of VOI size depends on the skeletal site, but the inhomogeneous distribution of the bone structure along the length should be considered. In particular, at the proximal and distal ends of the long bone and vertebra, the amount of trabecular bone volume decreases as one moves away from the growth plate. Therefore, larger VOIs will result in smaller values for parameters, such as bone volume. When deciding whether to choose a fixed VOI size or a percentage of the bone size, this can depend on the disease model. If adult animals with no expected change in bone length are used, applying a fixed VOI may be sufficient. If groups are expected to have conditions that affect bone size, a percentage of the total bone length should be used. For growing animals, a percentage should also be used unless it is known that all of the animals will grow at the same rate.
Entire skeleton of a mouse neonate
Reconstructed images from the entire mouse neonates are used for analysis.
Settings of analysis parameters
For the analysis of bone structure, the micro-CT images are binarised by setting a grey-level threshold, above which voxels are considered bone and below which voxels are considered background (Figure 8). Before thresholding, images can be filtered using a Gaussian filter to remove noise. Bruker's CTAn software allows the adjustment of analysing parameters such as filter, threshold and despeckle for trabecular bone, and additional morphological operations for closing the pores of the cortex for cortical bone analysis. In ScancoMedical's IPL software, sigma and support values are chosen for the Gaussian filter (Table 2). A global threshold can be chosen from the histogram data of the greyscale image. The ideal threshold is the midpoint between the background and bone peaks in the histogram when selecting the threshold visually. However, the choice of threshold can vary from user to user, and it can result in differences that are larger than the experimental differences themselves.26 Therefore, global thresholds should be chosen by one user and kept the same for the entire study when large changes in tissue mineralisation are not expected to occur. In cases in which changes in mineralisation do occur, automatic threshold methods can be applied. For example, automated techniques have been developed that detect the peaks from local histograms,27 or that use region growing algorithms to select the threshold level.28 These methods of thresholding may be more appropriate in studies of bone mineralisation, or when bone volume is particularily small (<15%).29
Figure 8.

Greyscale (left) and binarised (middle) slices from a micro-CT image of the distal rat femur. The binarised images are stacked to form a 3D volume (right) for structural analysis.
Table 2. Micro-CT analysis parameters.
| Parameter | Description | Suggested setting |
|---|---|---|
| Filter | Removes noise | Bruker: Median filter: 2D space, radius 1–2Scanco: Gaussian filter: sigma 0.8–1.2 support 1–2 (∼2 × sigma value) |
| Threshold | Segments the foreground from background to binary images | Global; low level 100, high level 255 |
| Despeckle/component labelling | Removes speckles from binary images | Image; remove speckles <150 voxels |
| Morphological operations | Fills the holes and closes the pores of the cortex | Closing; 2D space, Kernel round, radius 3 |
Output parameters
The output parameters for the quantification of bone structure can be calculated using the built-in 3D analysis software. These typically include trabecular bone volume, trabecular thickness, trabecular separation, trabecular number and the structure model index (Bruker and ScancoMedical), trabecular pattern factor (Bruker), and connectivity density (ScancoMedical) (Table 3). For cortical bone analysis, cortical bone volume and thickness are the most common parameters calculated. Additional output parameters, such as total cross-sectional area inside the periosteal envelope, medullary area, periosteal and endosteal perimeter, pore number and density can be calculated using a 2D analysis operator (Table 4). The details of these parameters have been described in detail elsewhere.3,25,30,31,32
Table 3. Output parameters for the trabecular bone.
| Parameter | Abbreviation (unit) |
|---|---|
| Trabecular bone volume | BV/TV (%) |
| Trabecular thickness | Tb.Th (mm) |
| Trabecular separation | Tb.Sp (mm) |
| Trabecular number | Tb.N (1/mm−1) |
| Trabecular pattern factor | Tb.Pf (mm−1) |
| Connectivity density | Conn.D (mm−3) |
| Structure Model Index | SMI |
Table 4. Output parameters for the cortical bone.
| Parameter | Abbreviation (unit) |
|---|---|
| Cortical bone volume | Ct.BV (mm3) |
| Cortical thickness | Ct.Th (mm) |
| Total cross-sectional area inside the periosteal envelope | Tt.Ar (mm2) |
| Medullary area | Ma.Ar (mm2) |
| Periosteal perimeter | Ps.Pm (mm) |
| Endosteal perimeter | Ec.Pm (mm) |
| Pore number | Po.N (n) |
| Pore density | Po.Dn (per mm3) |
3D visualisation
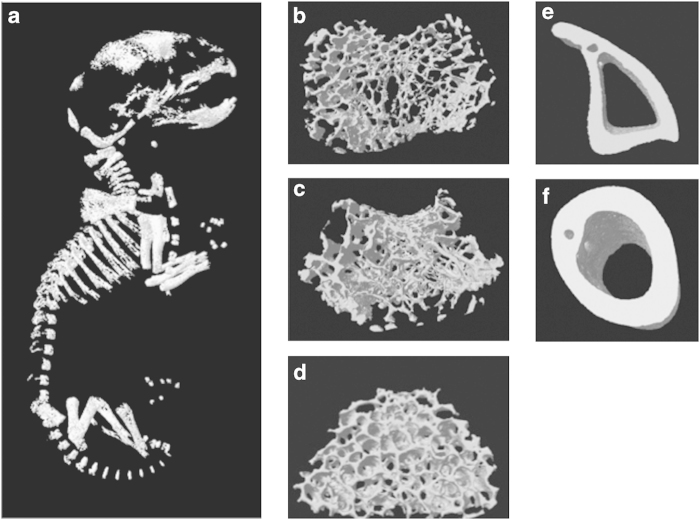
3D models of trabecular bone, cortical bone or whole mouse neonates are visualised using a 3D visualisation software (Bruker provides the CTvol software, ScancoMedical provides the μCT Ray software). These create 3D surfaces from binary images (Figure 9).
Figure 9.
3D images of 2-day-old mouse neonate (a), tibial trabecular bone (b), femoral trabecular bone (c), vertebral trabecular bone (d), tibial cortical bone (e) and femoral cortical bone (f).
In vivo studies
By scanning the same animal repeatedly, in vivo scanning improves precision of temporal measurements and allows local changes in bone structure to be calculated.13 However, live animal scanning requires some adjustments to the scanning procedure and may have limitations in terms of achievable field of view, scan time and effects of radiation. These aspects are discussed in the following sections.
Animal placement
A variety of sample holders exist for in vivo scanning of rodents. The most common of these are full body and tibia holders. The full body holders allow any skeletal site to be scanned (for example the spine or hip, which are comparable to fracture-relevant sites in humans), whereas tibia holders are designed such that the proximal tibial region down to the midshaft can be scanned. Although restricted to a small region, tibia holders have the advantage that smaller fields of view can be used, resulting in higher-resolution scans, and that the limbs are more easily aligned. Regardless of the holder used, the animal must be fixed in a stationary position in order to minimise motion artefacts in the images. For tibia holders, this is generally not a problem; however, some foam material can be placed alongside the limb within the tube in order to ensure that the limb is fixed. It should be ensured that the animal is completely unconscious before scanning and remains so for the entire duration of the scan. The following section explains anaesthesia in more detail.
Anaesthesia
Anaesthesia can be administered via inhalation or injection. Gas anaesthesia, for example, isoflurane gas, is preferred to injectable anaesthetics, as it is less toxic to the metabolism of the animal and lasts for as long as it is administered. If using injectable anaesthetics, for example, I.P. with ketamine hydrochloride and medetomidine hydrochloride cocktail followed by atipamezole hydrochloride for reversing anaesthesia, it should not be administered more than once per day. As mentioned in the previous section, motion artefacts can arise if the animal does not remain unconscious during the entire scan. With injection anaesthetic, this is generally easier to ensure, as the animal continues to breathe the gas for the scan duration. Rodents may develop a resistance to the anaesthetic over an in vivo study, and thus the concentration of anaesthetic given may need to be increased in the later scans. For injection anaesthesia, the operator should ensure that the scan does not last longer than the duration of the anaesthetic effect.
Radiation dose effects
Exposing individual mice repeatedly to ionising radiation may have a negative impact on the health of the animal and may interfere with the physiology of bone metabolism. On the other hand, increasing the radiation dose will decrease the coefficient of variation in the measured X-ray attenuation, thereby improving the precision of micro-CT measurements.33 Increased precision can also be achieved using larger voxel sizes, which reduces the ability to quantify the bone structure. Researchers must therefore find a balance between image quality and radiation effects in the design of their experiments. Absorbed radiation dose is given in units of gray (Gy), which is the absorbed energy in joules divided by the mass in kilograms. The equivalent dose is a radiation-weighted calculation that takes into consideration the type of radiation in the calculation of risk to the patient. This is given in Sieverts (Sv), and for X-rays, 1 Sv is equivalent to 1 Gy. The maximum amount of radiation that can be given in live-animal scans is referred to as the lethal dose, or LD50/30, which is the whole-body radiation dose killing 50% of the exposed population within 30 days of exposure.33 This is between 5 and 7 Gy in mice and approximately 8 Gy in rats.34 Radiation becomes an issue for in vivo scanning where repeated scans are made on the animal, as it has been shown that the population survival time decreases linearly with increasing whole-body dose.34 Recovery from sublethal doses is possible; however, continued exposure can impede this process.35 Some study on the specific effects of radiation on rodent bone from repeated micro-CT scans has been conducted. To date, radiation has been observed to have no effect on the bone structure in rats after 5–8 weekly scans at the proximal tibia, when doses up to 939 mGy are administered.36,37 In adult mice, however, four weekly scans at 860 mGy were shown to result in losses of 10–20% BV/TV.37 In another study, the effect of three 776 mGy scans, separated by 2 weeks, resulted in a 30% decrease in BV/TV in 10-week-old mice.38 The same study showed that when the dose was decreased to 434 mGy no radiation effects were observed in young (4-week-old) or mature (16-week-old) mice. Klinck et al.37 showed that the effect of the disease studied (that is, ovariectomy) is higher than that of the radiation dose (loss of 40–50% BV/TV due to OVX vs 10–20% loss due to radiation), indicating that inter-group comparison can still despite the loss due to radiation. Although these studies report the effect of radiation on the remodelling process, the effects on modelling may be more severe. A study of fracture healing in rats has reported that after a single dose of 900 rad (9 Gy) a delay of 4 weeks in the healing process occurs.39 Although these studies provide useful information on the limitations of micro-CT in terms of radiation exposure, more research needs to be conducted to determine the effect of radiation on longer study protocols, other skeletal sites and on bone modelling at the growth plate. In particular, growing animals and those used in studies of tumour growth may be more sensitive to the effects of radiation and should be studied further. Increased voxel size and reduced rotation step, frame averaging and integration time all reduce radiation exposure. It is recommended that investigators report the radiation dose rate in mGy in their manuscripts.
Image registration
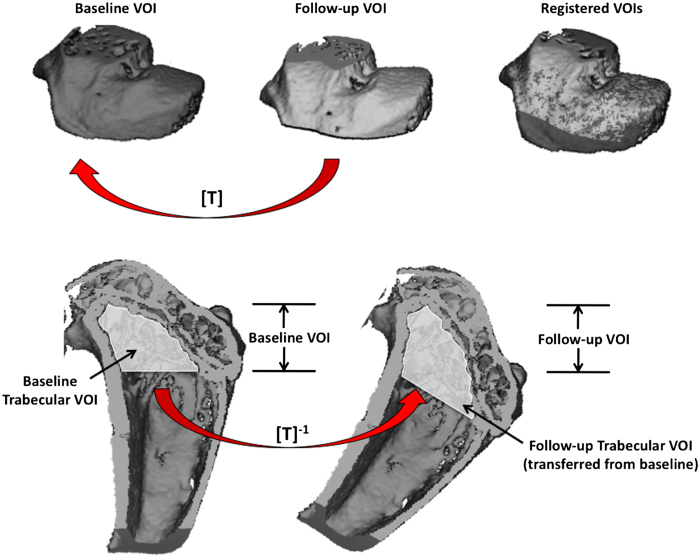
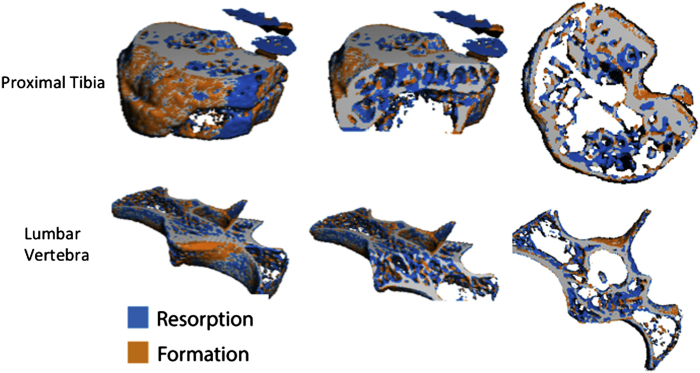
To achieve high long-term precision within in vivo data sets, care must be taken to repeatedly scan and analyse the same region at baseline and for each follow-up scan. User error in the chosen region or changes in limb alignment can introduce precision errors in the longitudinal data. To improve precision in repeated micro-CT measurements, image registration can be used. Image registration is a procedure in which follow-up images are overlaid onto the baseline (Figure 10) and can be applied in 2D or 3D space. 2D image registration may be sufficient when limbs are well aligned in the axial direction; however, this is often not the case (in particular for full-body holders), and 3D image registration procedures are recommended. The method generates a transformation matrix that contains the rotations about and the translations along the x, y and z axes that allow the follow-up image to be transformed onto the baseline. By inverting the transformation matrix and by applying it to the user- or automatically defined VOI of the baseline scan, the VOI is transferred to the follow-up image. This ensures that the same region is analysed at each time point, and it has been shown to improve the precision of repeated micro-CT measurements.5,40,41,42 In addition, image registration can be used to track changes in the structure of individual trabecular elements43 and quantify local changes in bone resorption and formation in vivo.44 Figure 11 shows examples of localised bone resorption and formation in the proximal tibia and vertebra of a mouse over the course of 14 days after ovariectomy to induce bone loss. Registration methods are available in the IPL software provided by ScancoMedical, but some knowledge of the programming language is necessary. Example scripts for application in IPL have been made available that can be adapted to a specific in vivo study.41 Alternatively, commercial software such as Amira (Visualization Sciences Group, Berlin, Germany) and open-source software such as ImageJ (US National Institutes of Health, Bethesda, MD, USA, http://rsbweb.nih.gov/ij/download.html), Osirix (The Osirix Foundation, Geneva, Switzerland, http://www.osirix-viewer.com) and the image toolkit (ITK, Kitware Inc., New York, NY, USA) can be used to perform image registration.
Figure 10.
Procedure to transfer baseline scans onto follow-up. The VOI including cortical and trabecular bone of the follow-up image is registered to baseline to generate the transformation matrix [T] (top). The transformation matrix is then inverted and used to apply the baseline VOI of a specific region (that is, trabecular bone) to the follow-up scan for analysis (bottom).
Figure 11.
Subtraction images obtained by image registration of micro-CT images at the proximal tibia and lumbar vertebra in a mouse at baseline and 14 days postovariectomy. Localised bone formation (orange) and resorption (blue) can be observed. This technique can be used to determine the amount and rate of bone formation and resorption in vivo over a given time period.
Additional sites for measurement
The main focus of this paper is to provide a protocol for bone structural analysis at the most common skeletal sites with micro-CT. However, we also provide here a short review of current techniques to image other bone sites, as well as nonbone tissues with micro-CT. These include the measurement of the skull, mandible and teeth, adipose tissue, vasculature, tumour tissue and cartilage.
Skull, mandible and teeth
The femur, tibia and vertebra are commonly studied sites for osteoporosis and bone fragility models; however, other bone sites such as the skull, mandible and teeth can be imaged with high contrast as well. Teeth give exceptionally good contrast in micro-CT images, as the enamel is the hardest tissue in the body. Rodent models are ideal for the study of tooth development, as their teeth continuously progress through all stages of development. Micro-CT can be used to assess the level of mineralisation45,46 and bone destruction47 using similar scanning parameters as that of standard bone sites. Furthermore, images of the entire skull can be studied to assess craniofacial shape and abnormal growth.48,49
Adipose tissue
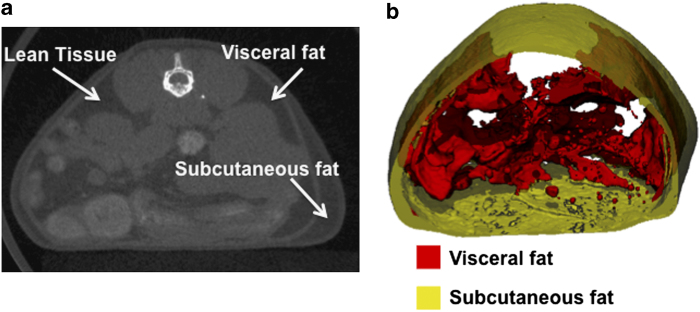
Imaging of adipose tissue can be carried out by exploiting the contrast differences between fat and muscle from the micro-CT image. As the differences in attenuation properties of these two tissue types are not as large compared with bone, a lower voltage is required to maintain contrast (approximately 45 kV). The advantage of micro-CT scanning to determine adipose tissue is that the size and number of adipose depots can be determined with a large degree of accuracy,50 assisting in the study of conditions, such as obesity and diabetes. Fat tissue does not have a thin and complex structure as does bone, and therefore a larger voxel size can be used (80 μm has been found to be sufficient to distinguish between adipose tissue and the muscle of the abdominal wall51). Recently, a method has been developed to separate subcutaneous and visceral fat using micro-CT.51 This has important clinical implications, as visceral fat is associated more closely with heart disease and other obesity-related complications. The algorithm developed by Judex et al.51 is freely available at http://bme.sunysb.edu/labs/sjudex/miscellaneous.html. An example of the separation of subcutaneous and visceral fat using this method is shown in Figure 12.
Figure 12.
Segmentation of visceral and subcutaneous adipose tissue in a mouse. Regions of lean, visceral fat and subcutaneous fat tissue are shown in a tomographic slice (a), and the corresponding visualisation of the segmentation is shown (b) with the inner visceral fat depicted in red and the outer subcutaneous fat depicted in semitransparent yellow.
Vasculature
Owing to the low radio-opacity, the study of vasculature with micro-CT typically requires a contrast agent to be injected. This enables the vasculature to be visualised and quantified.3,52 With the use of contrast agents, the volume, thickness and connectivity can be calculated using similar techniques as those used for the assessment of bone microstructure.53 This technique has been applied to model vasculature in the hindlimb,54 brain,55 lungs56 and heart.57 The imaging of vasculature with micro-CT can also be used to study tumour severity, as described in the following section.
Tumour tissue
As with vasculature, tumour tissue is not easily visualised with micro-CT. Thus, techniques using contrast agents, or examination of abnormal spacing within the bone tissue (in the case of osteolytic lesions), can be applied to study tumour severity. Assessment of the differences in vessel volume, number and thickness allows for the distinction of tumour vasculature from that of healthy tissue.58,59 In addition, studies have shown that osteolytic lesions result in increases in trabecular spacing and decreases in BMD and trabecular number owing to the destruction of the bone tissue.60,61,62,63 It has recently been shown that micro-CT is superior to radiography in detecting osteolytic lesions.64 A current issue with assessing tumour severity in osteolytic lesions is that they may occur in parallel with normal bone growth. This may mask the bone loss detected from the lesion as the overall change in bone mass includes the bone growth as well. Image registration techniques can aid in the ability to locate and assess osteolytic bone loss, as this allows these regions to be observed through subtraction images.65 An example of a subtraction image showing regions of normal bone growth and localised bone loss due to an osteolytic lesion is shown in Figure 13.
Figure 13.

Time-lapsed micro-CT image of the development of an osteolytic lesion in the distal femur of a mouse. Baseline (a) and follow-up (b) micro-CT image show the change in bone structure over time. The fusion image (c) obtained after image registration depicts the natural bone growth in orange alongside the osteolytic bone loss in blue.
Cartilage
Contrast agents can also be used to image the cartilage using micro-CT. The advantage of micro-CT in this setting is that both the cartilage and subcondral bone can be assessed within the same image. Cartilage imaging using contrast agents and micro-CT gives accurate measurements of cartilage thickness,66 and it has been used to track cartilage degradation in vivo in a model of osteoarthritis in rats.67
Discussion
This protocol provides information on the common procedures currently used in micro-CT studies of bone microstructure. Owing to the critical role it has in bone strength,68 accurate assessment of the microstructure can provide valuable information about disease progression and treatment efficacy in preclinical research. With the average trabecular thickness in rodents on the order of 50–100 μm, images with voxel sizes of approximately 10–20 μm in three dimensions are required for reliable quantification.69 This level of resolution is achievable with micro-CT, thus providing highly accurate, nondestructive and orientation-independent measures of the bone microstructure. Despite the achievable resolution, some trabecular structures in rodents can be thinner than these average values, and there will be a certain percentage of elements that are not accurately represented regardless of the voxel size used. It is therefore not possible to compare scans with different voxel sizes, unless the goal is to validate a specific technique to a gold standard. In vivo micro-CT scanning allows for changes in these parameters to be tracked in the same animal over time, which increases the statistical power and reduces the number of animals required for an experiment. However, issues pertaining to anaesthesia, ionising radiation and limb misalignment that arise with in vivo micro-CT studies must be considered. Image registration is a powerful tool that can be used to increase long-term precision and calculate local bone turnover in in vivo studies, and can be used to solve some of the problems associated with in vivo scanning. Finally, there is a growing body of research using micro-CT to examine skeletal regions in the skull and mandible, as well as soft tissues. Some of these methods require contrast agents and apply similar analysis techniques as those used for analysis of the bone structure. When developing an experimental design for a micro-CT study, one must carefully consider the skeletal site and choose a region that enables appropriate comparisons to data in the literature. A balance must be found between image quality and administered radiation dose, with the realisation that large doses may affect the parameters measured in the study.
Recommended further reading
Frequently Asked Questions for ScancoMedical customers are available at http://www.scanco.ch/en/support/customer-login/faq-customers.html. Customers are provided with the login information by the company. This section addresses the majority of user issues, and it provides educational information. Example images and videos are available on the ScancoMedical website at http://www.scanco.ch/en/docs/images.html. Information on the products and applications of the Bruker (formerly SkyScan) systems are available on the company website: www.skyscan.be
The following sources document the methods and standard protocols for the analysis of bone structure with micro-CT in further detail.
Bouxsein ML, Boyd SK, Christiansen BA, Guldberg RE, Jepsen KJ, & Müller R. Guidelines for assessment of bone microstructure in rodents using micro-computed tomography. J Bone and Miner Res, 2010;25:1468–1486.
Helfrich MH, Ralston SH (eds.), Bone Research Protocols, Methods in Molecular Biology, vol. 816, Springer Science+Business Media, LLC 2012, Chapter 27.
Stauber M, Müller R. Micro-computed tomography: a method for the non-destructive evaluation of the three-dimensional structure of biological specimens. Meth Mol Biol, 2008;455:273–292.
Bruker. Automated trabecular and cortical bone selection (Method note). See Supplementary File S1.
Bruker. Bone mineral density (BMD) and tissue mineral trabecular density (TMD) calibration and measurement by micro-CT using Brucker-MicroCT CT-analyser. See Supplementary File S2.
Bruker. MN026 Rodent hind-limb positioning for in-vivo microCT bone imaging. See Supplementary File S3.
Bruker. Quantifying adipose tissue (fat) in a mouse or rat by in-vivo microCT (Method note). See Supplementary File S4.
Supplementary Material
Acknowledgments
Supported by the IBMS-ECTS Young Investigators.
References
- Turner CH, Burr DB. Basic biomechanical measurements of bone: a tutorial. Bone 1993;14:595–608. [DOI] [PubMed] [Google Scholar]
- van 't Hof RJ. Analysis of bone architecture in rodents using microcomputed tomography. Methods Mol Biol 2012;816:461–476. [DOI] [PubMed] [Google Scholar]
- Bouxsein ML, Boyd SK, Christiansen BA, Guldberg RE, Jepsen KJ, Müller R. Guidelines for assessment of bone microstructure in rodents using micro-computed tomography. J Bone Miner Res 2010;25:1468–1486. [DOI] [PubMed] [Google Scholar]
- Stauber M, Müller R. Micro-computed tomography: a method for the non-destructive evaluation of the three-dimensional structure of biological specimens. Methods Mol Biol 2008;455:273–292. [DOI] [PubMed] [Google Scholar]
- Brouwers JEM, Rietbergen B, Huiskes R, Ito K. Effects of PTH treatment on tibial bone of ovariectomized rats assessed by in vivo micro-CT. Osteoporos Int 2009;20:1823–1835. [DOI] [PMC free article] [PubMed] [Google Scholar]
- Hamann C, Rauner M, Höhna Y, Bernhardt R, Mettelsiefen J, Goettsch C et al. Sclerostin antibody treatment improves bone mass, bone strength, and bone defect regeneration in rats with type 2 diabetes mellitus. J Bone Miner Res 2013;28:627–638. [DOI] [PubMed] [Google Scholar]
- Lelovas PP, Xanthos TT, Thoma SE, Lyritis GP, Dontas IA. The laboratory rat as an animal model for osteoporosis research. Comp Med 2008;58:424. [PMC free article] [PubMed] [Google Scholar]
- Liu XL, Li CL, Lu WW, Cai WX. Skeletal site-specific response to ovariectomy in a rat model: change in bone density and microarchitecture. Clin Oral Implants Res (e-pub ahead of print 5 March 2014; 10.1111/clr.12360). [DOI] [PubMed] [Google Scholar]
- Campbell GM, Buie HR, Boyd SK. Signs of irreversible architectural changes occur early in the development of experimental osteoporosis as assessed by in vivo micro-CT. Osteoporos Int 2008;19:1409–1419. [DOI] [PubMed] [Google Scholar]
- Klinck J, Boyd SK. The magnitude and rate of bone loss in ovariectomized mice differs among inbred strains as determined by longitudinal in vivo micro-computed tomography. Calcif Tissue Int 2008;83:70–79. [DOI] [PubMed] [Google Scholar]
- Marenzana M, Greenslade K, Eddleston A, Okoye R, Marshall D, Moore A et al. Sclerostin antibody treatment enhances bone strength but does not prevent growth retardation in young mice treated with dexamethasone. Arthritis Rheum 2011;63:2385–2395. [DOI] [PubMed] [Google Scholar]
- Dumas A, Brigitte M, Moreau MF, Chrétien F, Baslé MF, Chappard D. Bone mass and microarchitecture of irradiated and bone marrow-transplanted mice: influences of the donor strain. Osteoporos Int 2009;20:435–443. [DOI] [PubMed] [Google Scholar]
- Boyd SK, Davison P, Müller R, Gasser JA. Monitoring individual morphological changes over time in ovariectomized rats by in vivo micro-computed tomography. Bone 2006;39:854–862. [DOI] [PubMed] [Google Scholar]
- Bagi CM, Hanson N, Andresen C, Pero R, Lariviere R, Turner CH et al. The use of micro-CT to evaluate cortical bone geometry and strength in nude rats: correlation with mechanical testing, pQCT and DXA. Bone 2006;38:136–144. [DOI] [PubMed] [Google Scholar]
- Hamann C, Picke A-K, Campbell GM, Balyura M, Rauner M, Bernhardt R et al. Effects of parathyroid hormone on bone mass, bone strength, and bone regeneration in male rats with type 2 diabetes mellitus. Endocrinology 2014;155:1197–1206. [DOI] [PubMed] [Google Scholar]
- Sophocleous A, Idris AI, Ralston SH. Genetic background modifies the effects of type 2 cannabinoid receptor deficiency on bone mass and bone turnover. Calcif Tissue Int 2013;94:259–268. [DOI] [PubMed] [Google Scholar]
- Goulet GC, Halonen NR, Koch LG, Britton SL, Zernicke RF, Kozloff KM. Osteoblast response to ovariectomy is enhanced in intrinsically high aerobic-capacity rats. Calcif Tissue Int 2011;88:325–335. [DOI] [PMC free article] [PubMed] [Google Scholar]
- Buie HR, Campbell GM, Klinck RJ, MacNeil JA, Boyd SK. Automatic segmentation of cortical and trabecular compartments based on a dual threshold technique for in vivo micro-CT bone analysis. Bone 2007;41:505–515. [DOI] [PubMed] [Google Scholar]
- Chen X-X, Baum W, Dwyer D, Stock M, Schwabe K, Ke HZ et al. Sclerostin inhibition reverses systemic, periarticular and local bone loss in arthritis. Ann Rheum Dis 2013;72:1732–1736. [DOI] [PMC free article] [PubMed] [Google Scholar]
- Martin-Millan M, Almeida M, Ambrogini E, Han L, Zhao H, Weinstein RS et al. The estrogen receptor-alpha in osteoclasts mediates the protective effects of estrogens on cancellous but not cortical bone. Mol Endocrinol 2010;24:323–334. [DOI] [PMC free article] [PubMed] [Google Scholar]
- Windahl SH, Börjesson AE, Farman HH, Engdahl C, Movérare-Skrtic S, Sjögren K et al. Estrogen receptor-α in osteocytes is important for trabecular bone formation in male mice. PNAS 2013;110:2294–2299. [DOI] [PMC free article] [PubMed] [Google Scholar]
- Willey JS, Livingston EW, Robbins ME, Bourland JD, Tirado-Lee L, Smith-Sielicki H et al. Risedronate prevents early radiation-induced osteoporosis in mice at multiple skeletal locations. Bone 2010;46:101–111. [DOI] [PMC free article] [PubMed] [Google Scholar]
- Dubrow SA, Hruby PM, Akhter MP. Gender specific LRP5 influences on trabecular bone structure and strength. J Musculoskelet Neuronal Interact 2007;7:166–173. [PubMed] [Google Scholar]
- Middleton KM, Shubin CE, Moore DC, Carter PA, Garland T Jr, Swartz SM. The relative importance of genetics and phenotypic plasticity in dictating bone morphology and mechanics in aged mice: evidence from an artificial selection experiment. Zoology 2008;111:135–147. [DOI] [PMC free article] [PubMed] [Google Scholar]
- Hildebrand T, Rüegsegger P. A new method for the model-independent assessment of thickness in three-dimensional images. J Microsc 1997;185:67–75. [Google Scholar]
- Parkinson IH, Badiei A, Fazzalari NL. Variation in segmentation of bone from micro-CT imaging: implications for quantitative morphometric analysis. Australas Phys Eng Sci Med 2008;31:160–164. [DOI] [PubMed] [Google Scholar]
- Dufresne T. Segmentation techniques for analysis of bone by three-dimensional computed tomographic imaging. Technol Health Care 1998;6:351–359. [PubMed] [Google Scholar]
- Peter Z, Bousson V, Bergot C, Peyrin F. A constrained region growing approach based on watershed for the segmentation of low contrast structures in bone micro-CT images. Pattern Recognition 2008;41:2358–2368. [Google Scholar]
- Hara T, Tanck E, Homminga J, Huiskes R. The influence of microcomputed tomography threshold variations on the assessment of structural and mechanical trabecular bone properties. Bone 2002;31:107–109. [DOI] [PubMed] [Google Scholar]
- Hildebrand T, Ruegsegger P. Quantification of bone microarchitecture with the structure model index. Comput Methods Biomech Biomed Engin 1997;1:15–23. [DOI] [PubMed] [Google Scholar]
- Odgaard A. Three-dimensional methods for quantification of cancellous bone architecture. Bone 1997;20:315–328. [DOI] [PubMed] [Google Scholar]
- Odgaard A, Gundersen HJ. Quantification of connectivity in cancellous bone, with special emphasis on 3-D reconstructions. Bone 1993;14:173–182. [DOI] [PubMed] [Google Scholar]
- Ford NL, Thornton MM, Holdsworth DW. Fundamental image quality limits for microcomputed tomography in small animals. Med Phys 2003;30:2869. [DOI] [PubMed] [Google Scholar]
- Bond VP, Robertson JS. Vertebrate radiobiology (lethal actions and associated effects). Annu Rev Nucl Sci 1957;7:135–162. [DOI] [PubMed] [Google Scholar]
- Mole RH. Quantitative observations on recovery from whole body irradiation in mice. Part II. Br J Radiol 1957;30:40–46. [DOI] [PubMed] [Google Scholar]
- Brouwers JEM, van Rietbergen B, Huiskes R. No effects of in vivo micro-CT radiation on structural parameters and bone marrow cells in proximal tibia of wistar rats detected after eight weekly scans. J Orthop Res 2007;25:1325–1332. [DOI] [PubMed] [Google Scholar]
- Klinck RJ, Campbell GM, Boyd SK. Radiation effects on bone architecture in mice and rats resulting from in vivo micro-computed tomography scanning. Med Eng Phys 2008;30:888–895. [DOI] [PubMed] [Google Scholar]
- Laperre K, Depypere M, van Gastel N, Torrekens S, Moermans K, Bogaerts R et al. Development of micro-CT protocols for in vivo follow-up of mouse bone architecture without major radiation side effects. Bone 2011;49:613–622. [DOI] [PubMed] [Google Scholar]
- Markbreiter LA, Pelker RR, Friedlaender GE, Peschel R, Panjabi MM. The effect of radiation on the fracture repair process. A biomechanical evaluation of a closed fracture in a rat model. J Orthop Res 1989;7:178–183. [DOI] [PubMed] [Google Scholar]
- Nishiyama KK, Campbell GM, Klinck RJ, Boyd SK. Reproducibility of bone micro-architecture measurements in rodents by in vivo micro-computed tomography is maximized with three-dimensional image registration. Bone 2010;46:155–161. [DOI] [PubMed] [Google Scholar]
- Campbell GM, Tiwari S, Grundmann F, Purcz N, Schem C, Glüer CC. Three-dimensional image registration improves the long-term precision of in vivo micro-computed tomographic measurements in anabolic and catabolic mouse models. Calcif Tissue Int 2013;94:282–292. [DOI] [PubMed] [Google Scholar]
- Lan S, Luo S, Huh BK, Chandra A, Altman AR, Qin L et al. 3D image registration is critical to ensure accurate detection of longitudinal changes in trabecular bone density, microstructure, and stiffness measurements in rat tibiae by in vivo microcomputed tomography (μCT). Bone 2013;56:83–90. [DOI] [PMC free article] [PubMed] [Google Scholar]
- Campbell GM, Ominsky MS, Boyd SK. Bone quality is partially recovered after the discontinuation of RANKL administration in rats by increased bone mass on existing trabeculae: an in vivo micro-CT study. Osteoporos Int 2010;22:931–942. [DOI] [PubMed] [Google Scholar]
- Schulte FA, Lambers FM, Kuhn G, Müller R. In vivo micro-computed tomography allows direct three-dimensional quantification of both bone formation and bone resorption parameters using time-lapsed imaging. Bone 2011;48:433–442. [DOI] [PubMed] [Google Scholar]
- Bartlett JD, Dobeck JM, Tye CE, Perez-Moreno M, Stokes N, Reynolds AB et al. Targeted p120-catenin ablation disrupts dental enamel development. PLoS ONE 2010;5:e12703. [DOI] [PMC free article] [PubMed] [Google Scholar]
- Boskey AL, Young MF, Kilts T, Verdelis K. Variation in mineral properties in normal and mutant bones and teeth. Cells Tissues Organs 2005;181:144–153. [DOI] [PubMed] [Google Scholar]
- Balto K, Müller R, Carrington DC, Dobeck J, Stashenko P. Quantification of periapical bone destruction in mice by micro-computed tomography. J Dent Res 2000;79:35–40. [DOI] [PubMed] [Google Scholar]
- Kristensen E, Parsons TE, Hallgrímsson B, Boyd SK. A novel 3-D image-based morphological method for phenotypic analysis. IEEE Trans Biomed Eng 2008;55:2826–2831. [DOI] [PubMed] [Google Scholar]
- Gonzalez PN, Kristensen E, Morck DW, Boyd S, Hallgrímsson B. Effects of growth hormone on the ontogenetic allometry of craniofacial bones. Evol Dev 2013;15:133–145. [DOI] [PMC free article] [PubMed] [Google Scholar]
- Garofalo RS, Orena SJ, Rafidi K, Torchia AJ, Stock JL, Hildebrandt AL et al. Severe diabetes, age-dependent loss of adipose tissue, and mild growth deficiency in mice lacking Akt2/PKBβ. J Clin Invest 2003;112:197–208. [DOI] [PMC free article] [PubMed] [Google Scholar]
- Judex S, Luu YK, Ozcivici E, Adler B, Lublinsky S, Rubin CT. Quantification of adiposity in small rodents using micro-CT. Methods 2010;50:14–19. [DOI] [PMC free article] [PubMed] [Google Scholar]
- Holdsworth DW, Thornton MM. Micro-CT in small animal and specimen imaging. Trends Biotechnol 2002;20:S34–S39. [Google Scholar]
- Duvall CL, Taylor WR, Weiss D, Guldberg RE. Quantitative microcomputed tomography analysis of. Am J Physiol Heart Circ Physiol 2004;287:H302–H310. [DOI] [PubMed] [Google Scholar]
- Duvall CL, Weiss D, Robinson ST, Alameddine FM, Guldberg RE, Taylor WR. The role of osteopontin in recovery from hind limb ischemia. Arterioscler Thromb Vasc Biol 2008;28:290–295. [DOI] [PubMed] [Google Scholar]
- Schambach SJ, Bag S, Schilling L, Groden C, Brockmann MA. Application of micro-CT in small animal imaging. Methods 2010;50:2–13. [DOI] [PubMed] [Google Scholar]
- Ritman EL. Micro-computed tomography of the lungs and pulmonary-vascular system. Proc Am Thorac Soc 2005;2:477–480. [DOI] [PMC free article] [PubMed] [Google Scholar]
- Lee J, Beighley P, Ritman E, Smith N. Automatic segmentation of 3D micro-CT coronary vascular images. Med Image Anal 2007;11:630–647. [DOI] [PubMed] [Google Scholar]
- Downey CM, Singla AK, Villemaire ML, Buie HR, Boyd SK, Jirik FR. Quantitative ex-vivo micro-computed tomographic imaging of blood vessels and necrotic regions within tumors. PLoS ONE 2012;7:e41685. [DOI] [PMC free article] [PubMed] [Google Scholar]
- Nyangoga H, Mercier P, Libouban H, Baslé MF, Chappard D. Three-dimensional characterization of the vascular bed in bone metastasis of the rat by microcomputed tomography (MicroCT). PLoS ONE 2011;6:e17336. [DOI] [PMC free article] [PubMed] [Google Scholar]
- Buie HR, Bosma NA, Downey CM, Jirik FR, Boyd SK. Micro-CT evaluation of bone defects: applications to osteolytic bone metastases, bone cysts, and fracture. Med Eng Phys 2013;35:1645–1650. [DOI] [PubMed] [Google Scholar]
- Bi X, Sterling JA, Merkel AR, Perrien DS, Nyman JS, Mahadevan-Jansen A. Prostate cancer metastases alter bone mineral and matrix composition independent of effects on bone architecture in mice—A quantitative study using microCT and Raman spectroscopy. Bone 2013;56:454–460. [DOI] [PMC free article] [PubMed] [Google Scholar]
- Arrington SA, Schoonmaker JE, Damron TA, Mann KA, Allen MJ. Temporal changes in bone mass and mechanical properties in a murine model of tumor osteolysis. Bone 2006;38:359–367. [DOI] [PubMed] [Google Scholar]
- Fritz V, Louis-Plence P, Apparailly F, Noël D, Voide R, Pillon A et al. Micro-CT combined with bioluminescence imaging: a dynamic approach to detect early tumor-bone interaction in a tumor osteolysis murine model. Bone 2007;40:1032–1040. [DOI] [PubMed] [Google Scholar]
- Tiwari S, Schem C, Lorenzen A-C, Kayser O, Wiese C, Graeff C et al. Application of ex vivo micro-computed tomography for assessment of in vivo fluorescence and plain radiographic imaging for monitoring bone metastases and osteolytic lesions. J Bone Miner Metab 2012;30:373–380. [DOI] [PubMed] [Google Scholar]
- Johnson LC, Johnson RW, Munoz SA, Mundy GR, Peterson TE, Sterling JA. Longitudinal live animal micro-CT allows for quantitative analysis of tumor-induced bone destruction. Bone 2011;48:141–151. [DOI] [PMC free article] [PubMed] [Google Scholar]
- Xie L, Lin ASP, Levenston ME, Guldberg RE. Quantitative assessment of articular cartilage morphology via EPIC-μCT. Osteoarthritis Cartilage 2009;17:313–320. [DOI] [PMC free article] [PubMed] [Google Scholar]
- Piscaer TM, Waarsing JH, Kops N, Pavljasevic P, Verhaar JAN, van Osch GJVM et al. In vivo imaging of cartilage degeneration using μCT-arthrography. Osteoarthritis Cartilage 2008;16:1011–1017. [DOI] [PubMed] [Google Scholar]
- Chavassieux P, Seeman E, Delmas PD. Insights into material and structural basis of bone fragility from diseases associated with fractures: how determinants of the biomechanical properties of bone are compromised by disease. Endocr Rev 2007;28:151–164. [DOI] [PubMed] [Google Scholar]
- Müller R, Koller B, Hildebrand T, Laib A, Gianolini S, Rüegsegger P. Resolution dependency of microstructural properties of cancellous bone based on three-dimensional mu-tomography. Technol Health Care 1996;4:113–119. [PubMed] [Google Scholar]
Associated Data
This section collects any data citations, data availability statements, or supplementary materials included in this article.


