

Abstract
Objective
Polymerase gamma (POLG) mutations are a common cause of mitochondrial disease and have also been linked to neurodegeneration and aging. We studied the molecular mechanisms underlying POLG-related neurodegeneration using postmortem tissue from a large number of patients.
Methods
Clinical information was available from all subjects. Formalin-fixed and frozen brain tissue from 15 patients and 23 controls was studied employing a combination of histopathology, immunohistochemistry, and molecular studies of microdissected neurons.
Results
The primary consequence of POLG mutation in neurons is mitochondrial DNA depletion. This was already present in infants with little evidence of neuronal loss or mitochondrial dysfunction. With longer disease duration, we found an additional, progressive accumulation of mitochondrial DNA deletions and point mutations accompanied by increasing numbers of complex I–deficient neurons. Progressive neurodegeneration primarily affected the cerebellar systems and dopaminergic cells of the substantia nigra. Superimposed on this chronic process were acute, focal cortical lesions that correlated with epileptogenic foci and that showed massive neuronal loss.
Interpretation
POLG mutations appear to compromise neuronal respiration via a combination of early and stable depletion and a progressive somatic mutagenesis of the mitochondrial genome. This leads to 2 distinct but overlapping biological processes: a chronic neurodegeneration reflected clinically by progressive ataxia and cognitive impairment, and an acute focal neuronal necrosis that appears to be related to the presence of epileptic seizures. Our findings offer an explanation of the acute-on-chronic clinical course of this common mitochondrial encephalopathy. ANN NEUROL 2014;76:66–81
Polymerase gamma (POLG) replicates and repairs mitochondrial DNA (mtDNA). Mutations in POLG, the gene encoding the catalytic subunit, are among the most common causes of mitochondrial disease1 and have been linked to ageing2 and neurodegeneration.3–6 POLG mutations cause a variety of clinical phenotypes, including devastating encephalopathy syndromes that affect both adults and children, and that range from infantile hepatocerebral disease (Alpers–Huttenlocher syndrome) to juvenile or adult onset disorders with progressive spinocerebellar ataxia and epilepsy, known as mitochondrial recessive ataxic syndrome or mitochondrial spinocerebellar ataxia and epilepsy (MSCAE).7–9
The molecular pathogenesis of POLG encephalopathy is not fully understood, and its study is limited by the lack of accurate models. Human tissue is of limited availability, cell culture commonly does not express the molecular defects seen in tissue, and no animal models exist that accurately reflect human POLG encephalopathy syndromes. It is known that POLG mutations affect the enzyme's ability to efficiently replicate and repair mtDNA,10,11 and patients with POLG disease do harbor mtDNA damage and signs of respiratory chain dysfunction in affected tissues.12–15 The nature of the mtDNA defect appears to differ depending on which tissue is studied,1,12,16 with the central nervous system (CNS) being least well understood due to the difficulties in obtaining human tissues to study.
The few human studies of neuronal mtDNA in POLG disease have shown inconsistent results. Multiple mtDNA deletions affecting between ∼20 and 50% of mtDNA molecules have been identified,12–15 but whether this level of mtDNA deletion alone is sufficient to cause respiratory dysfunction and neuronal death remains unclear.17 Both normal and mildly decreased (70–75% of control) mtDNA copy number have been found in brain homogenate,12,13,16,18 and 1 study in neurons from the dorsal root ganglia of a single patient15 has reported clear mtDNA depletion (∼50% of controls). Accumulation of mtDNA point mutations has been shown in skeletal muscle of patients with POLG disease using an ultradeep resequencing-by-synthesis (UDS) assay,19,20 whereas no increase in mtDNA point mutations was detected in another study in brain.12 This study used a strategy of polymerase chain reaction (PCR) and cloning that has limited sensitivity, however, and cannot exclude mutations present at low heteroplasmy levels.
POLG disease affecting the brain often manifests as an acute-on-chronic process.8,9 To understand this at the level of the neuron, we investigated the changes in respiratory chain proteins and mtDNA in extensive material comprising tissue from all major areas of the CNS from 15 patients aged 0.6 to years 53 years with encephalopathy syndromes caused by the most common POLG mutations (c.1399G>A, p.A467T or c.2243G>C, p.W748S). Our findings show that it is possible to construct a sequence of events linking early quantitative loss of mtDNA and subsequent accumulation of mtDNA damage to respiratory chain deficiency and neuronal injury.
Subjects and Methods
Patients and Controls
Postmortem CNS tissue from 15 patients with POLG encephalopathy and 23 controls was studied. Demographic data and the tissues and studies that were performed are summarized in the Supplementary Table.
The patients all had a progressive MSCAE with focal and secondary generalized seizures and suffered at least 1 strokelike episode with cortical strokelike lesions on magnetic resonance imaging (MRI). In 12 patients for whom electroencephalographic (EEG) data were available, the localization of the cortical lesions correlated with epileptiform activity. Three patients had infantile onset encephalopathy with severe epilepsy and strokelike episodes. The clinical and genetic features of all patients are summarized in Table 1 and have been described elsewhere in detail.8,9
TABLE 1.
Genetic and Clinical Features of the Patients with Polymerase Gamma Encephalopathy
| Patient | Mutation | Age at Onset, yr | Age at Death, yr | Epilepsy | SLE | Ataxia | Neuropathy | PEO | FFPE Tissue | Frozen Tissue |
|---|---|---|---|---|---|---|---|---|---|---|
| AT-1A | A467T/A467T | 15 | 44 | + | + | + | + | + | + | + |
| AT-1B | A467T/A467T | 8 | 47 | + | + | + | + | + | + | − |
| AT-2A | A467T/A467T | 16 | 53 | + | + | + | + | + | + | + |
| WS-1A | W748S/W748S | 6 | 41 | + | + | + | + | + | + | + |
| WS-2A | W748S/W748S | 15 | 24 | + | + | + | + | − | − | + |
| WS-3A | W748S/W748S | 17 | 43 | + | + | + | + | + | + | + |
| WS-8A | W748S/W748S | 12 | 28 | + | + | + | + | + | + | − |
| WS-9A | W748S/W748S | 2 | 13 | + | + | + | + | − | + | − |
| WS-10A | W748S/W748S | 16 | 24 | + | + | + | + | + | + | + |
| WS-12A | W748S/W748S | 15 | 57 | + | + | + | + | + | − | + |
| CP-4A | A467T/W748S | 14 | 23 | + | + | + | + | − | + | − |
| CP-4B | A467T/W748S | 13 | 21 | + | + | + | + | − | + | − |
| Mean/total | 12.2 ± 4.7 | 34.8 ± 14.3 | 12/12 | 12/12 | 12/12 | 12/12 | 7/12 | 10/12 | 7/12 | |
| AL-1A | A467T/G303R | 0.9 | 1.1 | + | + | − | − | − | + | + |
| AL-1B | A467T/G303R | 2.0 | 8,0 | + | + | + | − | − | + | + |
| AL-2A | A467T/G848S | 0.6 | 0.6 | + | + | − | − | − | + | − |
| Mean/total | 1.2 ± 0.7 | 3.2 ± 4.1 | 3/3 | 3/3 | 1/3 | 0/3 | 0/3 | 3/3 | 2/3 | |
+ = feature present or tissue available; − = feature not present or tissue not available; FFPE = formalin-fixed, paraffin-embedded; PEO = progressive external ophthalmoplegia; SLE = strokelike episode.
Controls had no known neurological disease or injury, did not use antiviral medication, and had normal routine histology in all brain samples collected. Fresh frozen tissue was collected prospectively from 17 controls, comprising 12 adults and children with a mean age of 42.3 ± 22.2 years and 5 infants (<1 year old) with a mean age of 0.11 ± 0.16 years; formalin-fixed paraffin-embedded (FFPE) tissue was available from a further 6 subjects with an average age of 42 ± 9.7 years and an 85-year-old patient with advanced, histologically confirmed Alzheimer disease.
Tissue Material
Samples were collected from the frontal, temporal, and occipital cortex, hippocampus, thalamus, striatum (putamen), cerebellar cortex, dentate nucleus, mesencephalon at the level of the substantia nigra, pons, medulla oblongata at the level of the inferior olivary nucleus, and cervical spinal cord. Samples were dissected at autopsy and either snap-frozen in isopentane cooled in liquid nitrogen and stored at −80°C or fixed in formaldehyde and embedded in paraffin blocks according to standard procedures. There were no significant differences in postmortem interval or length of fixation between patient and control tissue.
Histology and Morphometric Analysis
Routine investigation of FFPE sections included hematoxylin and eosin (H&E), cresyl violet, Luxol myelin stain, and glial fibrillary acidic protein immunohistochemistry. Routine morphological examination with H&E was performed on all samples from all patients and controls. Morphometric analysis and cell counting were performed using a light microscope (Leica, Wetzlar, Germany) equipped with a Zeiss AxioCam MRc5 camera and Zen 2011 software (Carl Zeiss MicroImaging, Jena, Germany). Cell counting was performed on 4μm-thick sections immunohistochemically stained for porin (which stains all neurons irrespective of respiratory chain status) in the cerebellar cortex, dentate nucleus, and inferior olivary nucleus. Only neurons with a clearly visible nuclear morphology were counted. In the cerebellum, the length of the Purkinje cell layer was measured at ×25 magnification, all Purkinje cells fulfilling the above criteria were counted, and cell density was calculated as Purkinje cells/mm. The total area of the dentate and inferior olivary nuclei available on the section was measured, neurons were counted as above, and neuronal density was calculated as neurons/mm2. Eosinophilic neuronal necrosis was defined as neurons with intensely eosinophilic cytoplasm and pyknotic nucleus with no discernible nucleolus.
Histochemistry and Immunohistochemistry
Immunohistochemistry for respiratory complexes I, II, III, and IV and the mitochondrial membrane protein porin was performed on 15 patients and histochemistry for cytochrome oxidase (COX) and succinate dehydrogenase (SDH) on 8 as previously described.6
Cell Death Studies
Ten patients and 7 controls were studied (see Supplementary Table) by caspase-3 immunohistochemistry and terminal deoxynucleotide transferase–mediated deoxyuridine triphosphate nick-end labeling (TUNEL) assay. Caspase-3 immunohistochemistry was performed as previously described.6 TUNEL was performed on 8μm-thick frozen sections using a commercial kit (In Situ Cell Death Detection Kit, Fluorescein, v16.0; Roche, Basel, Switzerland) according to the manufacturer's protocol.
Neuron Microdissection
Neurons for mtDNA analysis were microdissected from different CNS areas of 8 patients and 17 age-matched controls (see Supplementary Table). Microdissection and cell lysis were carried out as previously described.6 Only cells that could be positively identified as neurons, with a visible nucleus and normal morphological characteristics, were used. For each area, there was no significant size difference between neurons of patients and corresponding controls. A total of 4,012 neurons were picked from 8 patients (n = 1,896) and 17 age-matched controls (n = 2,116). Neurons were microdissected, avoiding carryover of glia or other cells, and pooled in groups of 10 in the cortex (n = 2,456 pyramidal neurons in total) and hippocampal CA formation (n = 250); 15 in the substantia nigra (n = 360); 5 in the cerebellum (n = 490 Purkinje cells), dentate (n = 165 principal dentate neurons), and olivary (n = 175 principal olivary neurons) nuclei; and 4 in the anterior horn of the spinal cord (n = 116 alpha motor neurons).
mtDNA Studies
mtDNA quantification and deletion assessment was performed in gray matter homogenate and in microdissected neurons of 8 patients and 17 age-matched controls (see Supplementary Table) using quantitative PCR (qPCR) and long-range PCR (LPCR) as previously described.6 Assessment of mtDNA point sequence variants was performed in genomic DNA extracted from frontal cortical homogenate of 6 patients (2 A467T homozygous and 4 W748S homozygous) and 5 age-matched controls (see Supplementary Table). Point mutations were detected with an UDS assay using FLX GS technology (Roche 454 Life Sciences, Branford, CT) as previously described.20 Two regions of mtDNA were amplified and subsequently sequenced: 1 in the noncoding hypervariable region MT-HV2, known to have a high mutational rate, and 1 in the highly conserved, peptide-coding MT-CO3 gene. PCR products were purified using Agencourt Ampure XP beads (Beckman Coulter, Fullerton, CA) and quantified using a Qubit 2.0 Fluorometer (Life Technologies, Grand Island, NY). Samples were pooled into equimolar libraries and processed for bidirectional amplicon sequencing using Titanium (XLR70) chemistry (Roche) and a GS-FLX (v2.8 sequencing software) according to the manufacturer's instructions (Roche).
Bioinformatic Analyses
PyroBayes (v1.1) and Mosaik (v0.9.0891) algorithms were used in sequence base calling and alignment. Subsequent analysis of variants was done within R using a custom-made R library flowgram.19 Homopolymer tracts (n ≥ 4) within the amplicons were excluded from analysis, to minimize pyrosequencing derived base-calling error. Variants were recorded if present in both directions with ≥0.2% heteroplasmy as previously described.20
Statistical Analyses
Statistical analyses were performed in SPSS (v.20.0.0.1; IBM, Armonk, NY) and Prism (v6; GraphPad, San Diego, CA). Comparison of proportions of point mutations between groups was done by chi-square test. Comparison of mtDNA quantity between groups was performed by Mann–Whitney U test. Cell densities were compared by 2-tailed t test, and correlation analysis was done using Pearson coefficient.
Results
POLG Mutations Cause Acute Focal Neuronal Necrosis Superimposed on a Background of Chronic Neurodegeneration
Histopathological findings fell into 3 categories: acute focal lesions, diffuse progressive changes with uniform intraregional distribution, and mildly or unaffected areas. These findings are detailed in Table 2.
TABLE 2.
Pathology Findings in Polymerase Gamma Encephalopathy
| FENN Lesion | Neuronal Loss and Gliosis | ||||||||||||
|---|---|---|---|---|---|---|---|---|---|---|---|---|---|
| Patient | AAD | Cerebral Cortex | Cerebellar Cortex | Other | Thalamus | Striatum | Substantia Nigra | Red Nucleus | Cerebellar Cortex | Dentate Nucleus | Olivary Nucleus | Pons | DCD |
| AT-1A | 44 | Y | N | Thalamus | ++ | − | NA | NA | + | − | + | − | +++ |
| AT-1B | 47 | Y | N | + | − | NA | NA | + | − | + | NA | NA | |
| AT-2A | 53 | Y | Y | NA | NA | +++ | +++ | ++ | + | NA | − | NA | |
| WS-1A | 41 | Y | N | + | − | +++ | +++ | +++ | +++ | NA | NA | +++ | |
| WS-3A | 43 | Y | N | NA | NA | +++ | +++ | ++ | +++ | + | − | NA | |
| WS-8A | 28 | Y | N | ++ | − | +++ | NA | +++ | ++ | ++ | NA | +++ | |
| WS-9A | 13 | Y | Y | Hippocampus CA1 | ++ | ++ | NA | NA | +++ | NA | + | + | NA |
| WS-10A | 24 | Y | N | Thalamus | + | − | ++ | NA | +++ | − | + | − | +++ |
| WS-12A | 57 | Y | Y | + | − | +++ | NA | ++ | ++ | − | − | NA | |
| CP-4A | 23 | Y | N | ++ | NA | NA | NA | +++ | +++ | NA | NA | +++ | |
| CP-4B | 21 | Y | Y | NA | NA | NA | NA | +++ | +++ | NA | − | ++ | |
| AL-1A | 1.1 | Y | N | Hippocampus CA1 | NA | NA | NA | NA | − | − | NA | − | NA |
| AL-1B | 8.0 | Y | Y | Hippocampus CA1 | NA | − | NA | NA | +++ | +++ | + | − | +++ |
| AL-2A | 0.6 | Y | N | Hippocampus CA1 | ++ | NA | + | NA | + | − | − | − | − |
| Total | 14/14 | 9/14 | 9/9 | 1/8 | 7/7 | 3/3 | 13/14 | 8/13 | 7/9 | 1/10 | 7/8 | ||
Pathology is graded according to severity as normal (−), mild (+), moderate (++), and severe (+++).
AAD = age at death in years; DCD = dorsal column degeneration in the spinal cord; FENN = focal energy-dependent neuronal necrosis; N = absent; NA = not available; Y = present.
Focal, sharply demarcated lesions were seen in the neocortex (14 of 14 patients), hippocampus CA region (4 of 14), thalamus (2 of 9), and cerebellar cortex (9 of 14). These were characterized by selective neuronal loss, eosinophilic neuronal necrosis, vacuolation of the neuropil, astrocytosis, and diffuse microglial activation (Fig 1, Table 2). Neuronal loss in the cerebral cortex had a laminar pattern, being most pronounced in the superficial (II–III) and deep (V–VI) layers. Surviving neurons with normal cytoplasmic and nuclear morphology were scattered throughout the lesion (see Fig 1E, F), and there was no infiltration by peripheral inflammatory cells. The cortical microvasculature in and around the lesions was patent, and in 4 cases increased vascularity was found within the lesions.
FIGURE 1.
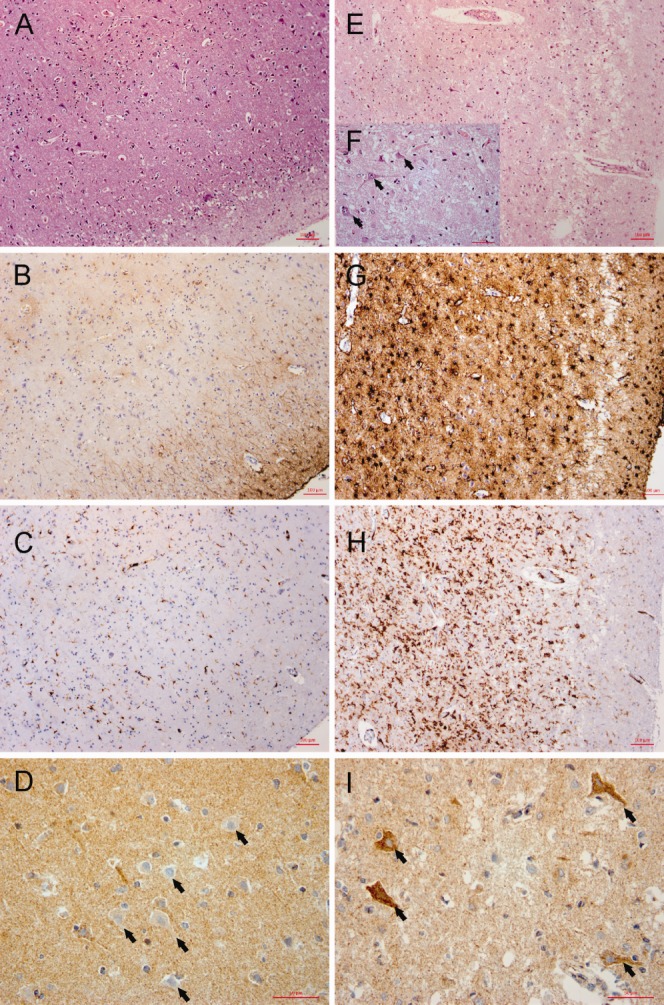
Histopathological and immunohistochemical analysis of acute lesions in polymerase gamma encephalopathy. Brain histology from a representative patient (WS-1A) compares unaffected cortex (left side, A–D) and an acute cortical lesion (right side, E–I). Sections are either stained with hematoxylin and eosin (A, E, F), or react immunohistochemically to glial fibrillary acidic protein (B, G), the microglial marker HLA-DR (C, H), or complex I subunit NDUFB8 (D, I). Original magnification = ×100. (F) Magnified (original magnification = ×400) detail from E. The acute lesion is characterized by severe but incomplete neuronal loss (E and F) and vacuolation of the neuropil. Surviving neurons with normal morphological characteristics (arrows in F) are scattered throughout the acute lesion. There is pronounced astrocytosis (G) and diffuse microglial activation (H). In the neighboring, morphologically preserved cortex (D, arrows), there is a high proportion of complex I–negative neurons, but only complex I–positive cells survive within the acute lesion (I). Scale bars = 100μm (A–C, E, G, H), 50μm (D, F, I).
Cortical acute lesions correlated with the localization of acute strokelike lesions on MRI and epileptiform activity on EEG, and there was a clear predilection for the occipital and frontal lobes, whereas the temporal neocortex was universally spared (histologically and on MRI). All 4 patients with the earliest disease onset and age of death had focal lesions confined to the CA1 area of the hippocampus, whereas the hippocampal formation showed normal morphology in the remaining patients. Focal lesions were seen in the cerebellar cortex of 8 patients and were characterized by severe Purkinje and granule cell loss and Bergmann gliosis. These lesions could be multiple, but were often microscopic (Fig 2E, F) and not always detected by MRI.
FIGURE 2.

Cerebellar pathology in polymerase gamma encephalopathy: comparison of patients with the W748S and/or A467T mutations. Cerebellar sections from patients stained with hematoxylin and eosin (A–D) or porin immunohistochemistry (E, F) are shown. Patients are homozygous for the A467T (A, B), homozygous for the W748S (C, D), or compound heterozygous in transit for the A467T and W748S mutations (E, F). The cerebellum shows a combination of 2 types of pathology: diffuse neurodegeneration with Purkinje cell loss, Bergmann gliosis, and thinning of the molecular layer (A–F) and microscopic focal, sharply demarcated lesions (E, F). Diffuse degenerative changes are significantly more severe in the W748S homozygous (C, D) and compound heterozygous (E, F) compared to A467T homozygous (A, B) patients.
Diffuse, uniformly distributed changes consisted of neuronal loss and gliosis affecting mainly the cerebellar dentato-olivary and dentatorubral systems, thalamus, and substantia nigra. In the cerebellar cortex, there was diffuse, uniform Purkinje cell loss in addition to the focal lesions (see Fig 2). The dentate nucleus showed severe neuronal loss in addition to pronounced cytoplasmic accumulation of lipofuscin pigment in remaining neurons. Purkinje cell loss was significantly (p = 0.0006) more severe in patients homozygous for W748S and compound heterozygous patients (Purkinje cell count = 29.2 ± 14.1% of controls) than in the A467T homozygous patients, who showed only mild reduction of Purkinje cell numbers (Purkinje cell count = 81.5 ± 13.4% of controls). Neuronal loss in the dentate also appeared to be more pronounced in the W748S and compound heterozygous patients (dentate neuronal count = 47.7 ± 28.5% of controls) than in the A467T homozygous patients (dentate neuronal count = 82.4 ± 22.6% of controls), but this difference was not statistically significant. Cerebellar neuronal loss correlated with MRI findings of more pronounced cerebellar and dentate atrophy in the W748S homozygous and compound heterozygous patients than in the A467T homozygous patients. Despite this, we detected no significant clinical difference in the severity of ataxia in the 2 groups.
The thalamus was abnormal in all patients studied (9 of 9), showing diffuse neuronal loss and gliosis in addition to circumscribed focal lesions in 2 patients. In the substantia nigra, there was severe loss of pigmented, dopaminergic neurons, which was most pronounced in the ventrolateral tier. A detailed description of the nigral pathology is described elsewhere.6 In the brainstem, there was pronounced neuronal loss and gliosis in the locus coeruleus6 and the inferior olivary nucleus. In the spinal cord, there was severe, selective degeneration of the dorsal funiculus, which was more pronounced in the fasciculus gracilis, as previously described.9
Regions of the cerebral neocortex and hippocampus not affected by focal lesions and the striatum showed either normal morphology or only mild neuronal loss as evidenced by mildly increased numbers of astrocytes in the cortex and underlying white matter. The pons and medulla oblongata appeared structurally preserved, with the exception of the locus coeruleus and olivary nucleus.
Patient Neurons Show Selective and Progressively Increasing Deficiency of Respiratory Complex I
Immunohistochemistry revealed significant numbers of complex I–deficient neurons in POLG patients (Table 3, Fig 3), but no deficiency of complexes II and III or porin and only a small number of complex IV–deficient neurons identified either by COX/SDH histochemistry or immunohistochemistry. No respiratory chain–deficient neurons were found in the controls, with the exception of a few complex I–negative neurons in the substantia nigra (12.5%) and the CA area of the hippocampus (<1%) of the patient with Alzheimer disease.
TABLE 3.
Complex I Deficiency in the Central Nervous System of Patients with Polymerase Gamma Encephalopathy
| Complex I Deficient Neurons, % | |||||||||||||
|---|---|---|---|---|---|---|---|---|---|---|---|---|---|
| Patient | AAD | Frontal Cortex | Hippocampus | Subiculum | Purkinje Cells | Dentate Nucleus | Olivary Nucleus | Substantia Nigra | Red Nucleus | ||||
| DG | CA4 | CA3 | CA2 | CA1 | |||||||||
| AT-1A | 44 | 55.6 | NA | NA | NA | NA | NA | NA | 69.7 | 74.3 | 82.7 | NA | NA |
| AT-1B | 47 | 58 | 9.5 | 63.7 | 52.4 | 80 | 9.9 | 1.2 | 68.8 | 100 | 98.2 | NA | NA |
| AT-2A | 53 | 17.8 | 6.1 | 40.2 | 32.5 | 57.1 | 7.8 | 2.7 | 39.1 | 100 | NA | 92.1 | 45.2 |
| WS-1A | 41 | 50.1 | 16 | 82.5 | 30.5 | 65.1 | 11 | 7.1 | 10.8 | 98.4 | NA | 91.9 | 100 |
| WS-3A | 43 | 32.2 | 11.1 | 34.2 | 33.3 | 46 | 18.9 | 4.3 | 23.0 | 28,6 | NA | 93.2 | 76,3 |
| WS-8A | 28 | 11.6 | 0.9 | 36.8 | 19.8 | 47.2 | 12.3 | 3.5 | 50.5 | 30.8 | 86.6 | 66.7 | NA |
| WS-9A | 13 | 0 | NA | NA | NA | NA | NA | NA | 0.0 | 66.7 | NA | NA | NA |
| WS-10A | 24 | 6 | NA | NA | NA | NA | NA | NA | 0.0 | 46.1 | NA | NA | NA |
| CP-4A | 23 | 10.2 | NA | NA | NA | NA | NA | NA | 10.5 | 19.6 | NA | NA | NA |
| CP-4B | 21 | 10.6 | 4.3 | 22.8 | 3.2 | 33.3 | 2.7 | 1.3 | 9.2 | 97 | NA | NA | NA |
| Mean | 33.7 | 25.2 | 8.0 | 46.7 | 28.6 | 54.8 | 10.4 | 3.4 | 28.2 | 66.1 | 89.2 | 86 | 73.8 |
| STD | 13.4 | 22 | 5.4 | 22.1 | 16.3 | 16.4 | 5.3 | 2.1 | 27 | 34.6 | 8.1 | 12.9 | 27.5 |
| AL-1A | 1.08 | 0 | 0 | 31.6 | 1.3 | 0 | 0 | 0 | 0 | 28.4 | NA | NA | NA |
| AL-1B | 8 | 0 | NA | NA | NA | NA | NA | NA | 0 | 100 | 80.1 | NA | NA |
| AL-2A | 0.65 | 0 | 0 | 58.3 | 0 | 0 | 0 | 0 | 0 | 4.3 | 0 | 56.9 | NA |
| Mean | 3.2 | 0 | 0 | 45.0 | 0.7 | 0 | 0 | 0 | 0 | 44.2 | 40.1 | 56.9 | |
| STD | 4.1 | 18.9 | 0.9 | 49.8 | 56.6 | ||||||||
AAD = age at death in years; DG = dentate gyrus; NA = not available; STD = standard deviation.
FIGURE 3.

Respiratory chain dysfunction in polymerase gamma (POLG) encephalopathy. Serial sections of the hippocampal CA2 region (A–F) and inferior olivary nucleus (G–I) from a representative patient (AT-1B) are shown. There is severe and selective complex I (anti-NDUFB8) deficiency (A, G), with only a few complex IV–negative neurons in the hippocampus (D) and none in the olive (H), and normal staining for complexes II (B), III (C), and porin (E, I). Complex I stained all neurons in control hippocampus (F). Neuronal complex I deficiency is progressive in POLG encephalopathy (J). The proportion of complex I–negative neurons increased with age in all central nervous system areas studied. The diagrams in J show the percentage of complex I–negative neurons (y-axis) as a function of individual patient age in years (x-axis) in the frontal cortex, hippocampal CA2 region, substantia nigra, and anterior spinal horn. The dopaminergic neurons of the substantia nigra are the earliest among the studied areas to manifest complex I loss.
The numbers of neurons negative for complex I and IV varied according to region and which type of pathological process affected the area under scrutiny. In focal, acute lesions, with few remaining neurons, most surviving neurons retained complex I staining (see Fig 1I). Thus, the proportion of complex I–negative neurons was significantly lower in these areas (p = 0.03) than in those affected by the chronic process. Acute lesions also contained no complex IV–negative cells. In regions with better-preserved neuronal populations, that is, chronically affected, there were abundant complex I–deficient neurons, and the relative proportion of deficient to nondeficient neurons was accordingly higher (see Table 3, Figs 1D and 3A). Moreover, in these regions with surviving neurons, the number of neurons deficient for complex I (and IV) increased significantly with patient age (see Fig 3J). Few complex I–negative neurons were found in the infant patients, with the exception of the substantia nigra, which showed ∼60% complex I–negative neurons already at the age of 1 year (Patient AL-2A).
The most severe complex I (and IV) defects were found in the substantia nigra, red nucleus, olivary nucleus, and central basal pontine nuclei (peduncular and median), followed by the dentate nucleus, cerebellar Purkinje cells, hippocampal CA2 and CA4 areas, and cerebral neocortex (see Table 3). There was no significant difference in the numbers of neurons negative for complex I or IV between the frontal, temporal, and occipital cortices. The mean ratio of complex IV–negative to complex I–negative neurons showed regional variation being substantially higher in the cerebral cortex (0.35) and Purkinje cells (0.23) than in deeper nuclei, including the dentate (0.03), inferior olive (0.008), and substantia nigra (0.02).
Studies of Cell Death
Caspase-3 staining revealed no positive nuclei in any of the patients. TUNEL was negative in the adult patients, whereas several positive nuclei were seen in Patients AL-1A (age = ∼1 year) and AL-1B (age = 8 years). The same areas were, however, negative for caspase-3.
POLG Mutations Cause Early Quantitative Depletion and Progressive Accumulation of Somatic Damage in the Mitochondrial Genome
Quantification of mtDNA in gray matter homogenate showed normal (n = 5) or moderately reduced (n = 2) mtDNA levels in adult patients and apparent depletion (∼20–30% of age-matched controls) in the children (Patients AL-1A and AL-1B). Investigation of microdissected neurons, however, revealed a different picture. Patient neurons consistently showed a substantial mtDNA depletion compared with age-matched control microdissected neurons; patients had approximately 40 ± 11% (range = 17–56%) of control mtDNA. This difference was found throughout the CNS, with no regional differences, and was highly significant (Figs 4 and 5C). Infants (≤1 year old) had a significantly lower neuronal mtDNA copy number than older individuals, in both the patients and controls. Neuronal mtDNA levels of postinfant and adult patients did not exceed those of control infants (see Fig 4).
FIGURE 4.
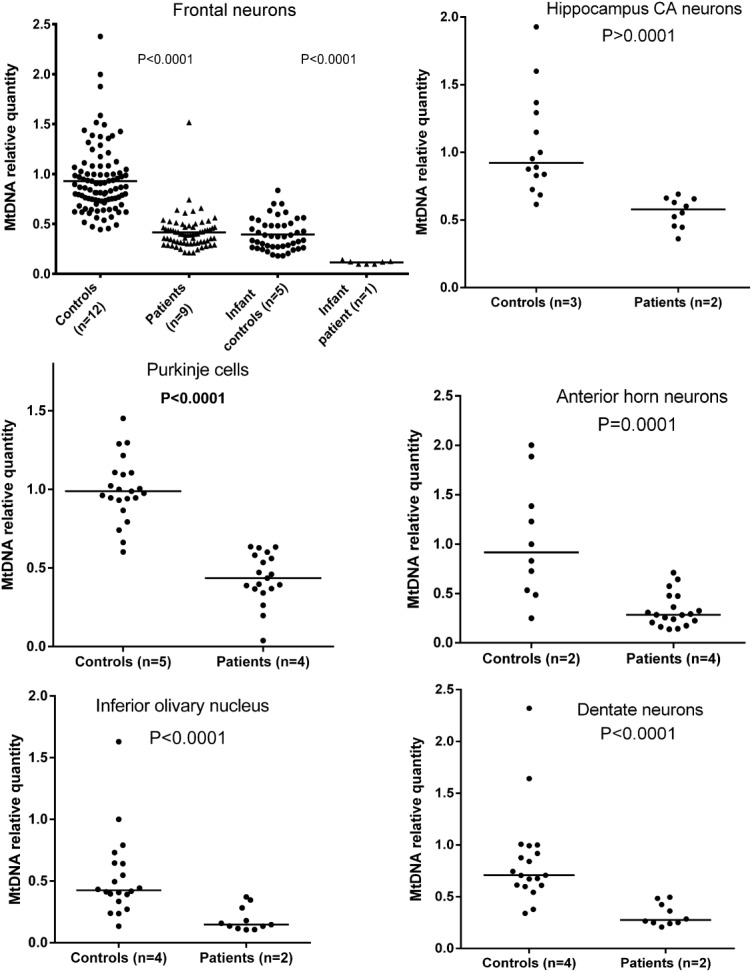
mtDNA relative quantification in microdissected neurons from patients with polymerase gamma encephalopathy. Each point is a pooled sample of 5 to 15 neurons. For the purposes of comparison, a control sample has been arbitrarily set to 1. Groups are compared by Mann–Whitney U test, and p values are shown above each graph; n = number of individuals in each group. Patient neurons from all central nervous system areas examined contain significantly less (∼50–60%) mtDNA than neurons of age-matched controls. The top left panel shows in addition that infants (≤1 year old) have lower neuronal mtDNA content compared to older individuals, in both the patients (infant 26% of postinfant values) and controls (infants 38% of postinfant values).
FIGURE 5.
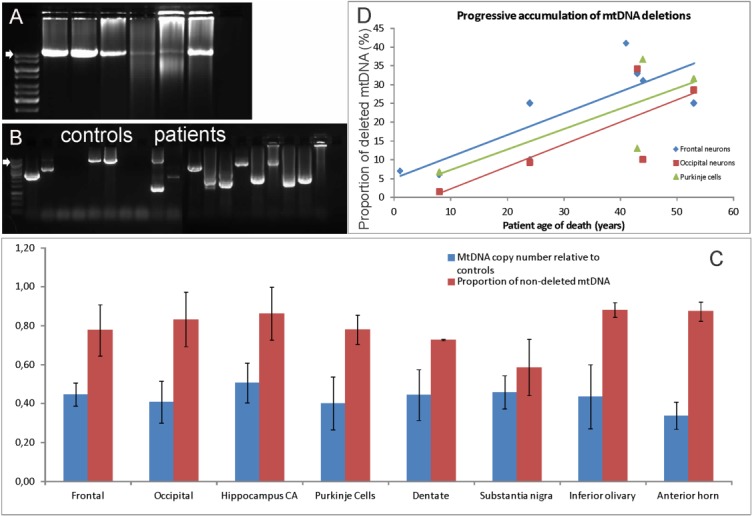
Neuronal mtDNA deletions in polymerase gamma encephalopathy. Long polymerase chain reaction analysis of mtDNA deletions in cortical homogenate (A) and single microdissected neurons (B) from the frontal cortex of patients and controls is shown. (A) Amplification of an 11kb mtDNA fragment in DNA from cortical homogenate. Samples from left to right: 2 controls and 4 patients aged 8, 44, 41, and 24 years, respectively. No deletions are seen in the child, whereas older patients show smears consistent with multiple deletions, which are more pronounced in the older individuals. (B) Results from single microdissected neurons. A nested amplification of an 8kb product was performed from an 11kb amplicon in patients and controls. All patient neurons contain ≥1 deleted species. Deletions are also detected in some of the control neurons, but quantification shows these to be at substantially lower levels than in patients (C, D). Arrows in A and B mark the normal band size. The ladders are 1kb (Gene Ruler). (C) The relative proportions of mtDNA depletion and deletion in microdissected neurons from various areas of the nervous system. Each bar represents the mean with standard deviations; blue bars show mean patient neuronal mtDNA copy number relative to controls, and red bars show levels of nondeleted neuronal mtDNA relative to controls. Depletion levels are similar throughout the nervous system, whereas excess deletion (compared to age-matched controls) is most pronounced in the substantia nigra. (D) The proportion of deleted mtDNA in patient neurons in excess of that seen in age-matched controls is plotted against patient age in years. The level of excess mtDNA deletions increases with patient age in frontal (r = 0.81), occipital (r = 0.78), and Purkinje (r = 0.97) neurons. A similar progressive increase in deletions was found in all brain areas examined.
Deletions of mtDNA were detectable by LPCR in gray matter homogenate and single neurons of patients. Deletions appeared as smears on homogenate PCR, whereas single neurons contained ≥1 deleted species (see Fig 5). Relative quantification of deleted mtDNA by qPCR in microdissected neurons showed that deletion levels in the patients ranged from undetectable in most CNS areas of the infant (Patient AL-1A) and child (Patient AL-1B) to ∼40% higher than age-matched controls in the older adults with the longest disease duration. Notably, the highest levels of excess mtDNA deletion compared to controls were found in the dopaminergic neurons of the substantia nigra. The proportion of deleted mtDNA in the patients significantly increased with age, accumulating at substantially higher levels than in controls.
The UDS assay of mtDNA had a mean coverage of >8,500 sequence reads per amplicon in both forward and reverse directions. The overall burden of mtDNA point mutations present at a frequency >0.2% was significantly higher in patients compared to age-matched controls in both MT-HV2 (odds ratio [OR] = 3, p < 0.0001) and MT-CO3 (p = 0.025). No sequence variation detectable at a frequency >0.2% was found in the highly conserved MT-CO3 region of the controls. MT-HV2 had a significantly higher mutational load than MT-CO3 in both patients and controls (p > 0.0001 for both groups). The great majority of excess point mutations in the patients were present at low heteroplasmy levels (<2%), and their frequency decreased dramatically with increasing heteroplasmy. Overall mutational burden in MT-HV2 was significantly higher in A467T than W748S homozygous patients (OR = 1.86, p = 0.008; Fig 6A), but A467T homozygous patients were also older, and this difference was no longer significant when corrected for age. In the patients, the burden of point mutations showed an apparent increase with age, although this did not reach statistical significance due to the small sample size (r = 0.74, p = 0.09). No age-dependent increase of point variants was seen in the controls (r = 0.27, p = 0.67; see Fig 6B).
FIGURE 6.
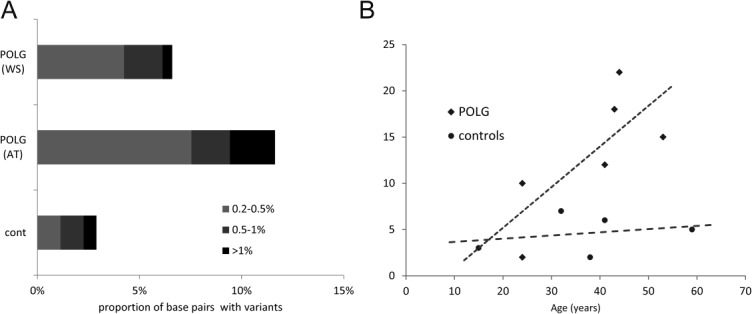
Results of ultradeep resequencing-by-synthesis (UDS) in the brain of patients with polymerase gamma (POLG) encephalopathy. (A) Comparison of mtDNA point mutation burden (at >0.2% frequency) in the MT-HV2 region, in the brain of POLG encephalopathy patients and controls. Patients have a significantly higher burden of low-frequency mutations compared to age-matched controls (odds ratio [OR] = 3, p < 0.001). Patients homozygous for the A467T (AT) mutation have significantly more point mutations than patients homozygous for the W748S (WT) (OR = 1.86, p = 0.008). (B) The number of point mutations (x-axis) detected by UDS in the brain of individual patients is plotted against patient age in years (y-axis). A clear trend (r = 0.74, p = 0.09) for progressive age-dependent increase of mutations is seen in the patients, but not in the controls.
Discussion
Using a combination of clinical, neuropathological, and molecular investigations, we have defined the evolution of this devastating mitochondrial encephalopathy. The earliest feature appears to be depletion of neuronal mtDNA; this was present in the very youngest individuals, who showed little or no morphological abnormality. Gradual loss of complex I in neurons and increasing levels of multiple mtDNA deletions and point mutations correlated with the chronic loss of neurons. Clinically, acute episodes correlated with strokelike lesions on MRI and an epileptic focus on EEG, and these in turn could be correlated with the acute focal pathological lesions that were identified throughout the cortex and in deeper structures. The correlations of clinical, pathological, and molecular features in POLG encephalopathy are summarized in Table 4.
TABLE 4.
Correlation of Clinical, Pathological, and Molecular Features in Polymerase Gamma Encephalopathy
| Feature | FENN | Diffusely Affected | Mildly Affected to Unaffected |
|---|---|---|---|
| Sites | Neocortex, hippocampus, thalamus, and cerebellar cortex | Spinocerebellar, dentato-olivary and dentatorubral systems, thalamus, and substantia nigra | All other areas studied, including non-FENN neocortex and hippocampus |
| Clinical correlate | Acute decompensation (strokelike episode) | Slow progressive decline | — |
| Imaging and EEG correlate | Acute lesions on MRI, epileptogenic foci on EEG | Progressive atrophy and HOD | — |
| Pathological findings | Focal, sharply demarcated lesions showing selective but incomplete neuronal loss, eosinophilic necrosis, astrocytosis, and microglial activation; vascularity may be increased | Diffuse progressive neuronal loss and gliosis | Normal morphology or mildly increased GFAP staining suggesting low-grade astrocytosis and neuronal loss |
| CI-deficient neurons | Rare | Significant numbers of CI-deficient neurons; proportion shows regional differences and increases significantly with age | |
| CIV-deficient neurons | None | CIV-negative neurons present but significantly fewer than CI-deficient neurons; the ratio of CIV/CI-deficient neurons is significantly higher in the cerebral and cerebellar cortex than in the deep gray nuclei and brainstem | |
| mtDNA depletion | Depletion (∼40% of controls) is present from early infancy and remains stable | ||
| mtDNA deletions | Insufficient data | Not present initially; appear later and increase significantly with age mirroring the increasing number of CI- and CIV-deficient neurons | |
| mtDNA point mutations | Not done in FENN | Increase with age compared to controls, reaching significantly higher levels | |
CI = complex I; CIV = complex IV; EEG = electroencephalogram; FENN = focal energy-dependent neuronal necrosis; GFAP = glial fibrillary acidic protein; HOD = hypertrophic olivary degeneration; MRI = magnetic resonance imaging.
Mutations in POLG cause a combination of mtDNA damage in the CNS including quantitative depletion, multiple deletions, and an increased burden of point mutations. Our data show that the detection and accurate quantification of depletion require studies in microdissected neurons. Quantitative studies in brain homogenate either underestimate mtDNA depletion, due to the presence of non-neuronal cells with normal mtDNA levels, or overestimate it, as in cases with severe global destruction, such as Patients AL-1B and AL-1A. Furthermore, we show that mtDNA depletion is both a universal phenomenon, that is, found in all patient neurons irrespective of type or site, and an early, but nonprogressive event starting before the first year of life. That depletion remains unchanged irrespective of how long the patients lived with the disease raises the possibility that there is an absolute level below which it is not possible for the cell to survive.
Whether mtDNA depletion is present already in the ovum and/or reflects incomplete mtDNA copy number expansion during embryogenesis is unknown. Neuronal mtDNA content is known to increase from infant to adult life in normal individuals, most probably as a result of neuronal differentiation and growth. That the lowest mtDNA levels were found in the affected infant suggests that a developmental defect of mtDNA synthesis is present in patients with POLG mutations compromising this initial expansion of mtDNA. Deletions of mtDNA could not be detected in the youngest patients, but appeared in neurons of patients with longer disease duration (and who were older) at levels substantially higher than controls. Deletions affected all CNS areas studied, but showed a predilection for neurons of the substantia nigra. Nigral neurons have a known inherent predisposition for accumulating mtDNA deletions both with age and in conditions associated with neurodegeneration.21–23 One study suggested this may be related to the dopaminergic metabolism24; however, irrespective of etiology, the predilection of nigral neurons for mtDNA deletions correlates with the early and severe complex I deficiency and neuronal loss in this area, suggesting that they play an important pathogenic role.6
We show that UDS is an effective method and superior to cloning-based techniques for detecting and measuring somatic mtDNA mutagenesis in the brain. The finding of increased levels of mtDNA point mutations in the brain of patients with POLG mutations is novel. Although similar to previous findings in skeletal muscle,19,20 the mutational burden appeared higher in the brain, correlating with its more severe involvement in this type of POLG disease. The low individual frequency of each mutation explains why they were not detected by less sensitive techniques.12 Our data suggest a progressive age-dependent accumulation of point mutations in the patients, and the finding that most occur at very low individual frequencies (<1%) suggests that these are acquired somatic mutations caused by increased error rate and/or impaired repair function of POLG. Moreover, the preexisting mtDNA depletion may be enhancing the process of mutagenesis by limiting the available pool of mtDNA molecules and facilitating the clonal expansion of those somatic mutations within cells.
Although these mutations occurred at very low frequencies, a pathogenic contribution cannot be excluded. If point mutations occur exclusively or primarily in neurons, quantifying them in brain homogenate will underestimate their proportion in neuronal cells. Moreover, by occurring on a background of already substantial mtDNA damage due to depletion and accumulating deletions, point mutations decrease further the number of wild-type mtDNA molecules available for respiratory complex synthesis, bringing the cells closer to the threshold for respiratory deficiency.
In the face of a substantially decreased mtDNA copy number and progressive decline in mtDNA quality, the development of respiratory chain dysfunction is hardly surprising. Why this selectively affects complex I is, however, unclear. One explanation is that complex I contains the highest number (7) of mtDNA-encoded subunits, most of which (5) are located within the region commonly affected by deletion. Moreover, studies suggest that neuronal complex I is functioning close to its maximum capacity.25 It may, therefore, be the most vulnerable to defects of mtDNA homeostasis, including mutations of POLG and Twinkle, the mitochondrial helicase.26 It has been suggested that the loss of complex I may be a protective mechanism that serves to limit the potential damage that an inefficient respiratory chain might cause.26 Whether complex I deficiency is a primary consequence of the disease or a secondary adaption is a question that remains to be addressed. We found no evidence of increased complex II activity or complex IV loss, despite the significant degree of mtDNA damage.
Irrespective of what causes the complex I deficiency, it appears that the ability of neurons to produce energy is compromised. Our data suggest that this energy deficiency results in 2 distinct but overlapping pathophysiological processes, 1 chronic and 1 acute.
Vulnerable neuronal populations, including those in the cerebellum, thalamus, and substantia nigra, exhibit a substantial, time-dependent cell loss. Degeneration of the cerebellum and its connections, including the dentato-olivary and dentatorubral systems and dorsal column tracts, causes a progressive spinocerebellar ataxia. Interestingly, although cerebellar changes were significantly less pronounced in the A467T homozygous patients, their ataxia was equally severe. This may have to do with the large proportion of complex I–negative neurons in their cerebellum and basal pontine nuclei, which relay the cortical input to the cerebellum. Although these neurons have otherwise normal morphology, it is possible that lack of complex I decreases their metabolic capacity, leading to functional impairment. Another factor explaining the ataxia of the A467T patients is the degeneration of the proprioceptive dorsal spinal tracts, which is equally pronounced in both A467T and W748S homozygous patients.
The cerebral cortex, striatum, and pons appear more resistant to the chronic effects of complex I deficiency. Neurons in these areas are able to survive, but can still be seen as primed for injury due to their marginal energy-generating capacity. Seizures abruptly increase neuronal energy demand, and we suggest that it is this that precipitates the acute focal lesions in areas such as the neocortex, hippocampus, and thalamus. Epileptic activity can also explain the acute lesions in the cerebellum. Studies have shown that epileptogenic foci may exist within the cerebellum,27,28 but these are difficult to detect by surface recordings. Moreover, although the role of the cerebellum in epileptogenesis remains controversial, studies suggest that it may be secondarily affected by epileptic activity elsewhere in the cortex. Studies of perfusion using single photon emission computed tomography and functional MRI show evidence of increased cerebellar activity during clinical seizures of cortical source and interictally.29,30 This suggests that clinical or subclinical cortical epileptic activity may lead to increased metabolic activity in the cerebellum, triggering acute focal lesions locally.
Neuronal energy failure would also explain why apoptosis is not seen; apoptosis requires energy, whereas necrosis is favored in states of severe energy deficiency.31 We suggest, therefore, that describing these lesions as “strokelike” is inaccurate, and propose the novel descriptive term focal energy-dependent neuronal necrosis.
In conclusion, this work elucidates the mechanisms underlying neurodegeneration and clinical evolution in a mitochondrial encephalopathy. We show how mitochondrial dysfunction resulting from accumulating mtDNA damage leads to chronic neuronal loss in susceptible regions, while at the same time it primes the brain for acute injury triggered and propagated by epileptic seizures. These findings explain the high morbidity and mortality that have been associated with epilepsy in this disorder and highlight the importance of early detection and aggressive treatment of seizures in these patients.
Ethical Considerations
Informed consent for the autopsy was obtained from the families of patients and controls. The tissue study was approved by the Regional Ethical Committee of Western Norway (No. 2010/23).
Acknowledgments
This work was supported by grants from the Western Norway Health Trust, University of Bergen, and Meltzer Foundation.
We thank the patients and their families for making this study possible, and Dr A. Molven and E. Fick for their valuable assistance preparing the tissue material.
Potential Conflicts of Interest
Nothing to report.
Supporting Information
Additional Supporting Information may be found in the online version of this article.
Supplementary Information
References
- 1.Van Goethem G, Dermaut B, Lofgren A, et al. Mutation of POLG is associated with progressive external ophthalmoplegia characterized by mtDNA deletions. Nat Genet. 2001;28:211–212. doi: 10.1038/90034. [DOI] [PubMed] [Google Scholar]
- 2.Trifunovic A, Wredenberg A, Falkenberg M, et al. Premature ageing in mice expressing defective mitochondrial DNA polymerase. Nature. 2004;429:417–423. doi: 10.1038/nature02517. [DOI] [PubMed] [Google Scholar]
- 3.Luoma P, Melberg A, Rinne JO, et al. Parkinsonism, premature menopause, and mitochondrial DNA polymerase gamma mutations: clinical and molecular genetic study. Lancet. 2004;364:875–882. doi: 10.1016/S0140-6736(04)16983-3. [DOI] [PubMed] [Google Scholar]
- 4.Luoma PT, Eerola J, Ahola S, et al. Mitochondrial DNA polymerase gamma variants in idiopathic sporadic Parkinson disease. Neurology. 2007;69:1152–1159. doi: 10.1212/01.wnl.0000276955.23735.eb. [DOI] [PubMed] [Google Scholar]
- 5.Balafkan N, Tzoulis C, Muller B, et al. Number of CAG repeats in POLG1 and its association with Parkinson disease in the Norwegian population. Mitochondrion. 2012;12:640–643. doi: 10.1016/j.mito.2012.08.004. [DOI] [PubMed] [Google Scholar]
- 6.Tzoulis C, Tran GT, Schwarzlmuller T, et al. Severe nigrostriatal degeneration without clinical parkinsonism in patients with polymerase gamma mutations. Brain. 2013;136(pt 8):2393–2404. doi: 10.1093/brain/awt103. [DOI] [PubMed] [Google Scholar]
- 7.Hakonen AH, Heiskanen S, Juvonen V, et al. Mitochondrial DNA polymerase W748S mutation: a common cause of autosomal recessive ataxia with ancient European origin. Am J Hum Genet. 2005;77:430–441. doi: 10.1086/444548. [DOI] [PMC free article] [PubMed] [Google Scholar]
- 8.Tzoulis C, Engelsen BA, Telstad W, et al. The spectrum of clinical disease caused by the A467T and W748S POLG mutations: a study of 26 cases. Brain. 2006;129(pt 7):1685–1692. doi: 10.1093/brain/awl097. [DOI] [PubMed] [Google Scholar]
- 9.Tzoulis C, Neckelmann G, Mork SJ, et al. Localized cerebral energy failure in DNA polymerase gamma-associated encephalopathy syndromes. Brain. 2010;133(pt 5):1428–1437. doi: 10.1093/brain/awq067. [DOI] [PubMed] [Google Scholar]
- 10.Chan SS, Longley MJ, Copeland WC. The common A467T mutation in the human mitochondrial DNA polymerase (POLG) compromises catalytic efficiency and interaction with the accessory subunit. J Biol Chem. 2005;280:31341–31346. doi: 10.1074/jbc.M506762200. [DOI] [PubMed] [Google Scholar]
- 11.Chan SS, Longley MJ, Copeland WC. Modulation of the W748S mutation in DNA polymerase gamma by the E1143G polymorphism in mitochondrial disorders. Hum Mol Genet. 2006;15:3473–3483. doi: 10.1093/hmg/ddl424. [DOI] [PMC free article] [PubMed] [Google Scholar]
- 12.Hakonen AH, Goffart S, Marjavaara S, et al. Infantile-onset spinocerebellar ataxia and mitochondrial recessive ataxia syndrome are associated with neuronal complex I defect and mtDNA depletion. Hum Mol Genet. 2008;17:3822–3835. doi: 10.1093/hmg/ddn280. [DOI] [PubMed] [Google Scholar]
- 13.Zsurka G, Baron M, Stewart JD, et al. Clonally expanded mitochondrial DNA mutations in epileptic individuals with mutated DNA polymerase gamma. J Neuropathol Exp Neurol. 2008;67:857–866. doi: 10.1097/NEN.0b013e3181839b2d. [DOI] [PubMed] [Google Scholar]
- 14.Lax NZ, Hepplewhite PD, Reeve AK, et al. Cerebellar ataxia in patients with mitochondrial DNA disease: a molecular clinicopathological study. J Neuropathol Exp Neurol. 2012;71:148–161. doi: 10.1097/NEN.0b013e318244477d. [DOI] [PMC free article] [PubMed] [Google Scholar]
- 15.Lax NZ, Whittaker RG, Hepplewhite PD, et al. Sensory neuronopathy in patients harbouring recessive polymerase gamma mutations. Brain. 2012;135:62–71. doi: 10.1093/brain/awr326. [DOI] [PMC free article] [PubMed] [Google Scholar]
- 16.Ferrari G, Lamantea E, Donati A, et al. Infantile hepatocerebral syndromes associated with mutations in the mitochondrial DNA polymerase-gammaA. Brain. 2005;128(pt 4):723–731. doi: 10.1093/brain/awh410. [DOI] [PubMed] [Google Scholar]
- 17.Suomalainen A, Majander A, Haltia M, et al. Multiple deletions of mitochondrial-DNA in several tissues of a patient with severe retarded depression and familial progressive external ophthalmoplegia. J Clin Invest. 1992;90:61–66. doi: 10.1172/JCI115856. [DOI] [PMC free article] [PubMed] [Google Scholar]
- 18.Uusimaa J, Hinttala R, Rantala H, et al. Homozygous W748S mutation in the POLG1 gene in patients with juvenile-onset Alpers syndrome and status epilepticus. Epilepsia. 2008;49:1038–1045. doi: 10.1111/j.1528-1167.2008.01544.x. [DOI] [PubMed] [Google Scholar]
- 19.Payne BA, Wilson IJ, Hateley CA, et al. Mitochondrial aging is accelerated by anti-retroviral therapy through the clonal expansion of mtDNA mutations. Nat Genet. 2011;43:806–810. doi: 10.1038/ng.863. [DOI] [PMC free article] [PubMed] [Google Scholar]
- 20.Payne BA, Wilson IJ, Yu-Wai-Man P, et al. Universal heteroplasmy of human mitochondrial DNA. Hum Mol Genet. 2013;22:384–390. doi: 10.1093/hmg/dds435. [DOI] [PMC free article] [PubMed] [Google Scholar]
- 21.Kraytsberg Y, Kudryavtseva E, McKee AC, et al. Mitochondrial DNA deletions are abundant and cause functional impairment in aged human substantia nigra neurons. Nat Genet. 2006;38:518–520. doi: 10.1038/ng1778. [DOI] [PubMed] [Google Scholar]
- 22.Bender A, Krishnan KJ, Morris CM, et al. High levels of mitochondrial DNA deletions in substantia nigra neurons in aging and Parkinson disease. Nat Genet. 2006;38:515–517. doi: 10.1038/ng1769. [DOI] [PubMed] [Google Scholar]
- 23.Reeve AK, Krishnan KJ, Elson JL, et al. Nature of mitochondrial DNA deletions in substantia nigra neurons. Am J Hum Genet. 2008;82:228–235. doi: 10.1016/j.ajhg.2007.09.018. [DOI] [PMC free article] [PubMed] [Google Scholar]
- 24.Elstner M, Muller SK, Leidolt L, et al. Neuromelanin, neurotransmitter status and brainstem location determine the differential vulnerability of catecholaminergic neurons to mitochondrial DNA deletions. Mol Brain. 2011;4:43. doi: 10.1186/1756-6606-4-43. [DOI] [PMC free article] [PubMed] [Google Scholar]
- 25.Kann O, Huchzermeyer C, Kovacs R, et al. Gamma oscillations in the hippocampus require high complex I gene expression and strong functional performance of mitochondria. Brain. 2011;134(pt 2):345–358. doi: 10.1093/brain/awq333. [DOI] [PubMed] [Google Scholar]
- 26.Palin EJ, Paetau A, Suomalainen A. Mesencephalic complex I deficiency does not correlate with parkinsonism in mitochondrial DNA maintenance disorders. Brain. 2013;136(pt 8):2379–2392. doi: 10.1093/brain/awt160. [DOI] [PubMed] [Google Scholar]
- 27.Lascano AM, Lemkaddem A, Granziera C, et al. Tracking the source of cerebellar epilepsy: hemifacial seizures associated with cerebellar cortical dysplasia. Epilepsy Res. 2013;105:245–249. doi: 10.1016/j.eplepsyres.2012.12.010. [DOI] [PubMed] [Google Scholar]
- 28.Rodin E. Paper recordings of ultrafast frequencies in experimental epilepsy. Clin EEG Neurosci. 2005;36:263–270. doi: 10.1177/155005940503600405. [DOI] [PubMed] [Google Scholar]
- 29.Wiest R, Estermann L, Scheidegger O, et al. Widespread grey matter changes and hemodynamic correlates to interictal epileptiform discharges in pharmacoresistant mesial temporal epilepsy. J Neurol. 2013;260:1601–1610. doi: 10.1007/s00415-013-6841-2. [DOI] [PubMed] [Google Scholar]
- 30.Sequeira KM, Tabesh A, Sainju RK, et al. Perfusion network shift during seizures in medial temporal lobe epilepsy. PLoS One. 2013;8:e53204. doi: 10.1371/journal.pone.0053204. [DOI] [PMC free article] [PubMed] [Google Scholar]
- 31.Greijer AE, van der Wall E. The role of hypoxia inducible factor 1 (HIF-1) in hypoxia induced apoptosis. J Clinical Pathol. 2004;57:1009–1014. doi: 10.1136/jcp.2003.015032. [DOI] [PMC free article] [PubMed] [Google Scholar]
Associated Data
This section collects any data citations, data availability statements, or supplementary materials included in this article.
Supplementary Materials
Supplementary Information