

Abstract
Purpose
Rapalogs are allosteric mTOR inhibitors and approved agents for advanced kidney cancer. Reports of clonal heterogeneity in this disease challenge the concept of targeted monotherapy, yet a small subset of patients derives extended benefit. Our aim was to analyze such outliers and explore the genomic background of extreme rapalog sensitivity in the context of intratumor heterogeneity.
Experimental Design
We analyzed archived tumor tissue of five RCC patients, who previously achieved durable disease control with rapalogs (median duration 28 months). DNA was extracted from spatially separate areas of primary tumors and metastases. Custom target capture and ultra-deep sequencing was used to identify alterations across 230 target genes. Whole exome sequence analysis was added to investigate genes beyond this original target list.
Results
Five long-term responders contributed 14 specimens to explore clonal heterogeneity. Genomic alterations with activating effect on mTOR signaling were detected in 11 of 14 specimens, offering plausible explanation for exceptional treatment response through alterations in two genes (TSC1, MTOR). In two subjects, distinct yet functionally convergent alterations activated the mTOR pathway in spatially separate sites. In one patient, concurrent genomic events occurred in two separate pathway components across different tumor regions.
Conclusions
Analysis of outlier cases can facilitate identification of potential biomarkers for targeted agents, and we implicate two genes as candidates for further study in this class of drugs. The previously reported phenomenon of clonal convergence can occur within a targetable pathway which might have implications for biomarker development beyond this disease and this class of agents.
Introduction
In recent years, a better understanding of disease biology has led to the development of several molecularly targeted agents for the clinical management of advanced renal cell carcinoma (RCC)(1). Temsirolimus and everolimus are analogs of rapamycin (rapalogs) and allosteric inhibitors of mTOR complex 1 (mTORC1). Large randomized trials led to their approval in this disease(2, 3), and an unplanned subgroup-analysis suggested efficacy for temsirolimus across different RCC subtypes(4). The clinical benefit of these agents is typically modest with reported median progression free survival (PFS) of less than 6 months.(2, 5) In part, such limitations may relate to clonal heterogeneity which has been reported for this disease(6) and poses a challenge to the use of single-agent targeted therapy as well as to the development of predictive tissue biomarkers(7). Despite such concerns, isolated patients can achieve extended periods of freedom from disease progression while on rapalog therapy.(8, 9) Not all such cases can be attributed to slow kinetics of disease, as some subjects achieve extended benefit following rapid progression on other approved targeted agents such as inhibitors of angiogenesis(10). The biologic basis for this has previously been unknown.
In this study we analyzed archived tissue from nephrectomy specimens and metastases for a small group of patients, who had previously achieved sustained disease control with rapalog therapy. Our objective was to explore the oncogenomic basis for such exceptional therapeutic benefit with attention to intratumor heterogeneity.
Materials and Methods
Study population and Data collection
Five outlier cases of advanced RCC previously treated at our center were selected for tumor genetic analysis. Each had achieved extended duration of disease control with single agent mTOR inhibitor therapy and had archived tumor tissue available for genomic analysis. In order to correct for slow growth kinetics as a possible confounder, we selected patients for whom the treatment duration with rapalogs markedly exceeded prior benefit from first-line VEGF targeted therapy (Table 1).
Table 1. Patient Characteristics.
| Sex | Age | Histologic RCC subtype | MSKCC risk score1,2 | Number of prior regimens | Treatment Duration on prior VEGF targeted agent [months] (agent) | Number of metastatic sites | Rapalog | Treatment Duration on rapalog [months] | |
|---|---|---|---|---|---|---|---|---|---|
| 1 | F | 58 | clear | Int | 1 | 14 (sunitinib) | ≥3 | temsirolimus | 27 |
| 2 | F | 73 | clear | Int | 1 | 3 (sunitinib)3 | 1 | temsirolimus | 34 |
| 3 | M | 66 | clear | Int | 2 | 5 (sunitinib) | ≥3 | everolimus | 20 |
| 4 | F | 60 | clear | Fav | 3 | 11 (sunitinib) | ≥3 | temsirolimus | 28 |
| 5 | F | 50 | unclassified | Fav | 1 | 2 (sunitinib) | ≥3 | temsirolimus | 45+ |
MSKCC: Memorial Sloan-Kettering Cancer Center Int: intermediate; Fav: favorable; VEGF: vascular endothelial growth factor
at the time of first rapalog dose
Motzer, RJ et al., J Clin Oncol 1999;17:2580-2540
discontinued due to treatment toxicity.
Basic demographic information, baseline clinical features, details on prior treatments and the effects of rapalog therapy were collected through individual chart review. Archived specimens were reviewed by a genitourinary pathologist, masked to the results of the oncogenomic analysis, for confirmation of diagnosis (supplementary table S1).
This study was approved by our institutional review board; all patients had previously provided written consent to an institutional tissue procurement protocol.
Sample selection
All patients had previously undergone a nephrectomy (median interval to rapalog therapy 18 months), and fresh frozen tumor specimens (FFS) were available for analysis. Adjacent normal kidney tissue was used for extraction of germline DNA. Intratumor heterogeneity was investigated through extraction of additional DNA samples from morphologically distinct regions within the primary tumor (three patients; formalin-fixed paraffin-embedded specimens; different regions coded as R1, R2, R3, etc.), and metastatic sites (two patients; FFS; coded as M1). A dedicated genitourinary pathologist reviewed all sections and selected areas of tumor and healthy tissue for macro dissection and DNA extraction.
Procedures
DNA from tumors and matched normal tissue was subjected to analysis by two next-generation sequencing platforms. Our custom IMPACT assay (Integrated Mutation Profiling of Actionable Cancer Targets) is a targeted-exome capture assay with ultra-deep sequencing coverage (median 570×) using Illumina HiSeq 2000. Target-specific probes for hybrid selection were designed as previously described(11, 12) to capture all protein-coding exons of 230 oncogenes, tumor suppressor genes and components of pathways deemed actionable by targeted therapies (for full list see supplementary table S2). IMPACT analysis was performed for all samples, with 97% of exons covered at >100×. Whole-exome analysis at standard depth (∼85×) was performed for a subset of samples using the Agilent SureSelect XT HumanAllExon 50Mb on Illumina HiSeq 2000. Single-nucleotide variants, small insertions/deletions, and copy number alterations (CNA) were interrogated. Further details on experimental methodology, algorithms used for mutation calling and run statistics for both IMPACT and whole exome analysis are outlined in the supplementary appendix (supplementary methods; supplementary figures S1 and S2; supplementary tables S3-5). Mutations of interest were confirmed by orthogonal bidirectional Sanger sequencing (supplementary methods; supplementary figures 3 and 4). Lists of all identified mutations and a summary of alterations of interest are included in the supplementary appendix (supplementary tables S6 and S7).
Results
Clinical features for five patients with long-term response to temsirolimus [n=4] or everolimus [n=1] are summarized in table 1. Histologic subtypes included clear cell [n=4] and non-clear cell phenotypes [n=1] (further details provided in supplementary table S1). All subjects had previously received other targeted agents (range 1-3 prior regimens), and all were pretreated with sunitinib (median treatment duration 5 months). The median duration of rapalog therapy across the group was 28 months. One patient remains on therapy, while the remaining four have discontinued drug due to disease progression (individual treatment duration 20, 27, 28, 34, and 45+ months).
For patient #1, IMPACT analysis of the primary tumor at region 1 (R1) revealed presence of a previously unreported somatic TSC1 single nucleotide deletion (c.932delC) with frameshift truncation (figure 1a). Copy number analysis showed a single copy of chromosome 9, where the TSC1 gene resides (figure 1d). Loss of heterozygosity (LOH) with a concurrent frameshift mutation in the remaining allele predicts complete functional impairment of TSC1, a negative regulator upstream of mTOR (figure 1e). Lack of these inhibitory effects suggests hyperactivation of mTORC1 and provides a plausible explanation for sensitivity to rapalog therapy.
Figure 1.
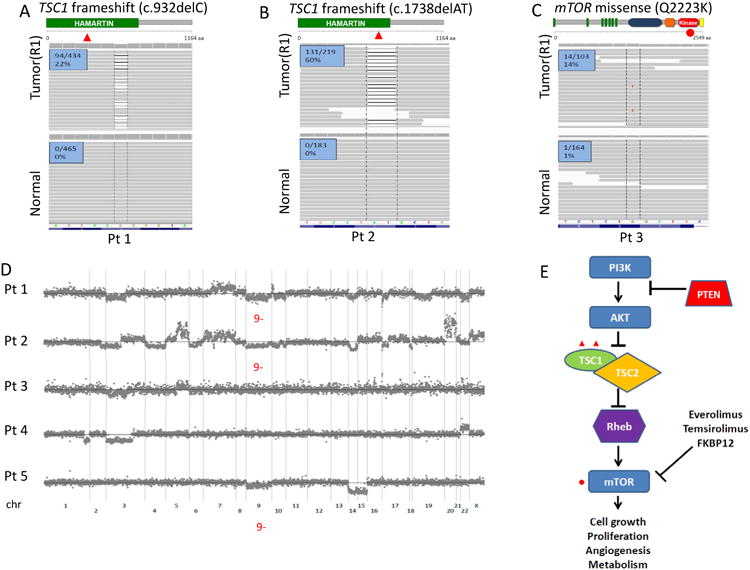
Genomic alterations along the core mTORC1 pathway are identified in patients with exceptional rapalog response using the IMPACT assay. (A, B) Integrated Genomics Viewer (IGV) snapshots of region 1 (R1) of the primary tumors and matched adjacent normal tissues illustrate the c.932delC (P311fs*4) and the c.1738delAT (I580fs*7) frameshift mutations of TSC1 in patients #1 (A) and #2 (B), respectively. Number of reads carrying the mutation is noted. (C) IGV snapshots of R1 and adjacent normal in patient #3 illustrate the mTOR Q2223K missense kinase domain mutation. (D) Copy number plots of patients #1 to #5 with notations on pertinent chromosomal alterations. TSC1 and mTOR reside on chromosome bands 9q34 and 1p36, respectively. (E) A diagram of the central mTORC1 signaling pathway illustrates mutations identified in the core components from rapalog (everolimus and temsirolimus) responders.
Similarly, the primary tumor of patient #2 harbored a novel somatic TSC1 frameshift mutation (c.1738delAT) predicted to result in truncation of the gene product. Concurrent heterozygous loss of chromosome 9 was again seen (figures 1b and 1d). Similar to patient #1, the combination of these events predicts complete functional abrogation of TSC1 and hyperactivation of mTORC1 signaling.
For patient #3, analysis of the primary tumor demonstrated that region 1 (R1) harbored a novel somatic missense mutation in MTOR with glutamine amino acid substitution to lysine at residue 2,223 (Q2223K) (figure 1c). The affected residue localizes to the PI3K-related kinase domain of the MTOR protein(13), suggesting a functional effect. Three-dimensional modeling, based on the solved PI3K kinase domain structure, suggests that the 2223 glutamine residue is positioned adjacent to the ATP binding site of the catalytic domain and may affect mTOR signaling (figure 2f). Rapalogs target the regulatory FRB domain, found outside the kinase domain, arguing that this Q2223K substitution is unlikely to interfere with rapalog sensitivity. To further investigate these hypotheses, we performed functional in vitro experiments introducing Q2223K mutant mTOR into human embryonic kidney HEK293T cells, determining the phosphorylation status of threonine 389 of S6K (p70S6 kinase), one of the key downstream effectors of mTORC1. Expression of mTOR Q2223K led to stronger S6K phosphorylation than that of wild-type mTOR (figure 2a), and the observed hyperactivation persisted over lower serum concentrations (figure 2b, supplementary figure S5). Q2223K mutant mTOR was equally sensitive to rapamycin and its analogues as wild-type mTOR (figure 2c, supplementary figure S6). Upon co-transfection of exogenous S6K, a process known to augment mTORC1 signaling, we observed further increase in the hyperactivity of mTOR Q2223K with preserved rapamycin sensitivity (figures 2d, 2e). Of note, serine 473 phosphorylation of AKT, a key post-translational modification mediated by mTORC2, was not enhanced by mTOR Q2223K (figure 2d).
Figure 2.
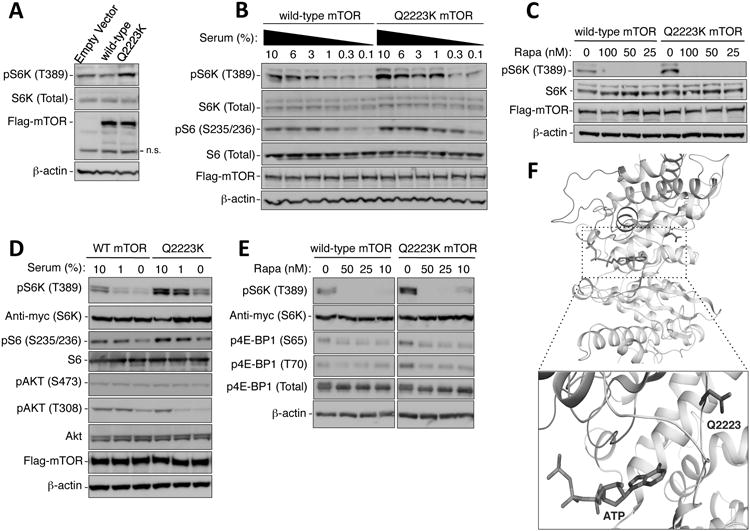
The Q2223K mutation of mTOR causes hyperactivation of mTORC1. (A) The mTOR Q2223K mutant induces more phosphorylation of endogenous S6K at threonine 389 (T389) than wild-type mTOR. HEK293T cells, transfected with the indicated Flag-mTOR constructs for 24 hours, were serum-deprived overnight and then exposed to 1% serum-containing medium for 1 hour. Cellular lysates were subjected to immunoblot analysis using the indicated antibodies. Levels of Flag-mTOR and β-actin indicate equivalent transfection and protein loading, respectively. n.s. denotes non-specific bands. (B) Immunoblots of S6K (T389) and S6 (Serine 235/236; S235/236) phosphorylation demonstrate the hyperactivity of Q2223K mTORC1 over a range of serum concentrations. HEK293T cells, transfected with the indicated Flag-mTOR constructs for 24 hours, were washed with serum free medium, exposed to medium containing the indicated serum concentrations for 1 hour, and analyzed by immunoblots using the indicated antibodies. (C) The hyperactivity of Q2223K can be inhibited by rapamycin. The Q2223K mTORC1 is sensitive to rapamycin as wild-type mTORC1, determined by the phosphorylation of S6K (T389). Experiments were performed as in (B), except with addition of the indicated concentrations (nM) of rapamycin in medium containing 10% serum in the final hour prior to harvest. (D, E) Cells in (D) and (E) were treated similarly to (B) and (C), respectively, except with the co-transfection of Myc-tagged S6K. (F) Structural modeling of the mTOR kinase active site, based on the solved structure of the PI3K kinase domain, illustrates the position of glutamine 2,223. Q2223, shown in blue sticks, is localized on a loop in close proximity to the ATP binding site (an ATP molecule is modeled based on its position in PI3K and is shown as colored: light blue - carbon; red - oxygen; dark blue - nitrogen; orange – phosphorus). The kinase activation and catalytic loops are colored red and green, respectively.
For outlier cases #4 and #5, IMPACT did not detect alterations providing molecular insight into rapalog response (table 3, supplementary table S6). Whole exome sequencing was performed to investigate changes outside of the 230 target genes for IMPACT. This analysis confirmed our findings for Patients #1-3, but failed to reveal relevant genomic events in patients #4 and #5 (supplementary table S7). For patient # 4, IMPACT analysis of tumor tissue from a metastatic site (M1) was not informative either (table 3).
Table 3.
Summary of significant oncogenomic findings across all specimens analyzed for patients #1 to #5.
| Patient | Oncogenomic Findings | Mechanisms for Rapalog-response | |||||
|---|---|---|---|---|---|---|---|
| 1 | R1 | R2 | R3 | Complete Functional Loss of TSC1 | |||
| PI3K/Akt/mTOR pathway alterations: | Somatic mutations: | ||||||
| TSC1 Frameshift | X | X | |||||
| TSC1 Nonsense (Q527*) | X | ||||||
| CNA: | |||||||
| Heterozygous loss of Chr 9 | X | X | X | ||||
| Other pertinent genomic alterations: | Somatic mutations: | ||||||
| VHL Nonsense (E94*) | X | X | X | ||||
| PBRM1 Missense (E991D) | X | X | X | ||||
| CNA: | |||||||
| Heterozygous loss of Chr 3p | X | X | X | ||||
| 2 | R1 | R2 | R3 | M1 | Complete Functional Loss of TSC1 | ||
| PI3K/Akt/mTOR Pathway alterations: | Somatic mutations: | ||||||
| TSC1 Frameshift (c.1738delAT) | X | X | X | X | |||
| CNA: | |||||||
| Heterozygous loss of Chr 9 | X | X | X | X | |||
| Other pertinent genomic alterations: | Somatic mutations: | ||||||
| VHL Missense (H115N) | X | X | X | X | |||
| TP53 Missense (R273H) | X | X | X | X | |||
| CNA: | |||||||
| 3 | R1 | R2 | R3 | R4 | mTOR Activation Mutation /Complete Functional loss of TSC1 | ||
| PI3K/Akt/mTOR Pathway alterations: | Somatic mutations: | ||||||
| mTOR Missense (Q2223K) | X | X | ± | ||||
| TSC1 Nonsense (Q781*) | X | X | |||||
| CNA: | |||||||
| Heterozygous loss of Chr 9 | X | X | |||||
| Other pertinent genomic alterations: | Somatic mutations: | ||||||
| VHL Frameshift | X | X | X | X | |||
| BAP1 splice (G220_splice) | X | X | ± | ||||
| BAP1 splice (Q85_splice) | X | X | |||||
| CNA: | |||||||
| Heterozygous loss of Chr 3p | X | X | X | X | |||
| 4 | M | Unclear | |||||
| PI3K/Akt/mTOR Pathway alterations: | Somatic mutations: | ||||||
| None | |||||||
| CNA: | |||||||
| None | |||||||
| Other pertinent genomic alterations: | Somatic mutations: | ||||||
| VHL Missense (L118P) | X | X | |||||
| PBRM1 Frameshift (c.4019delTCACTGCTGAA | X | X | |||||
| CNA: | |||||||
| Heterozygous loss of Chr 3p | X | X | |||||
| 5 | R1 | Unclear | |||||
| PI3K/Akt/mTOR pathway alterations: | Somatic mutations: | ||||||
| None | |||||||
| CNA: | |||||||
| Heterozygous loss of Chr 9 | X | ||||||
| Other pertinent genomic alterations: | Somatic mutations: | ||||||
| None | |||||||
| CNA: | |||||||
| None | |||||||
For our second study aim, we investigated to what extent our initial findings applied in the context of intratumor heterogeneity. For patient #1, two additional regions (R2, R3) within the primary tumor were examined. All three regions demonstrated similar mutation frequency in VHL, PBRM1, and NFKB1, likely early events in the pathogenesis of this tumor (table 3). Further, they all exhibited LOH in TSC1 via heterozygous loss of chromosome 9. Region R2 carried the identical TSC1 (c.932delC) deletion seen in R1. Region R3, on the other hand, did not; instead, it harbored a novel nonsense TSC1 (Q527*) mutation (tables 2 and 3) with truncating effect. Hence, within the same primary tumor, two different loss-of-function mutations in TSC1 emerged in spatially separate areas, each predicted to have sensitizing effects to rapalog therapy.
Table 2.
Summary of relevant findings of multiregional tumor genetic analysis for patients #1-#5.
| Patient | Region Sampled | Mutations | Copy Number Alteration | Functional effect |
|---|---|---|---|---|
| Patient 1 (temsirolimus × 27 months) | Region 1 Primary Tumor | TSC1 frameshift (c.932delC) | Heterozygous deletion of TSC1 | Functional loss of TSC1 |
| Region 2 Primary Tumor | TSC1 frameshift (c.932delC) | Heterozygous deletion of TSC1 | Functional loss of TSC1 | |
| Region 3 Primary Tumor | TSC1 nonsense (Q527*) | Heterozygous deletion of TSC1 | Functional loss of TSC1 | |
|
| ||||
| Patient 2 (temsirolimus × 34 months) | Region 1 Primary Tumor | TSC1 frameshift (c.1738delAT) | Heterozygous deletion of TSC1 | Functional loss of TSC1 |
| Region 2 Primary Tumor | TSC1 frameshift (c.1738delAT) | Heterozygous deletion of TSC1 | Functional loss of TSC1 | |
| Region 3 Primary Tumor | TSC1 frameshift (c.1738delAT) | Heterozygous deletion of TSC1 | Functional loss of TSC1 | |
| Metastasis | TSC1 frameshift (c.1738delAT) | Heterozygous deletion of TSC1 | Functional loss of TSC1 | |
|
| ||||
| Patient 3 (everolimus × 20 months) | Region 1 Primary Tumor | mTOR missense (Q2223K) | - | Functional gain of mTOR |
| Region 2 Primary Tumor | mTOR missense (Q2223K) | - | Functional gain of mTOR | |
| Region 3 Primary Tumor | TSC1 nonsense (Q781*) | - | Functional gain of mTOR | |
| Region 4 Primary Tumor | TSC1 nonsense (Q781*) | Heterozygous deletion of TSC1 | Functional loss of TSC1 | |
|
| ||||
| Patient 4 (temsirolimus × 28 months) | Primary Tumor | - | - | - |
| Metastasis | - | - | - | |
|
| ||||
| Patient 5 (temsirolimus > 45 months) | Primary Tumor | - | - | - |
For patient #2 we examined two additional regions within the primary tumor (R2, R3) as well as tumor tissue from a distant metastasis (M1). The TSC1 (c.1738delAT) mutation detected in R1 was present across all specimens, which each demonstrated concurrent heterozygous loss of chromosome 9 (tables 2 and 3). Matching results across all sites support the notion that these regions phylogenetically originated from the same clone, and that complete functional loss of TSC1 was an early event in the evolution of this tumor.
For patient #3, three additional regions (R2-4) within the nephrectomy specimen were analyzed. All regions carried the same VHL and MLL3 mutations, indicating shared ancestral lineage. While R2 harbored the same mTOR (Q2223K) mutation detected for R1, the remaining samples did not. Instead, R3 and R4 shared a loss-of-function TSC1 (Q781*) mutation with concurrent heterozygous loss of chromosome 9, neither of which was present in R1 and R2 (tables 2 and 3, supplementary figure 9). Thus, distinct genetic events involving tumor suppressors and growth-promoting genes within the same pathway independently occurred in spatially separate areas during the evolution of this tumor. Via its own mechanism, each of these alterations is predicted to promote mTORC1 signaling in the affected cells, thus rendering them sensitive to rapalog therapy. Co-occurrence of these events offers one possible explanation for this patient's favorable response to everolimus monotherapy, despite intratumor heterogeneity.
Discussion
Rapalogs are standard agents in the management of advanced RCC, but predictive biomarkers are lacking. Prior efforts have investigated expression profiling by immunohistochemistry(14, 15), yet have failed to produce clinically useful results. Management of other solid tumor malignancies incorporates diagnostic molecular analysis of tumor tissue as an essential element of standard clinical care(16-18), and it is reasonable to hypothesize that tumor analysis in RCC might identify acquired genomic alterations that correlate with benefit from rapalog therapy. This is supported by preclinical(19-22) and early clinical data(23, 24) from other malignancies which highlight PI3K and MAPK pathway components as candidate biomarkers for targeted inhibition of the PI3K/mTOR axis.
In this study, we chose to examine a small cohort of outlier cases with exceptional response to rapalog therapy. We hypothesized that this group of patients would be most likely to harbor genetic alterations rendering tumor cells dependent on the targeted pathway. Further, the selected patients had demonstrated markedly better response to mTOR inhibition than to blockade of VEGFR2 signaling with a tyrosine kinase inhibitor, another standard therapeutic approach in advanced RCC. Ultra-deep sequence analysis revealed plausible genomic determinants of treatment benefit in three of five cases. We identified different mechanisms underlying functional activation of the targeted pathway and implicate two genes, TSC1 and MTOR as likely culprits in the examined cases.
Our results, due to the outlier approach we took in selecting this very small cohort, cannot readily be applied to a broader patient population. The findings are, however, compelling, especially when put in context with previously published reports in this disease and other malignancies. Kucejova et al. first implicated TSC1 as a relevant tumor suppressor in sporadic RCC and reported a patient with an inactivating splice site mutation in TSC1 that derived therapeutic benefit from everolimus for 13 months.(25) More recently, Iyer and colleagues reported an association between acquired loss of TSC1 and improved outcome to everolimus therapy in patients with advanced bladder cancer.(24) Heterozygous loss of TSC1 is a common event in RCC, noted in >30% of specimens examined in The Cancer Genome Atlas (TCGA) project (supplementary figure 10)(26, 27), the significance of which remains to be determined. The cases we report here suffered biallelic functional impairment of TSC1, which occurred in ∼1% of samples analyzed in TCGA. The data leading to the approval of everolimus for subependymal giant-cell astrocytomas and angiomyolipoma in patients with tuberous sclerosis complex, a hereditary disorder with hemizygous germline loss of TSC1 or TSC2, lends further support to the notion that these genes should be studied as potentially relevant for rapalog biomarker development in kidney cancer.(28, 29) RCC can arise in the context of tuberous sclerosis complex, typically due to functional loss of the remaining allele of TSC1/TSC2, resulting in complete functional abrogation of the gene product. Although one might expect rapalogs to be effective in this particular setting, no data has previously been published on the matter. In parallel to the cohort reported here, we analyzed tumor tissue from a 16 year-old male with unclassified RCC arising in the background of tuberous sclerosis complex. The patient has been on treatment with everolimus for metastatic disease and bilateral kidney tumors for 44 months at the time of this report. IMPACT analysis of tissue from two separate kidney tumors expectedly demonstrated complete functional loss of TSC2, in one tumor via biallelic loss of the entire gene, in the second via the combination of LOH plus an acquired TSC2 nonsense mutation (Q794*) (supplementary figure 9). Mutations in MTOR were detected in 6% of RCC cases analyzed for TCGA.(26) In functional studies, we find that the majority of these have activating effects on mTORC1 signaling (Pham et al., unpublished data), thus our findings for patient #3 may be of relevance for further biomarker studies.
Recent reports have emphasized the complexity of RCC pathogenetics including the fact that branched clonal evolution occurs on the single-cell level.(6, 30) Gerlinger and colleagues recently presented an L2431P MTOR mutation in a patient treated with everolimus.(6). Despite of functional data suggesting activating effects on mTORC1, this subject suffered disease progression only 7 months after treatment initiation. The authors elegantly demonstrated that L2431P was a late event in the clonal evolution of this patient's disease and absent in the region that gave rise to distant metastases.
Our data also reflects clonal heterogeneity, and we detected both common and private alterations across different regions analyzed for our patients (table 3). To achieve sustainable clinical benefit with cancer therapeutics, some investigators have suggested that the target should be activated by a “trunk” event that occurred early in the clonal evolution of the disease and thus should be common to primary tumor and metastatic sites.(7, 31) This theory is supported by our findings for patient #2, who displayed loss of TSC1 via the same mechanism across all areas sampled within the primary tumor as well as a metastatic site. Our data for patients #1 and #3 suggests that exceptions to this paradigm exist. In both cases, all examined specimens contain underlying events anticipated to activate mTORC1, a plausible explanation for the sustained benefit seen with rapalog therapy. Both subjects, however, harbor distinct alterations in different areas of the tumor, indicating that activation of the targeted pathway ensued independently in spatially separate sites.
The limitations of our data reflect some of the major challenges of exploring tissue biomarkers in this disease. First and foremost, our analysis for patients #1 and #3 were limited to the primary renal tumor, as tissue from metastatic sites was not available for inclusion in our analysis. For patient #1 it not clear whether the clonal origin of the patient's distant disease emerged from an area containing TSC1 c.932delC (reflected in R1-2), an area harboring TSC1 Q527* (reflected in R3), neither of the two areas, or both. The same could be said about the distinct alterations seen in R1-2 vs. R3-4 for patient #3. It is generally considered to be highly possible that several areas of a primary tumor independently give rise to metastatic filiae, resulting in clonal diversity across different metastatic sites. This notion may account for instances where varying responses are observed across different metastatic sites in the same patient, so-called ‘mixed response’. From this perspective, it is important that all areas sampled from primary tumors for outliers #1-3 harbor alterations plausibly suggesting dependence on mTORC1 signaling.
Previous reports using next-generation sequencing have demonstrated occurrence of evolutionary convergent events in genes deemed relevant in this disease, including distinct mutations in SETD2 in separate regions of the same RCC. (6) Similarly, we detected different BAP1 splice site mutations in separate regions of patient #3's primary tumor (table 3). In addition, we here show for the first time that tumor evolution can also converge to key components of the same biological pathway, evident by our finding for patients #1 (two distinct loss-of-function mutations in TSC1 in the same patient) and #3 (alterations in TSC1 and MTOR in the same patient). What brings about such convergent events? One proposed explanation is that in the background of genetic changes acquired earlier in their evolution, separate cells share the same evolutionary pressure towards events in certain genes.(31) It is also well described that select tumor types frequently develop reliance on key biological pathways.(32, 33) This convergence may originate in the genetic and epigenetic landscape of the tumor itself, but it has also been postulated that the microenvironment could play a central role in exerting selective pressure.(34) It is tempting to speculate that clonal convergence within the targeted pathway may have contributed to the extended benefit patients #1 and #3 achieved with rapalog therapy. Without analysis of metastatic sites, this is purely hypothetical. Nevertheless, this idea warrants future study in that it may offer another explanation why isolated patients can achieve dramatic benefit with single-agent targeted therapy despite underlying branched clonal evolution.
Lastly, all patients were pre-treated with VEGF-targeted agents, and analysis of nephrectomy specimen alone precludes appreciation of any effects that prior systemic therapies may have had on the molecular landscape of disease. Together, these considerations argue in favor of incorporating dedicated biopsies of metastatic sites in future biomarker efforts.
The basis for the extended rapalog benefit in patients #4 and #5 remains unclear, as their tumors lacked apparent genetic alterations activating mTORC1 signaling, even by whole exome analysis. This study's focus was genomic profiling for acquired somatic mutations and CNA. Pathway activation, however, does not exclusively occur on the DNA level and alternate mechanisms may underlie the therapeutic benefit from rapalog therapy experienced by patients #4 and #5. A growing list of chromatin modifiers is being implicated as RCC tumor suppressors, some of which have been correlated with clinical outcome.(35, 36) Epigenetics might play a role in mTORC1 signaling and rapalog responsiveness, but were not investigated here. Other complex regulatory mechanisms like post-transcriptional and post-translational gene silencing also should be considered.
In summary, we provide proof of principle and identify candidate genes for future biomarker studies in this disease. Recent TCGA data emphasizes clear cell RCC to be a fundamentally metabolic disease(27). This may explain why modest benefit with rapalog therapy is seen on a broader population of patients, mTORC1 being a central regulator of a multitude of anabolic and catabolic processes(37). It is apparent that a subset of patients can derive profound benefit from these agents. In light of our findings, and considering that alterations within the PI3K pathway are recurrent events in TCGA, a plausible next step would be to investigate the significance of events in key pathway components, including TSC1, TSC2 and mTOR, in an unselected patient population. Certainly, these will be challenging studies to conduct with the need for multidisciplinary collaboration, multiple biopsies per patient, comprehensive profiling with deep sequence coverage and functional modeling of previously unreported mutations.
Supplementary Material
Statement of Translational Relevance.
Although the rapalog-type mTOR inhibitors everolimus and temsirolimus are standard agents in the management of advanced renal cell carcinoma (RCC), efficacy is typically modest and progressive disease ensues within a few months for most cases. A subset of patients can achieve long-term disease control with these agents. The molecular basis for this is unclear, but one can hypothesize that tissue biomarkers might help to identify these subjects a priori. We here present the first data linking genomic tumor analyses with long-term response to rapalog therapy in advanced RCC. Our findings suggest that oncogenomic events activating the targeted pathway can sensitize tumors to mTORC1 inhibitors and put forth several candidate genes for future biomarker development in this class of agents. This will have important implications for this disease and others for which rapalogs are already approved or being studied.
Acknowledgments
This study is supported by grants from the Paula Moss Trust for the research into the cure and treatment of kidney cancer and the J. Randall & Kathleen L. MacDonald Research Fund in Honor of Louis V. Gerstner, Jr. (JJH and RJM); the Tuttle Cancer Research Fund (JJH); the Stephen P Hanson Family Fund Fellowship in Kidney Cancer (AAH); the Geoffrey Beene Cancer Research Center (MFB); the Conquer Cancer Foundation 2012 Young Investigator Award (MHV); NCI Training Grants T32CA009207 (MHV), T32CA082088 (AAH), 5T32CA160001 (ARB) [The content is solely the responsibility of the authors and does not necessarily represent the official views of the National Institutes of Health]; Pfizer Inc; Novartis International AG.
References
- 1.Rini BI, Campbell SC, Escudier B. Renal cell carcinoma. Lancet. 2009;373:1119–32. doi: 10.1016/S0140-6736(09)60229-4. [DOI] [PubMed] [Google Scholar]
- 2.Hudes G, Carducci M, Tomczak P, Dutcher J, Figlin R, Kapoor A, et al. Temsirolimus, interferon alfa, or both for advanced renal-cell carcinoma. The New England journal of medicine. 2007;356:2271–81. doi: 10.1056/NEJMoa066838. [DOI] [PubMed] [Google Scholar]
- 3.Motzer RJ, Escudier B, Oudard S, Hutson TE, Porta C, Bracarda S, et al. Efficacy of everolimus in advanced renal cell carcinoma: a double-blind, randomised, placebo-controlled phase III trial. Lancet. 2008;372:449–56. doi: 10.1016/S0140-6736(08)61039-9. [DOI] [PubMed] [Google Scholar]
- 4.Dutcher JP, de Souza P, McDermott D, Figlin RA, Berkenblit A, Thiele A, et al. Effect of temsirolimus versus interferon-alpha on outcome of patients with advanced renal cell carcinoma of different tumor histologies. Med Oncol. 2009;26:202–9. doi: 10.1007/s12032-009-9177-0. [DOI] [PubMed] [Google Scholar]
- 5.Motzer RJ, Escudier B, Oudard S, Hutson TE, Porta C, Bracarda S, et al. Phase 3 trial of everolimus for metastatic renal cell carcinoma : final results and analysis of prognostic factors. Cancer. 2010 doi: 10.1002/cncr.25219. [DOI] [PubMed] [Google Scholar]
- 6.Gerlinger M, Rowan AJ, Horswell S, Larkin J, Endesfelder D, Gronroos E, et al. Intratumor heterogeneity and branched evolution revealed by multiregion sequencing. The New England journal of medicine. 2012;366:883–92. doi: 10.1056/NEJMoa1113205. [DOI] [PMC free article] [PubMed] [Google Scholar]
- 7.Yap TA, Gerlinger M, Futreal PA, Pusztai L, Swanton C. Intratumor heterogeneity: seeing the wood for the trees. Science translational medicine. 2012;4:127ps10. doi: 10.1126/scitranslmed.3003854. [DOI] [PubMed] [Google Scholar]
- 8.Amato RJ, Jac J, Giessinger S, Saxena S, Willis JP. A phase 2 study with a daily regimen of the oral mTOR inhibitor RAD001 (everolimus) in patients with metastatic clear cell renal cell cancer. Cancer. 2009;115:2438–46. doi: 10.1002/cncr.24280. [DOI] [PubMed] [Google Scholar]
- 9.Atkins MB, Hidalgo M, Stadler WM, Logan TF, Dutcher JP, Hudes GR, et al. Randomized phase II study of multiple dose levels of CCI-779, a novel mammalian target of rapamycin kinase inhibitor, in patients with advanced refractory renal cell carcinoma. J Clin Oncol. 2004;22:909–18. doi: 10.1200/JCO.2004.08.185. [DOI] [PubMed] [Google Scholar]
- 10.Molina AM, Ginsberg MS, Motzer RJ. Long-term response with everolimus for metastatic renal cell carcinoma refractory to sunitinib. Med Oncol. 2010 doi: 10.1007/s12032-010-9640-y. [DOI] [PMC free article] [PubMed] [Google Scholar]
- 11.Gnirke A, Melnikov A, Maguire J, Rogov P, LeProust EM, Brockman W, et al. Solution hybrid selection with ultra-long oligonucleotides for massively parallel targeted sequencing. Nature biotechnology. 2009;27:182–9. doi: 10.1038/nbt.1523. [DOI] [PMC free article] [PubMed] [Google Scholar]
- 12.Wagle N, Berger MF, Davis MJ, Blumenstiel B, Defelice M, Pochanard P, et al. High-throughput detection of actionable genomic alterations in clinical tumor samples by targeted, massively parallel sequencing. Cancer discovery. 2012;2:82–93. doi: 10.1158/2159-8290.CD-11-0184. [DOI] [PMC free article] [PubMed] [Google Scholar]
- 13.Yang H, Rudge DG, Koos JD, Vaidialingam B, Yang HJ, Pavletich NP. mTOR kinase structure, mechanism and regulation. Nature. 2013;497:217–23. doi: 10.1038/nature12122. [DOI] [PMC free article] [PubMed] [Google Scholar]
- 14.Figlin RA, de Souza P, McDermott D, Dutcher JP, Berkenblit A, Thiele A, et al. Analysis of PTEN and HIF-1alpha and correlation with efficacy in patients with advanced renal cell carcinoma treated with temsirolimus versus interferon-alpha. Cancer. 2009;115:3651–60. doi: 10.1002/cncr.24438. [DOI] [PubMed] [Google Scholar]
- 15.Cho D, Signoretti S, Dabora S, Regan M, Seeley A, Mariotti M, et al. Potential histologic and molecular predictors of response to temsirolimus in patients with advanced renal cell carcinoma. Clinical genitourinary cancer. 2007;5:379–85. doi: 10.3816/CGC.2007.n.020. [DOI] [PubMed] [Google Scholar]
- 16.Antonescu CR. The GIST paradigm: lessons for other kinase-driven cancers. The Journal of pathology. 2011;223:251–61. doi: 10.1002/path.2798. [DOI] [PMC free article] [PubMed] [Google Scholar]
- 17.Romano E, Schwartz GK, Chapman PB, Wolchock JD, Carvajal RD. Treatment implications of the emerging molecular classification system for melanoma. The lancet oncology. 2011;12:913–22. doi: 10.1016/S1470-2045(10)70274-6. [DOI] [PubMed] [Google Scholar]
- 18.Lindeman NI, Cagle PT, Beasley MB, Chitale DA, Dacic S, Giaccone G, et al. Molecular testing guideline for selection of lung cancer patients for EGFR and ALK tyrosine kinase inhibitors: guideline from the College of American Pathologists, International Association for the Study of Lung Cancer, and Association for Molecular Pathology. Archives of pathology & laboratory medicine. 2013;137:828–60. doi: 10.5858/arpa.2012-0720-OA. [DOI] [PMC free article] [PubMed] [Google Scholar]
- 19.Di Nicolantonio F, Arena S, Tabernero J, Grosso S, Molinari F, Macarulla T, et al. Deregulation of the PI3K and KRAS signaling pathways in human cancer cells determines their response to everolimus. J Clin Invest. 2010;120:2858–66. doi: 10.1172/JCI37539. [DOI] [PMC free article] [PubMed] [Google Scholar]
- 20.Ihle NT, Lemos R, Jr, Wipf P, Yacoub A, Mitchell C, Siwak D, et al. Mutations in the phosphatidylinositol-3-kinase pathway predict for antitumor activity of the inhibitor PX-866 whereas oncogenic Ras is a dominant predictor for resistance. Cancer research. 2009;69:143–50. doi: 10.1158/0008-5472.CAN-07-6656. [DOI] [PMC free article] [PubMed] [Google Scholar]
- 21.Tanaka H, Yoshida M, Tanimura H, Fujii T, Sakata K, Tachibana Y, et al. The selective class I PI3K inhibitor CH5132799 targets human cancers harboring oncogenic PIK3CA mutations. Clinical cancer research : an official journal of the American Association for Cancer Research. 2011;17:3272–81. doi: 10.1158/1078-0432.CCR-10-2882. [DOI] [PubMed] [Google Scholar]
- 22.Hanrahan AJ, Schultz N, Westfal ML, Sakr RA, Giri DD, Scarperi S, et al. Genomic complexity and AKT dependence in serous ovarian cancer. Cancer discovery. 2012;2:56–67. doi: 10.1158/2159-8290.CD-11-0170. [DOI] [PMC free article] [PubMed] [Google Scholar]
- 23.Janku F, Wheler JJ, Westin SN, Moulder SL, Naing A, Tsimberidou AM, et al. PI3K/AKT/mTOR inhibitors in patients with breast and gynecologic malignancies harboring PIK3CA mutations. J Clin Oncol. 2012;30:777–82. doi: 10.1200/JCO.2011.36.1196. [DOI] [PMC free article] [PubMed] [Google Scholar]
- 24.Iyer G, Hanrahan AJ, Milowsky MI, Al-Ahmadie H, Scott SN, Janakiraman M, et al. Genome sequencing identifies a basis for everolimus sensitivity. Science. 2012;338:221. doi: 10.1126/science.1226344. [DOI] [PMC free article] [PubMed] [Google Scholar]
- 25.Kucejova B, Pena-Llopis S, Yamasaki T, Sivanand S, Tran TA, Alexander S, et al. Interplay between pVHL and mTORC1 pathways in clear-cell renal cell carcinoma. Molecular cancer research : MCR. 2011;9:1255–65. doi: 10.1158/1541-7786.MCR-11-0302. [DOI] [PMC free article] [PubMed] [Google Scholar]
- 26.Cerami E, Gao J, Dogrusoz U, Gross BE, Sumer SO, Aksoy BA, et al. The cBio cancer genomics portal: an open platform for exploring multidimensional cancer genomics data. Cancer discovery. 2012;2:401–4. doi: 10.1158/2159-8290.CD-12-0095. [DOI] [PMC free article] [PubMed] [Google Scholar]
- 27.Cancer Genome Atlas Research N. Comprehensive molecular characterization of clear cell renal cell carcinoma. Nature. 2013;499:43–9. doi: 10.1038/nature12222. [DOI] [PMC free article] [PubMed] [Google Scholar]
- 28.Krueger DA, Care MM, Holland K, Agricola K, Tudor C, Mangeshkar P, et al. Everolimus for subependymal giant-cell astrocytomas in tuberous sclerosis. The New England journal of medicine. 2010;363:1801–11. doi: 10.1056/NEJMoa1001671. [DOI] [PubMed] [Google Scholar]
- 29.Bissler JJ, Kingswood C, Zonnenberg B, Frost M, Belousova E, Radzikowska E, et al. Everolimus Therapy for Angiomyolipoma in Patients with Tuberous Sclerosis Complex or Sporadic Lymphangioleiomyomatosis: Final Results from EXIST-2. J Am Soc Nephrol. 2011;22 Abstract LB-PO3159. [Google Scholar]
- 30.Xu X, Hou Y, Yin X, Bao L, Tang A, Song L, et al. Single-cell exome sequencing reveals single-nucleotide mutation characteristics of a kidney tumor. Cell. 2012;148:886–95. doi: 10.1016/j.cell.2012.02.025. [DOI] [PMC free article] [PubMed] [Google Scholar]
- 31.Swanton C. Intratumor Heterogeneity: Evolution through Space and Time. Cancer research. 2012 doi: 10.1158/0008-5472.CAN-12-2217. [DOI] [PMC free article] [PubMed] [Google Scholar]
- 32.Vogelstein B, Kinzler KW. Cancer genes and the pathways they control. Nat Med. 2004;10:789–99. doi: 10.1038/nm1087. [DOI] [PubMed] [Google Scholar]
- 33.Hanahan D, Weinberg RA. Hallmarks of cancer: the next generation. Cell. 2011;144:646–74. doi: 10.1016/j.cell.2011.02.013. [DOI] [PubMed] [Google Scholar]
- 34.Gatenby RA, Gillies RJ, Brown JS. Of cancer and cave fish. Nature reviews Cancer. 2011;11:237–8. doi: 10.1038/nrc3036. [DOI] [PMC free article] [PubMed] [Google Scholar]
- 35.Hakimi AA, Chen YB, Wren J, Gonen M, Abdel-Wahab O, Heguy A, et al. Clinical and pathologic impact of select chromatin-modulating tumor suppressors in clear cell renal cell carcinoma. Eur Urol. 2013;63:848–54. doi: 10.1016/j.eururo.2012.09.005. [DOI] [PMC free article] [PubMed] [Google Scholar]
- 36.Hakimi AA, Ostrovnaya I, Reva BA, Schultz N, Chen YB, Gonen M, et al. Adverse Outcomes in Clear Cell Renal Cell Carcinoma with Mutations of 3p21 Epigenetic Regulators BAP1 and SETD2: a Report by MSKCC and the KIRC TCGA Research Network. Clinical cancer research : an official journal of the American Association for Cancer Research. 2013 doi: 10.1158/1078-0432.CCR-12-3886. [DOI] [PMC free article] [PubMed] [Google Scholar]
- 37.Laplante M, Sabatini DM. mTOR signaling in growth control and disease. Cell. 2012;149:274–93. doi: 10.1016/j.cell.2012.03.017. [DOI] [PMC free article] [PubMed] [Google Scholar]
Associated Data
This section collects any data citations, data availability statements, or supplementary materials included in this article.